

China's household debt problem (engelse publicatie)

Abstract
De Chinese economie is aan het vertragen omdat zij de, zoals de autoriteiten het stellen, de transitie doormaakt van een ‘high speed’- naar een ‘high quality’-groeimodel. Dit kadert niet noodzakelijk in de verschuiving van een planeconomie naar een meer marktgerichte economie. Het impliceert veeleer dat bepaalde onevenwichtigheden moeten worden gecorrigeerd, waarbij de economie verschuift van een door de industrie en uitvoer geleid groeimodel naar een model dat meer op het binnenland is gericht. Dit betekent niet alleen dat de binnenlandse vraag, de dienstensectoren en de hightech-uitvoer worden gestimuleerd, maar ook dat de economie minder afhankelijk wordt gemaakt van investeringen, vooral sinds de wereldwijde financiële crisis. Als dusdanig wordt verwacht dat de consumptie van de huishoudens een nog belangrijkere motor voor de Chinese economie zal worden. Gezien de toch al aanzienlijke schuldenlast van de Chinese huishoudens bestaat er echter een reëel gevaar dat de consumptie niet de verwachte stimulans voor de economische groei zal geven. De schuldenlast van de Chinese huishoudens bestaat voor 54% uit hypotheekleningen, tegenover 26% uit consumptiekrediet. Dat wijst op het belang van de vastgoedsector voor het toekomstige groeipad van China.
Content table:
- Introduction
- The next stage of Chinese growth
- The debt-burdened elephant in the room
- The importance of real estate
- Walking the line
- Conclusion
Read the publication below or click here to open the PDF.
Introduction
There is no doubt that China’s economy is slowing. After the global financial crisis, annual real GDP growth reached a peak of 10.6% in 2010 and has since decelerated to 6.6% in 2018. Earlier this year the authorities announced a lower growth target for 2019 between 6.0-6.5%, in a sense acknowledging that the slowdown is likely to continue. Most commentary surrounding China describes the ongoing slowdown, at least partially, as an inevitable but ultimately healthy feature of an economy in transition. With rising wages, an ageing society, growing financial risks, and the still looming challenge of moving from a middle-income to a high-income economy, the Chinese authorities are focused on shifting China’s growth engines without sacrificing economic or social stability. To be clear, this is not necessarily a shift towards a more market-based economy. Rather, this means correcting imbalances stemming from an overreliance on investment and credit growth in recent years, and focusing instead on boosting domestic demand, the services sector, and the higher value-added end of manufacturing (i.e. high-tech exports). While deleveraging to address risks will naturally have a downward effect on the economy, the hope is that new growth engines will kick in to put a floor under economic growth and avoid a hard landing.
If such a scenario is to be realized, it means household consumption in China will become an even more important economic driver. One facet of the Chinese economy, however, throws a serious wrench in this plan. Household debt in China is already above 50% of GDP and growing – much higher than most economies with similar GNI-per-capita ratios. To better understand the risks surrounding the expected future path of Chinese growth, this research report therefore takes a closer look at drivers of the Chinese economy, China’s debt burden with a focus on household indebtedness, and how these issues are inextricably linked with China’s real estate market.
The next stage of Chinese growth
The Chinese economy has come a long way over the past four decades. Since 1980 real annual economic growth has averaged around 9.5%. Such rapid growth, together with important economic reforms, has pulled millions out of poverty and made China the second largest individual economy in the world (and largest in purchasing power parity terms). For the most part, growth has been supported by exports and state-directed investment spending. The latter was particularly important in the years following the global financial crisis and has contributed to a substantial increase in China’s debt levels (mostly driven by non-financial corporate debt). Now however, the economy is in transition mode. Wages are rising, the population is aging, and financial risks from the growing debt burden appear to be on the horizon. Furthermore, the efficiency of new credit in terms of its contribution to GDP growth has deteriorated (Chen & Kang, 2018). As such, new growth engines need to be found, and indeed, the authorities have made clear their intention of focusing on ‘high-quality’ rather than ‘high-speed’ growth.
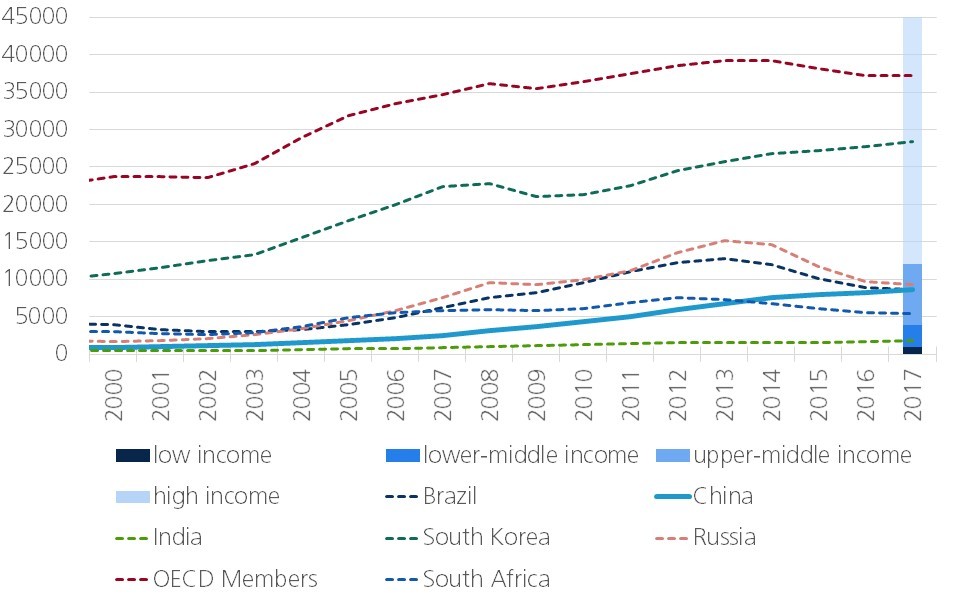
Such a transition is not easy, however. Economic commentators have even developed the term ‘middle-income trap’ to describe the (often contested) concept of countries struggling to cross the threshold from middle-income to high-income territory. As Figure 1 shows, China’s per capita Gross National Income (GNI) has been steadily increasing the past two decades, but it remains firmly in the World Bank’s middle-income classification. For China to continue expanding while relying on new economic drivers, it will require a finely-tuned balancing act from the Chinese authorities.
Figure 1 - GNI per capita & 2018-2019 classification thresholds (current prices, USD)
Consumption a weak driver at best
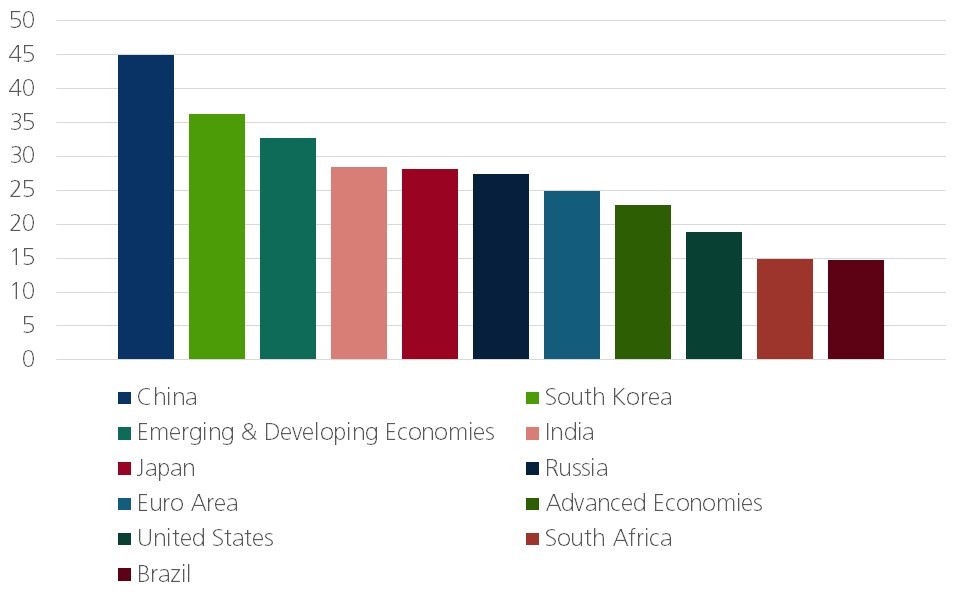
In many ways, expecting consumption to become a stronger driver of growth in China makes sense. China’s overall savings rate, at 45% of GDP, is much higher than in most countries, whether emerging or developed (Figure 2). Household savings account for roughly half of this, at 22% of GDP, or 36% of disposable income. Factors cited for the high savings rate include China’s weak social safety net, growing inequality, and demographic changes (Jain-Chandra et al., 2017). The first two issues can be addressed through policy changes to redistribute wealth more equally and build up social protections (e.g. by improving pension and healthcare provisions). Such changes, together with China’s rising income level, should help the economy rebalance further away from investment and towards consumption.
Figure 2 - Gross national savings (% of GDP, 2018 estimate)
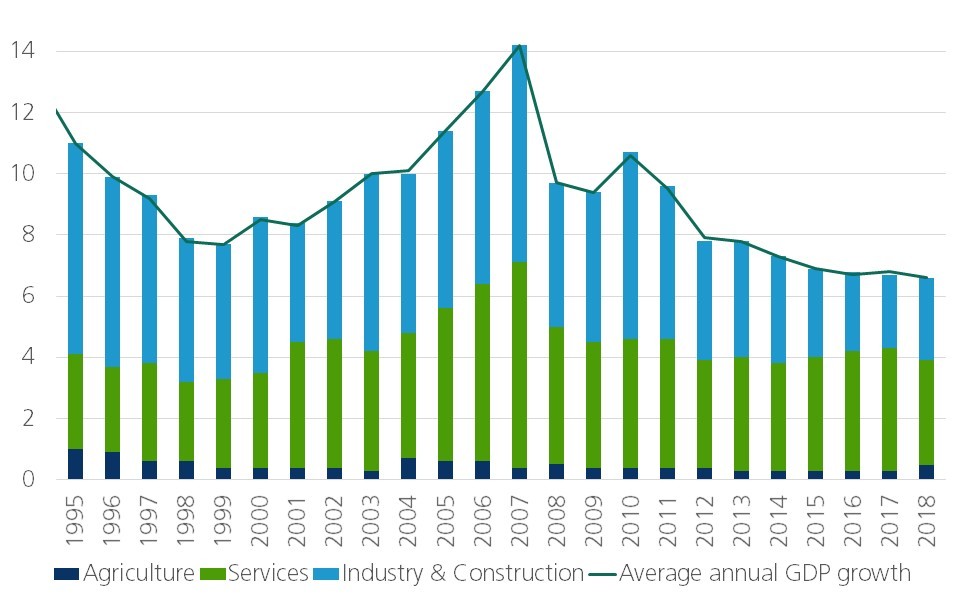
A first look at the contributions to China’s GDP growth suggest that such a transition is already underway. Investment (gross capital formation) as a share of GDP has averaged 49% since 2000, which is far higher than in many other export-focused emerging markets (e.g. since 2010 the investment share in Malaysia, the Philippines, Vietnam, Taiwan and Indonesia has averaged around 26%). In recent years the contribution of investment to China’s GDP has been on a downward trend, with consumption becoming a more prominent factor. This shift has been aided by growth in China’s services sector as well (Figures 3 and 4). Furthermore, household saving rates in China have edged down since 2010 while household consumption as a percent of both GDP and disposable income have edged up.
Figure 3 - Contribution share to real GDP growth (%)
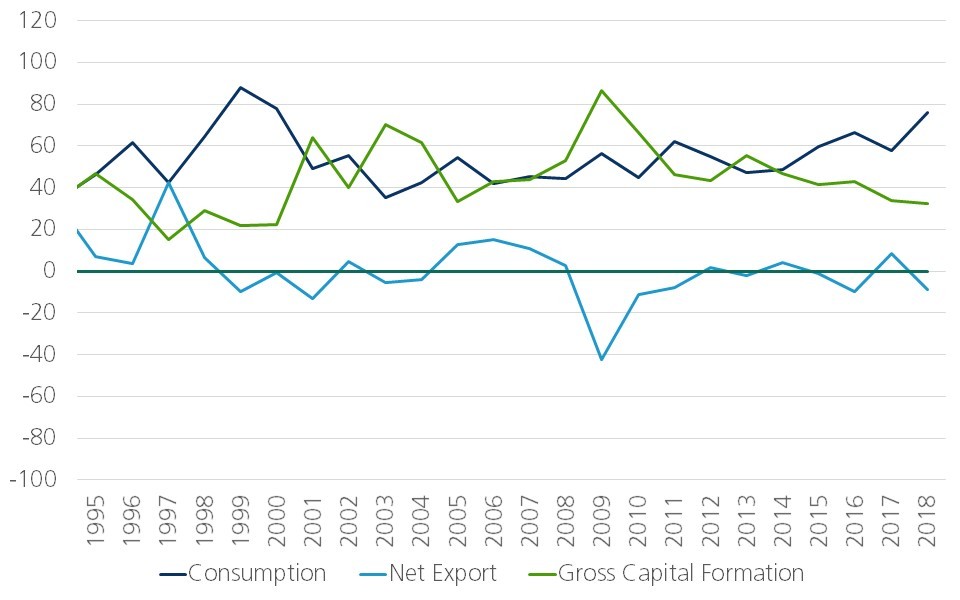
Figure 4 - Contribution share to real GDP growth (%)
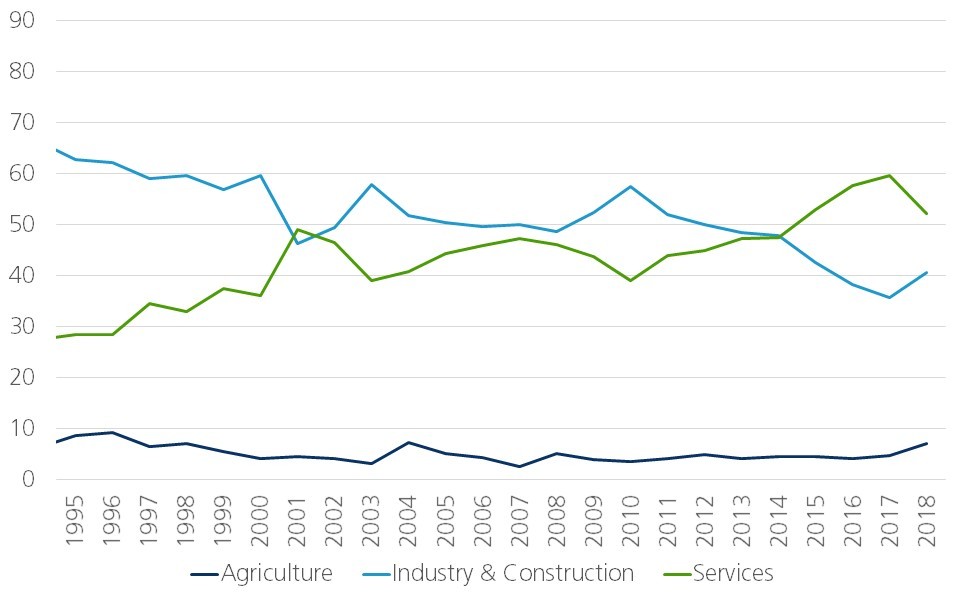
Looked at from another perspective, however, we see that consumption (and services), for the most part, has become a larger share of a decreasing whole, as the contributions from investment (and from industry and construction), and subsequently GDP growth overall, have declined (Figures 5 and 6). Thus, while to some extent the transition has begun, a clear shift away from credit-intensive investment while still maintaining substantial growth will require an even more significant increase in consumption.
Figure 5 - Contributions to real GDP growth (ppts)
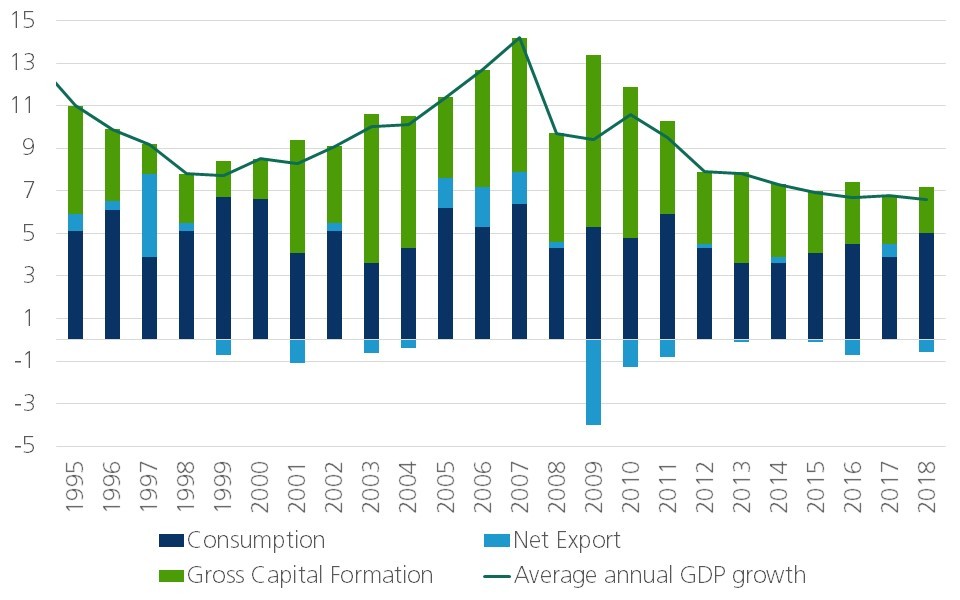
Figure 6 - Contributions to real GDP growth (ppts)
The debt-burdened elephant in the room
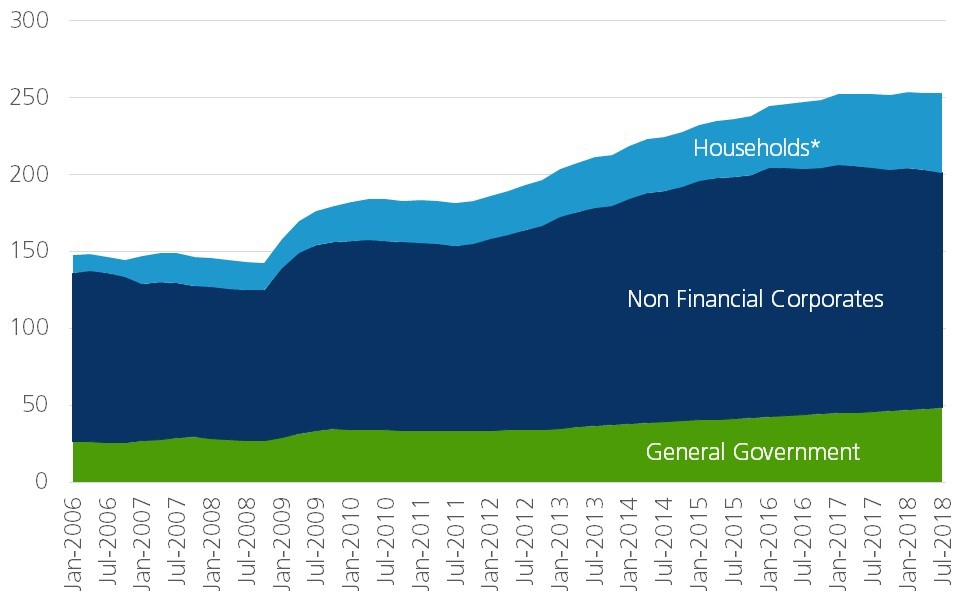
China’s debt-to-GDP ratio has exploded since the global financial crisis, with credit to the non-financial private sector (corporates and households) growing from 115% of GDP at the end of 2008 to 247% in 2018 (Figure 7). Private sector debt-to-GDP in China is now well above that of other large economies, whether emerging or advanced. This immense build-up in credit has been driven, to a large extent, by a state-directed investment push. Though government debt-to-GDP has remained relatively low over this period, the Chinese authorities have been able to direct investment through state-owned enterprises (SOEs) and local governments, which finance their investments through off-budget funding vehicles (Buysse, Essers & Vincent, 2018). SOE and local government off-balance sheet financing is classified as corporate debt in China, explaining why the bulk of the new debt over the past ten years has been driven by the corporate sector (Figure 8). Still, if we add in government debt and compare total non-financial debt-to-GDP across countries, China’s debt burden (257% of GDP) is only smaller than that of Japan (380%) and the euro area (262%) and is on par with that of the UK (256%) and the US (248%).1
Figure 7 - Credit to the non-financial private sector (% of GDP)
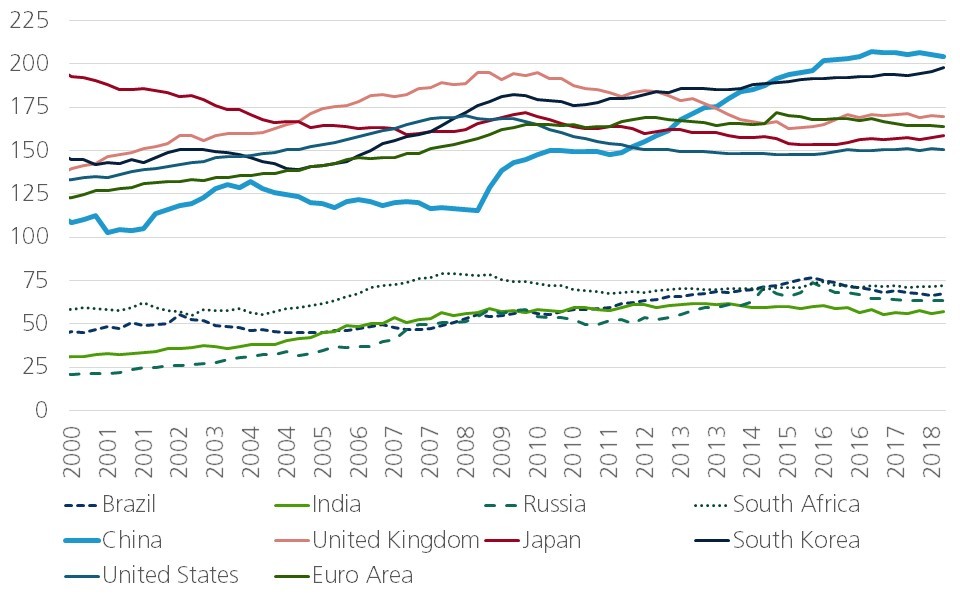
Figure 8 - Credit to the non-financial sector (% of GDP)
Household leverage is no small thing
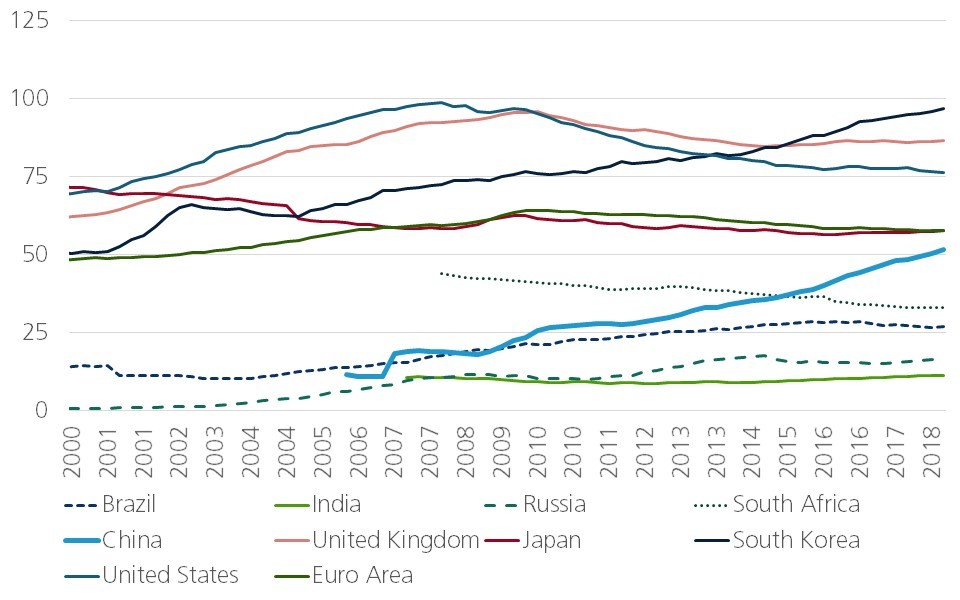
While corporate sector debt has been the main culprit of China’s increasing debt burden the past decade, China’s household debt has also risen significantly, from 18% of GDP at the end of 2008 to 52% of GDP at the end of 2018. As researchers at the New York Federal Reserve point out, more recently the household sector has even been a stronger driver of overall debt than the corporate sector (Clark and Dawson, 2019). And, while the household debt level is perhaps less shocking than that of the corporate sector, China’s household indebtedness is well above that of other large emerging markets, and more on par with economies like the euro area and Japan (Figure 9).2 This makes China’s household debt burden somewhat more concerning when one recalls that China has still some distance to go in terms of income convergence with advanced economies (recall Figure 1). Furthermore, there is research linking rapid growth in household debt with lower consumption and GDP growth in the longer run. The research finds that the negative effects on consumption and growth intensify when household debt-to-GDP surpasses 60% and 80% respectively (Lombardi et al., 2017). China is not too far off from this first threshold.
Figure 9 - Credit to households and NPISHs (% of GDP)
To some extent, China’s relatively high savings rate translates into a less worrisome picture in terms of the balance sheet of the Chinese household sector. Though data on household assets and liabilities outstanding are not readily available, some researchers have attempted to compile balance sheet statistics for the sector. Cheng Li (2017), for example, estimates the financial liabilities of Chinese households to have been about 10% of household gross assets as of 2014. This is slightly below that of the United States for example, at 13%. However, as is discussed further below, much of China’s wealth is tied up with the real estate sector, raising further concerns. According to Li’s estimations, 58% of Chinese household assets are non-financial, of which 92% is comprised of dwellings. Other estimates paint a more extreme picture, with non-financial assets accounting for 90% of household wealth, and housing assets specifically accounting for 74% (Xie & Jin, 2016). As such, the ratio of Chinese household debt to financial assets only is higher at 22% (using Li’s estimations). In an international comparison, however, this ratio is still lower than that of South Korea and Japan (both 45%), and on par with that of the US (20%) and Japan (18%).
What doesn’t add up?
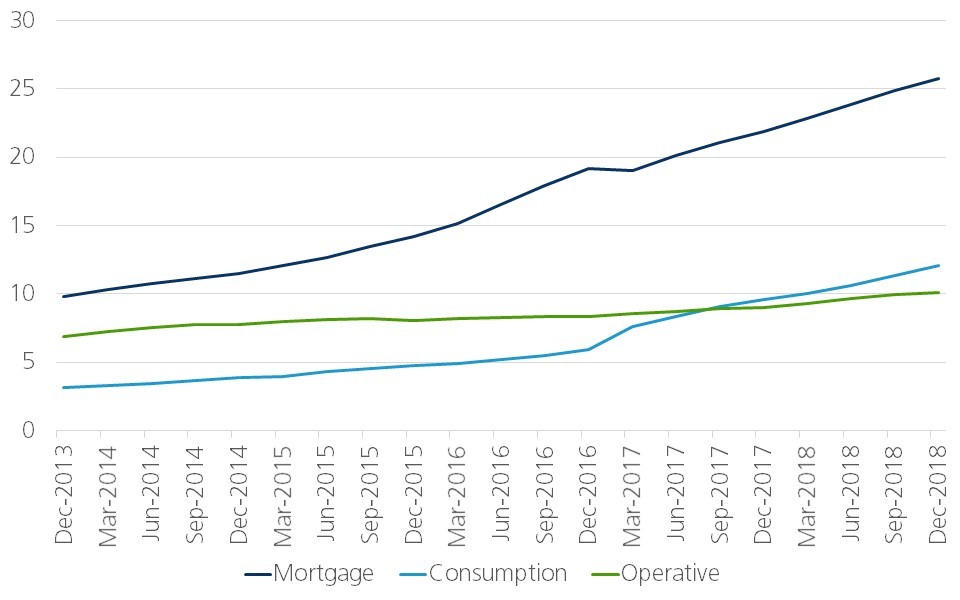
As the above-mentioned paper by Lombardi et al. and other research has suggested, in the short term at least, rising household debt is associated with stronger private consumption. This makes intuitive sense, as consumers can spend more through credit accumulation. As shown earlier, however, consumption growth in China hasn’t been particularly stellar over the same period that household debt has almost tripled. What explains this apparent contradiction? A significant portion of China’s debt accumulation has been driven by real estate. Mortgages account for 19% of China’s total private sector debt and 54% of China’s household debt, while consumption accounts for 9% and 26% respectively (Figure 10). This is not to suggest that debt from consumption has not grown over the past few years. As Figure 11 illustrates, household loans for consumption have picked up particularly since 2017. Still, they comprise a relatively small share of household debt, and given that household debt in China likely has only limited room to increase further before it starts dragging down consumption growth, the anticipation of a Chinese boom in consumer spending may end in disappointment.
Figure 10 - Chinese debt by type, end-2018 (%)
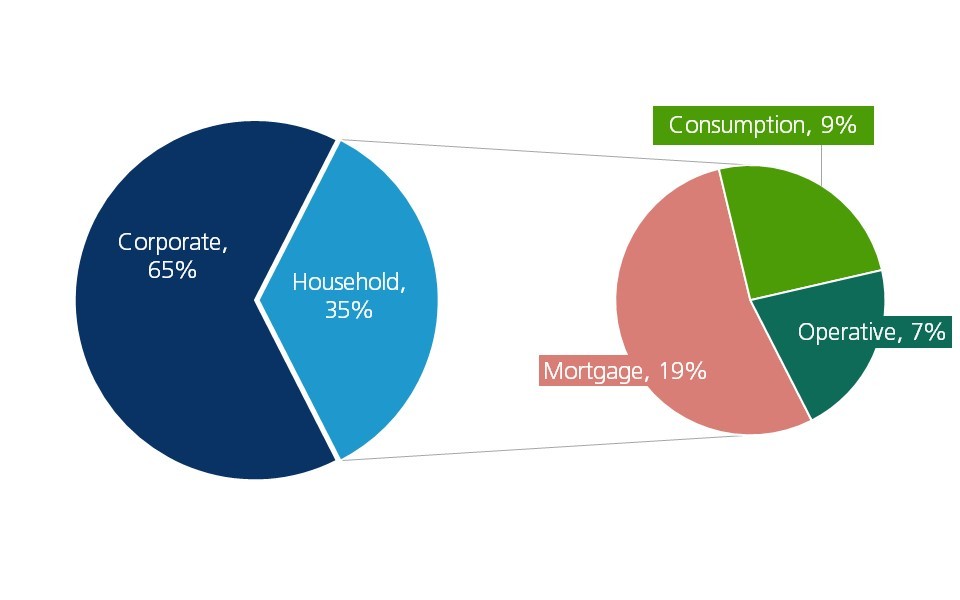
Figure 11 - Chinese household debt by type (CNY trillion)
The importance of real estate
Economists and international investors have been nervously eyeing China’s real estate market for some time. As Koss and Shi (2018) discuss, real estate became a major component of the Chinese economy between 1998 and 2008 as commodity housing (rather than welfare-oriented housing) took hold, local governments began using land sales for revenue purposes, and the residential mortgage market started to develop. Since then, real estate investment has grown from 5% of GDP in 1998 to 13% of GDP in 2017 and accounts for 30% of total investment.
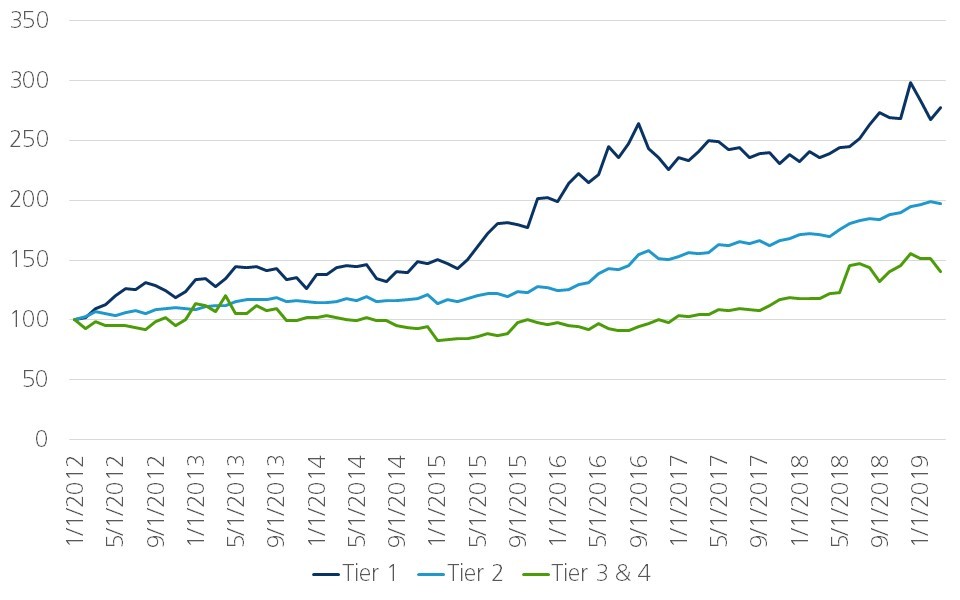
The development of the real estate sector has also contributed to rising property prices, and concerns – particularly in specific cities – that a real estate market bubble may be growing. Over the past five years especially, residential property prices in tier 1 cities (Beijing, Shanghai, Guangzhou and Shenzhen) have climbed considerably, while prices in lower tier cities have also increased, but not to the same extent (Figure 12). As the real estate market has developed, the Chinese authorities have also cycled through different phases of regulatory tightening and easing. As Koss and Shi further note, however, the government’s efforts to control prices have tended to result in a short-term decline followed by a rebound, suggesting an inability to address rising risks in the market.
Figure 12 - Residential real estate prices by city tiers (Jan 2012=100)
A collapse in the real estate market would have significant repercussions for the Chinese economy, not only because real estate development contributes substantially to GDP. As mentioned above, land sales play a crucial role in revenue generation for local governments, linking the health of the real estate sector to local governments’ fiscal capacity. Furthermore, the health of the financial sector is tied up with the real estate market as well, given that land and property have been used as collateral for about one-quarter of bank loans (Dieppe et al., 2018).
As alluded to previously, a closer look at the balance sheet of China’s household sector reveals that China’s future growth path is also tightly linked to real estate. Consumers in China are already saddled with substantial and rising mortgage debt as mentioned before. In addition, a substantial amount of household wealth in China is held in real estate assets (between 53% and 74% depending on estimates). This high concentration of household wealth in the real estate sector is a result of the country’s very high savings rate combined with limited options for investment outside of real estate. This is not to say demand for investment opportunities is the only demand factor at play in driving the real estate market. Urbanization, rising incomes and other factors likely play a role as well. Still, a collapse of the real estate market in China would have grave consequences for several aspects of the Chinese economy, including consumption growth.
Walking the line
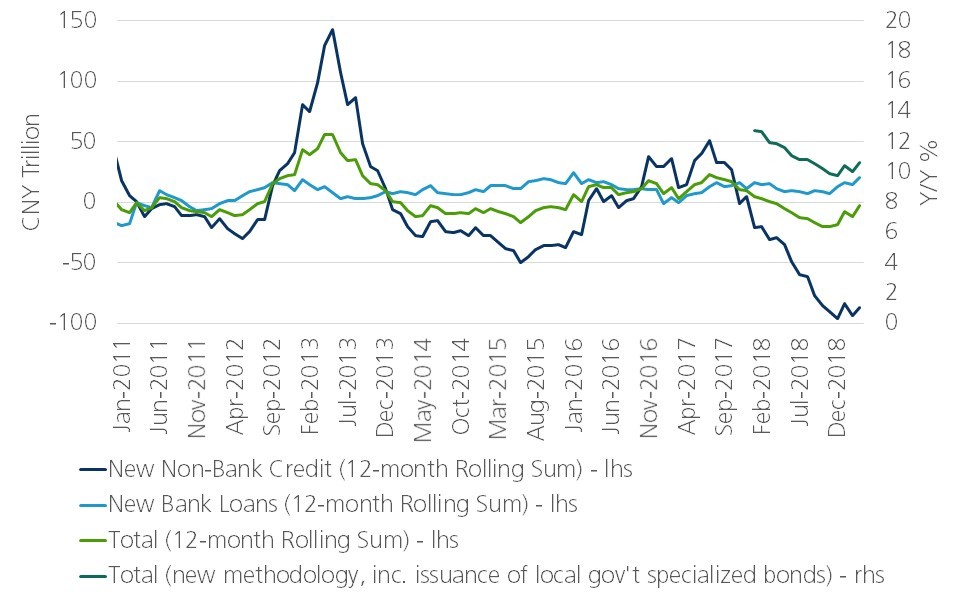
Recent developments highlight the difficult of actually changing China’s growth engines and addressing long-term concerns, such as the need for deleveraging. Chinese real GDP growth slowed notably over 2018 from 6.8% yoy in Q1 to 6.4% yoy in Q4. While the trade war with the US likely had some impact on the economy, a sharp drop in both investment growth from state-owned enterprises (SOEs) and overall credit growth also played a major role in the slowdown. Figure 13 highlights the former. Fixed asset investment (investment in construction projects and real estate development) dipped over 2018, dragged down in particular, by a steep decline in total infrastructure investment, which in turn was dragged down by a decline in infrastructure investment from SOEs. Figure 14 highlights the concurrent drop in credit growth, as measured by ‘total social financing’ (TSF). The deceleration in TSF since mid-2017, apparent in both the new and old methodology for the indicator, was driven by a sharp drop in non-bank credit while bank loans remained rather stable. What these figures reveal is that the recent slowdown in investment and credit growth was the result of the government’s efforts to pull back on leverage build-up in the economy and especially leverage stemming from the shadow banking sector. Deleveraging efforts could also have an impact beyond the corporate sector. Considering China’s rising household debt level, much of which stems from mortgage debt, tighter financial conditions, including potentially higher interest rates, could also impact Chinese households, and highly leveraged borrowers in particular.
Figure 13 - Fixed asset investment (YTD yoy %)
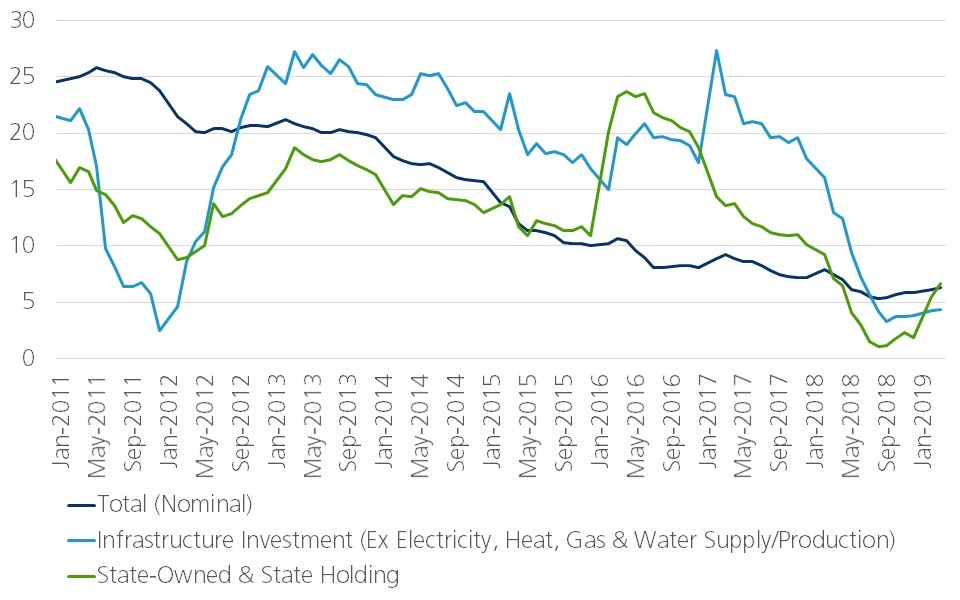
Figure 14 - Total social financing (yoy %)
At the same time, the Chinese authorities have made it clear that economic and social stability remain paramount. As such, in response to signs of slowing growth and the extra headwind of the trade war, over the course of 2018 and again at the beginning of 2019, the authorities introduced several stimulus measures on both the fiscal and monetary fronts. These measures have included cuts to the reserve requirement ratio for banks and use of medium-term lending facilities to boost lending, tax cuts for individuals and corporates, and promises to increase spending. The stimulus measures may be starting to take hold, as some recovery in credit and investment can be seen in the data, and Q1 GDP growth was steady at 6.4% yoy.
However, these measures by themselves do little to further China’s overall economic transition and may even exasperate ongoing imbalances in the long run. Indeed, the economic literature suggests that for a country to continue expanding towards higher income levels, important factors include openness to trade and FDI, a focus on technologically-intensive exports (achieved through ‘industrial upgrading’), greater income equality, and macroeconomic stability (Dieppe et al., 2018). Though there is room for improvement on many of these fronts, macroeconomic stability, in particular, requires keeping China’s debt on a sustainable path, and diversifying the drivers of growth away from an overreliance on investment.
Conclusion
The future development of the second largest economy in the world will have important repercussions for the rest of the global economy. The slowdown in China over 2018 and into the beginning of 2019 already appears to be dragging on growth in the euro area and, subsequently, economies in Central and Eastern Europe. The conventional wisdom is that the Chinese economy is in the process of an industrial upgrading and transition towards ‘high-quality’ growth. This transition will entail a focus on higher value-added tech exports, the services sector, and a greater contribution to growth from consumption. Consumption has become a larger share of GDP in recent years, suggesting the transition is underway, but the already substantial debt burden of Chinese households may hinder growth in the long-run. As such, developments and risks related to household debt and the real estate sector are crucial watchpoints for China going forward.
Footnotes
1. According to the BIS, these statistics comprise financing from “all sources, including domestic banks, other domestic financial corporations, non-financial corporations and non-residents,” suggesting credit from the shadow banking sector is included.
2. Household debt-to-GDP in Malaysia and Thailand is higher than that of China, but in both economies, the household debt ratio has been declining since 2008.
References:
Buysse, K., D. Essers, and E. Vincent. 2018. “Can China avoid the middle-income trap?” National Bank of Belgium Economic Review, June 2018.
Chen, Sally and Joong Shik Kang. 2018. “Credit Booms—Is China Different?” IMF Working Papers 18/2.
Clark, Hunter and Jeff Dawson. “Could Rising Household Debt Undercut China’s Economy?” Liberty Street Economics blog post, Federal Reserve Bank of New York, 13 February 2019. https://libertystreeteconomics.newyorkfed.org/2019/02/could-rising-household-debt-undercut-chinas-economy.html.
Dieppe et al. 2018. “The transition of China to sustainable growth – implications for the global economy and the euro area.” ECB Occasional Paper Series No 206.
Jain-Chandra et al. 2017. “People’s Republic of China – Selected Issues.” IMF Country Report No. 17/248.
Koss, Richard and Xinrui Shi. 2018. “Stabilizing China’s Housing Market.” IMF Working Paper 18/89.
Li, Cheng. 2017. “China’s Household Balance Sheet: Accounting Issues, Wealth Accumulation, and Risk Diagnosis.” Munich Personal RePEc Archive No 79838.
Lombardi, Marco, Madhusudan Mohanty, and Ilhyock Shim. 2017. “The real effects of household debt in the short and long run.” BIS Working Papers No 607.
Xie, Yu and Yongai Jin. 2015. “Household Wealth in China.” Chinese Sociological Review, vol. 47, no. 3, pp. 203-229, doi: 10.1080/21620555.2015.1032158.