

Economic Perspectives October 2026
Read the full publication below or click here to open the PDF.
- With no end in sight to the Middle East conflict, energy prices have continued to rise. This is particularly the case for natural gas prices, which rose from 70 EUR per MWh at the end of August to 88 EUR per MWh (as of 19 October), due also to cold weather and low EU reserves. Oil prices increased from 90 USD per barrel end of August to 109 USD per barrel (as of 19 October). On top of the rise in crude oil prices, strains are increasing in the oil supply chain, as tanker freight rates have skyrocketed.
- Euro area inflation rose from 3.2% to 3.8% in September. Higher energy prices were again the prime culprit. Core inflation increased from 2.4% to 2.5%. The rise was due to an important acceleration in services inflation (partly due to seasonal effects). Meanwhile, core goods inflation decelerated. Given the stronger-than-expected inflation figures and rise in energy prices, we upgrade our inflation forecast from 3.0% to 3.1% for 2026 and from 2.1% to 2.3% for 2027.
- US inflation accelerated in September from 3.4% to 3.7%. The increase was largely driven by energy prices. However, core inflation was also firm as it increased from 2.5% to 2.6%. Both core goods and core services inflation accelerated. The former was driven by a.o. higher vehicle and technology prices. The latter was driven by a.o. higher shelter and public transportation prices. Given the firm inflation print and higher oil prices, we upgrade our inflation forecast from 3.4% to 3.5% for 2026 and from 2.6% to 2.8% for 2027.
- The euro area economy again showed resilience at the end of the third quarter as business confidence indicators remain at an elevated level (except for the construction sector). Headwinds are mounting however as energy prices continue to rise and financial conditions are tightening. Furthermore, political risks are mounting. We thus maintain our 0.9% 2026 GDP forecast but downgrade our 2027 GDP forecast from 0.9% to 0.8%.
- US GDP continues to expand at a solid pace. Q2 GDP growth was revised upwards thanks to a higher investment and consumption contribution. Q3 GDP growth will also be solid as consumption and non-residential investments hold up while inventories are rebounding. Confidence indicators continue to point to solid growth in the quarters ahead. We upgrade both our 2026 and 2027 GDP forecasts by 0.1 percentage points to 2.2% and 2.1% respectively.
- The combination of solid economic growth, tight labour market and above-target inflation is likely to press central banks to continue raising policy rates. We expect both the Fed and ECB to hike their policy rates in December and expect another ECB rate hike in Q1 2027. Higher energy prices, AI spending and sovereign debt concerns have pushed up 10Y yields worldwide. Spreads within the euro area are also widening as political concerns have mounted.
- The Chinese economy continues its unbalanced but ultimately on-target growth performance. GDP grew 4.5% year-on-year in Q3, which was slightly higher than forecast (4.4%) and leads to an upgrade of the 2026 and 2027 average GDP outlooks to 4.6% and 4.3%, respectively. Underlying growth dynamics, however, show that stark imbalances remain, with strength in exports making up for lagging domestic demand.
Energy prices keep rising
The war in the Middle East keeps dominating energy markets. While the US continues to block Iranian energy exports, Iran is launching attacks against tankers attempting to transit the Strait of Hormuz. The Houthi-Saudi conflict is also escalating, as the Houthis have launched strikes on multiple Saudi targets (including the Riyadh international airport). As there is no end in sight to the current conflict, oil prices are again increasing. As of 19 October, they reached 109 USD per barrel, up from 90 USD per barrel end of August.
Despite the continuation of the conflict, Gulf exports are gradually recovering, thanks to increased ship-to-ship transfers in the Gulf of Oman and the return of East-West pipeline flows in Saudi Arabia. Gulf exports reached 13.9 million barrels per day in September, 4.4 million barrels per day more than in August.
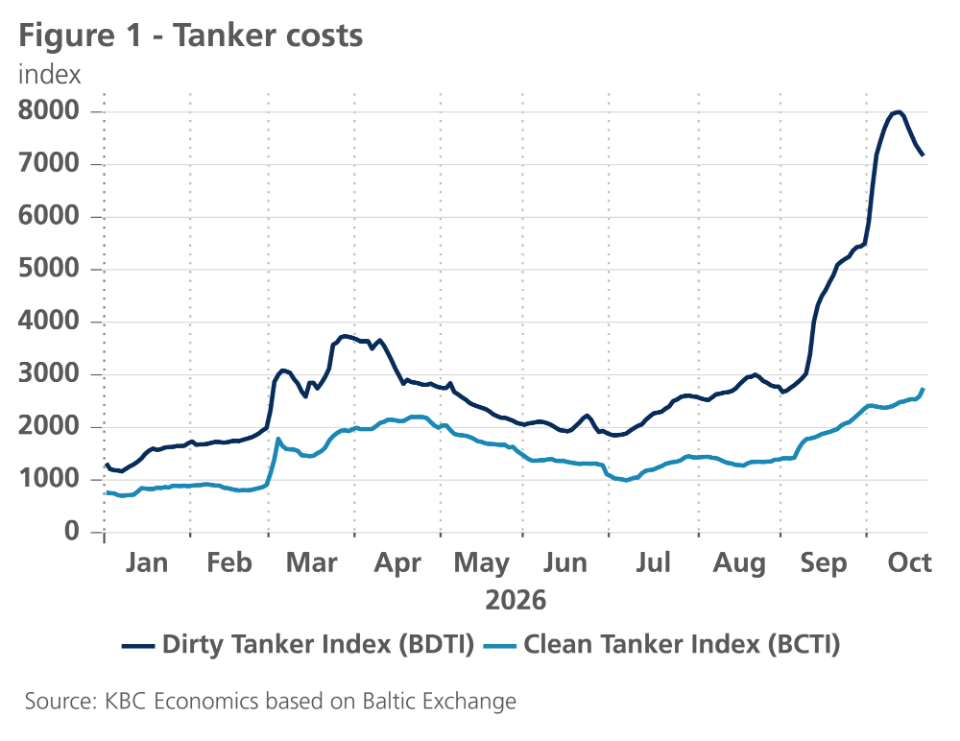
Transporting oil out of the Middle East has become costlier, however. Due to higher insurance premia, longer shipping routes and the need for ship-to-ship transfers, tanker freight rates have surged (see figure 1). The cost of transporting crude oil in particular has increased around sixfold since the start of the year (as indicated by the Baltic Dirty Tanker Index). The price of transporting refined products (as indicated by the Baltic Clean Tanker Index) increased twofold.
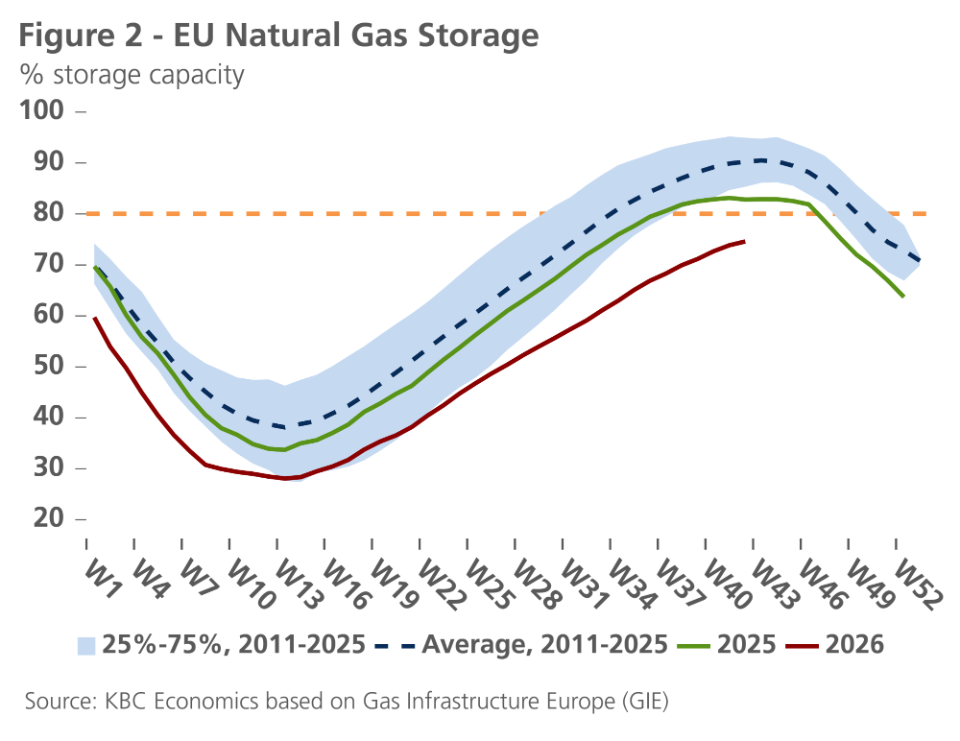
The prolonged conflict is also causing strains in natural gas markets as around 20% of global LNG supply flowed through the Strait prior to the conflict. European natural gas prices rose from 70 EUR per MWh at the end of August to 88 EUR per MWh (as of 19 October). A cold weather spell (especially in Central Europe), along with lower wind speeds also contributed to recent price increases. Worryingly, Europe enters the winter season with record low reserves.
Energy continues to dominate euro area inflation
Energy price inflation was again the main driver behind the upward movement in headline inflation in the euro area in September (to 3.8%). Prices of unprocessed food and services also rose at the end of the third quarter. For services inflation, there is a good chance that volatile seasonal factors have played a role in the increase, making a correction in October likely.
September will not be the last month in which inflation increases. The strong increase in energy prices in October will push up inflation further. The fact that price pressure components increased in all business confidence indicator surveys provides additional support for this scenario. As mentioned above, for the time being, there are few reasons to believe that energy prices will decline in the months to come, as conflicts in the Middle East and Ukraine continue, and gas supplies in Europe are low (see figure 2). The latter is causing nervousness in energy markets, which is reflected in strong volatility in gas price futures.
Based on the recent rise in energy prices, we are raising our inflation forecast for 2026 by 0.1 percentage points to 3.1% and for 2027 by 0.2 percentage points to 2.3%.
US inflation on the rise
US inflation increased from 3.4% to 3.7% year-on-year in September. On a monthly basis, CPI inflation increased by 0.6%. The increase was mostly driven by a 5.2% month-on-month jump in energy prices. Food prices, in contrast, remained unchanged.
Core inflation was also firm, however. It accelerated from 2.5% to 2.6% year-on-year in September. On a monthly basis, core inflation increased by 0.25%. The increase was broad-based. Core goods prices increased by 0.3% month-on-month. Notable in this category was the 0.7% increase in prices of used cars and trucks. Forward-looking indicators were pointing to moderation in this major category. The AI-linked boom in memory chip prices is also pushing up information technology commodity prices, which rose by 0.9% last month. In contrast, pharmaceuticals have pushed down inflation in the latest months, thanks to the ongoing Medicare Drug Price Negotiation Program, lower GLP-1 prices and new generic drugs coming to the market.
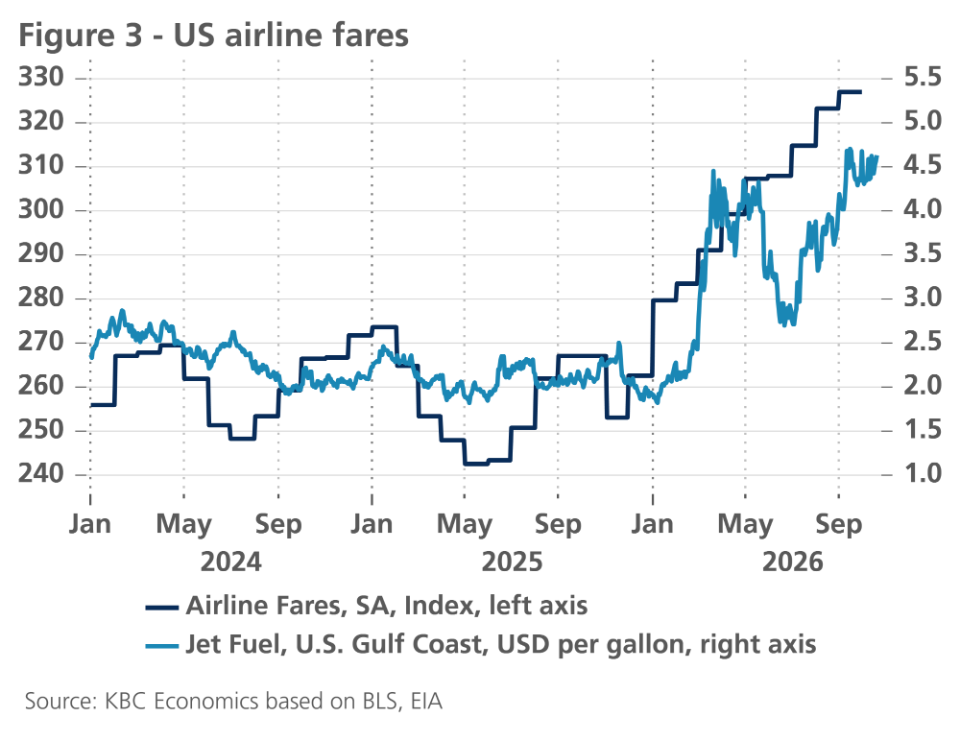
Core service prices also rose by a strong 0.4% month-on-month. Shelter prices accelerated due to another jump in hotel prices. Owner-equivalent rent was also firm (0.35% month-on-month). Given moderating house price inflation and tepid new market-rent inflation, we still expect this acceleration in shelter inflation to be short-lived. Other services categories also saw important price increases. There was another jump in airline fares (see figure 3). This was driven by higher jet fuel prices and the bankruptcy of Spirit Airlines.
Looking ahead, high producer price and import price inflation and the continued rise in oil prices point to firmness in future inflation prints. There is limited evidence of second-round effects of higher oil prices, however, as wage inflation remains subdued. All in all, we upgrade our inflation forecast from 3.4% to 3.5% for 2026 and from 2.6% to 2.8% for 2027.
Euro area companies remain confident, consumers hesitate
The PMI indicator, which gauges the confidence of European companies in the economy, rose again in September and even reached its highest level in more than three years at 53.10 for the euro area. The improvement was particularly pronounced in the services sector, but there was also a slight increase in the manufacturing industry. In both sectors, IT-related investments were pointed to as an important factor boosting growth. In the manufacturing industry, economic activity was further supported by defence spending. Both services and the manufacturing industry PMIs were comfortably above the 50 mark in September, indicating an expansion in economic activity. As in previous months, optimism in the manufacturing and services sectors was not shared by construction companies. The business confidence indicator in this sector increased slightly in September but remained deep in contractionary territory. Residential house construction, in particular, again declined sharply. In Germany, the IFO business climate indicator continued to climb upward in September to its highest level since May 2023. At the end of the third quarter, German companies became more optimistic about the current economic situation and in their expectations for the next 6 months.
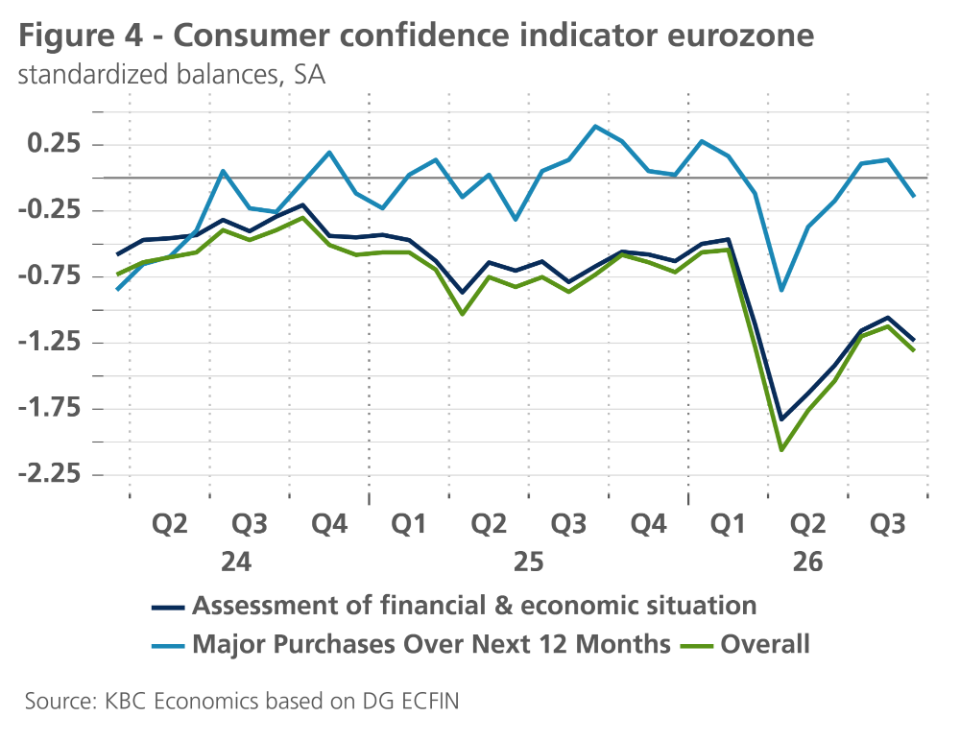
The predominantly positive sentiment among companies is offset by a cautious consumer. Consumer confidence declined in September after a limited rebound in the previous months and the indicator remains at a low level (see figure 4). Both the current economic context and future prospects are of concern to consumers in the euro area, and this weighs on their willingness to make large purchases. Compared to August, the employment prospects of consumers and businesses remained fairly stable, which indicates resilience in the labour market.
Many of the renewed headwinds that the eurozone has had to deal with in the past month took place after the surveys of businesses and consumers. The new increase in energy prices, the political unrest and protests in Spain and France and the sharp increase in government bond yields have therefore not yet been fully factored into these figures. In addition, some activity data, including German manufacturing orders and exports and industrial production in the euro area, disappointed in August. We are therefore sticking to our growth forecast of 0.9% for 2026 for the time being. For 2027, we reduce growth in the eurozone by 0.1 percentage points to 0.8%, mainly due to the energy shock and the increase in government bond yields. The latter will put upward pressure on government spending in euro area countries and force governments to take more austerity measures, which will come at the expense of economic growth. Especially in France, where the rise in interest rates relative to German interest rates is most pronounced, this makes the fiscal consolidation exercise for 2027 more difficult. The violent street protests of the past few weeks also show that the willingness of the population to accept austerity measures is limited. If and how the government should tighten the budgetary reins in the coming years is therefore an important theme in the run-up to the presidential election in April-May. Higher borrowing costs will not only complicate fiscal exercises but will also curb business and consumer investment and encourage savings, which will weigh on growth.
US economy in great shape
The US economy remains in solid shape. Q2 GDP growth was revised upwards from 1.5% to 2.2% quarter-on-quarter annualized. The upward revision was largely caused by stronger consumption and fixed investments. Both components now respectively contributed 2.51 and 1.35 percentage points to Q2 GDP growth. Inventories and net exports dragged down growth.
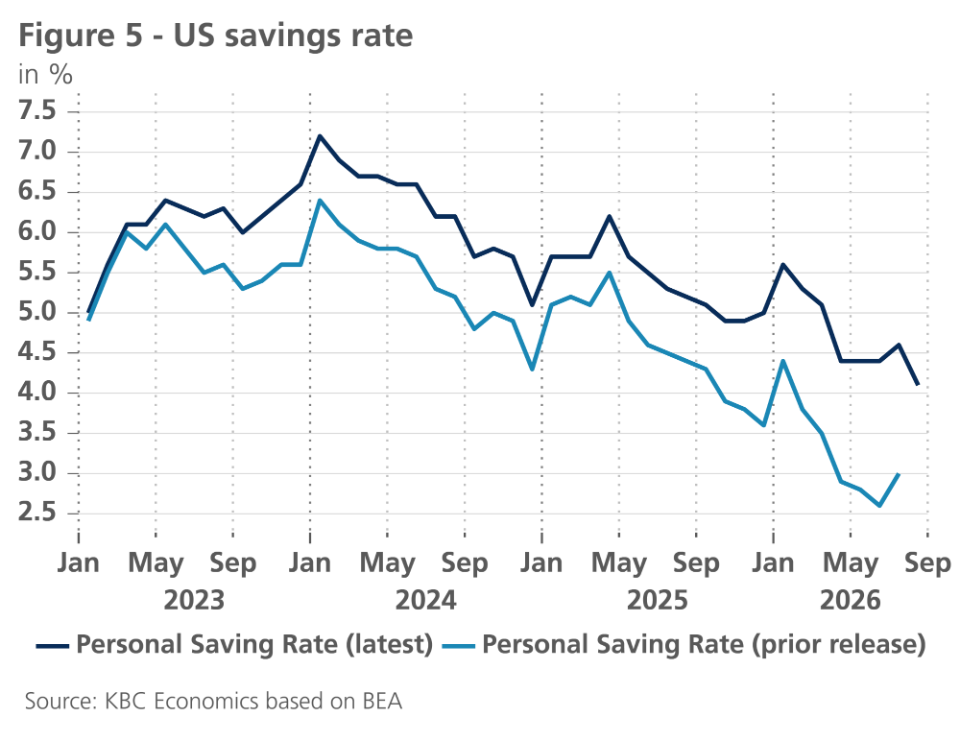
Consumption will also make a strong contribution in the third quarter. Real personal consumption expenditures increased by 0.6% in August. Consumption is set to remain strong in September as retail sales rose 0.8% month-on-month. In its latest release, the Bureau of Economic Analysis also significantly revised real disposable income upwards. Consequently, there was a major upwards revision of the savings rate (see figure 5). Though the savings rate is still on a downward trajectory, the risk of a sudden consumer spending slowdown is now meaningfully lower.
Non-residential investments are also expected to contribute strongly to Q3 GDP as indicated by a big increase in August construction spending and the continued rise in tech capital goods imports. Like last quarter, net exports will likely contribute negatively in Q3 as the trade deficit widened in both July and August. However, this will likely be compensated this time by a strong inventory contribution.
Business sentiment indicators also point to continued resilience of the US economy. The rise in the S&P Global composite PMI indicator is especially notable as it rose from a low of 50.3 in March to 58.4 in September.
The latest labour market data were softer, however. Only 29k jobs were added in September, and the prior two months were revised downwards by 60k in total. Though this was lower than expected, the data are not too concerning. At 51k, the three-month moving average remains broadly in line with the breakeven employment growth rate. This is confirmed by the unemployment rate, which increased only marginally from 4.14% to 4.17%.
All in all, we haven’t made any changes to our quarterly GDP forecasts. Given the upward revision in the H1 GDP figures, we upgrade our 2026 forecast from 2.1% to 2.2%. Overhang effects push up our 2027 forecast from 2% to 2.1%. Major risks remain and include a slowdown in the AI build-out, slower productivity growth, a resumption of the trade war and a more severe energy shock.
China’s unbalanced growth continues
The Chinese economy continues its unbalanced but ultimately on-target growth performance, with Q3 GDP growth of 4.5% year-on-year (or 1.2% quarter-on-quarter). While this represents an acceleration from the previous quarter and is stronger than our forecast (4.4% year-on-year), the details paint a more concerning picture, as imbalances between a strong export sector and a weak domestic sector remain stark. In Q3, industrial production grew 5.1% year-on-year while retail trade grew only 0.7% year-on-year. China’s industrial output is increasingly destined for markets abroad, with China’s September exports up 29.6% compared to a year earlier. Trade partners are growing increasingly discontented with China’s increasing market share and the resulting threat to domestic industries. Indicative of this is the agreement between China and the EU earlier this month, which will limit EU imports of Chinese hybrid electric vehicles in the next years via quotas. While the agreement is a temporary stopgap that addresses the symptoms of the EU’s lagging competitiveness vis-à-vis China rather than the cause, it signals that China’s increasing reliance on the export leg of its economy comes with important risks. Meanwhile, the factors holding back domestic demand continue, with the housing market still in correction mode, the labour market showing persistent signs of slack, and consumer confidence still very weak. Also notable is the ongoing weakness in investment, which contracted -7.2% from the start of the year through September compared to the same period last year.
We therefore expect steady GDP growth in the fourth quarter of 2026 (1.2% quarter-on-quarter), followed by a continued but mild structural slowdown in the quarters ahead. Given the slightly higher-than-expected Q3 GDP figure, this leads to a modest upgrade of our 2026 average GDP figure from 4.5% to 4.6% and our 2027 average GDP figure from 4.2% to 4.3%. The inflation outlook remains unchanged at an under-target 1.1% annual average rate in both 2026 and 2027.
ECB and Fed in tightening mode
Both the ECB and the Fed raised their policy rates by 25 basis points to 2.50% and 3.875%, respectively, in September. This was in line with our expectations and those of the market.
Against the backdrop of persistently high inflation, mainly fuelled by higher energy prices compared to last month, we reaffirm our policy expectations for both central banks. The ECB is likely to raise its policy rate again to 2.75% in December 2026, and then raise its policy rate to 3% in March. On both dates, the ECB can base its decision on new forecasts from the ECB economists. We also expect the Fed to raise its policy rate by 25 basis points to 4.125% in December, reaching the expected peak of its interest rate cycle. That Fed scenario is consistent with the most recent median scenario of the September dot plots, in which the Fed governors (with the exception of Chair Warsh) reflect their personal expectation for key macrofinancial variables.
The risks surrounding this monetary interest rate scenario are one-sidedly tilted upwards, given the high geopolitical uncertainty and its impact on energy prices, both in terms of magnitude and persistence. These risks are also reflected in market expectations for future policy rates for the Fed and the ECB. These market expectations assume a higher interest rate peak than the KBC scenario. One of the reasons why we assume that the Fed and the ECB will take a more moderate approach is the fact that the financial conditions have already recently become more restrictive due to rising long-term interest rates. This is largely due to the state of the US government budget and the AI-related financing burden on the supply of global savings. From a European perspective, this tightening is to a large extent an external factor, which does some of the tightening work for the ECB.
A second factor is that, unlike the ECB itself, we assume that annual average core inflation in the eurozone will return to the 2% target as early as 2028 (because we expect fewer second-round effects). Taken together, both factors are likely to mean that the ECB can stick to two additional rate hikes in this interest rate cycle.
The ECB policy decision in September was consistent with her reaction function, to which ECB President Lagarde and chief economist Lane regularly refer. First, headline inflation in the ECB's September scenario will be above the 2% inflation target on average in 2027 and 2028. In addition, underlying core inflation dynamics remain stubbornly high. Remarkably, this is not only the case in the ECB baseline scenario, but also in all alternative scenarios, including a milder scenario. These two elements made the 25 basis point rate hike in September an obvious choice. In fact, since the ECB economists calculated the scenarios on the basis of the market expectation for the yield curves, which already took into account (at least) two additional rate hikes, the ECB scenarios support our expectation of additional tightening in December and March.
The third element in the ECB's reaction function, the strength of the transmission mechanism of its policy to the real euro area economy, only became relevant after the ECB policy meeting with the recent sharp increase in intra-EMU interest rate differentials between government bonds. Indeed, the homogeneity of the eurozone-wide transmission mechanism is disrupted by the uneven increase in these interest rate differentials, which in turn have an impact on national budgets and thus on fiscal policy room.
ECB steadily reduces balance sheet, in contrast to the Fed
In the background of their interest rate decisions, the ECB and the Fed continue their balance sheet policies. This has an impact on the amount of liquidity in the financial system and it also affects yields on government bonds.
At the moment, the ECB's quantitative policy is on autopilot. Bonds from its APP (Asset Purchase Programme) and PEPP (Pandemic Emergency Purchase Programme) portfolios are not reinvested at maturity. As a result, they are gradually withdrawing liquidity from the market, which was first injected into it during quantitative easing. According to the latest review of the policy strategy, the ECB intends to fully reduce both policy portfolios in the passive manner mentioned. This process is therefore completely predictable for the market.
The widening intra-EMU interest rate spreads now raise the question of how the ECB will respond. Indeed, spreads are not in sync for all countries, with the strongest impact currently on France and highly correlated countries such as Belgium. Through the fiscal channel, the transmission of ECB policy to the real economy and inflation is fragmented. Moreover, there is the increased risk that concerns about the sustainability of public debt will trigger a self-reinforcing market dynamic of rising interest rates that could ultimately pose an existential risk to financial stability in the euro area.
The question then is how the ECB will react in this context. In theory, the ECB has several options at its disposal: communication, a suspension of the run-down of the APP and/or PEPP portfolio, the activation of the Transmission Protection Instrument (TPI) or the Outright Monetary Transactions (OMT).
A plausible scenario seems that the ECB will initially try to stabilize the markets through communication. In 2022, ECB Executive Board member Schnabel did this in the context of the increased Italian spread. At the time, she mentioned a spread level of 250 basis points that the ECB would consider unwarranted on the basis of economic fundamentals, and which would therefore trigger an ECB reaction. The fact that the current Italian spread of around 110 basis points is less than half that pain threshold is also an indication that such communication is unlikely to be made in the very near future. On the other hand, it is of course not Italy but France that is currently in the spotlight of the financial markets.
If such communication would not be sufficient, the activation of the TPI as a next step seems more appropriate than the suspension of the wind-down of the APP and PEPP portfolios. After all, the TPI was created precisely for this purpose and could theoretically be applied without restriction and flexibly to the specific national market that comes under unreasonable market pressure. Moreover, a suspension of the wind-down of the APP and/or PEPP portfolios would create uncertainty in financial markets about the credibility of the ECB's strategic policy framework. Indeed, a temporary suspension could become permanent, with unclear implications for the final target size of the ECB's balance sheet. Moreover, the relatively limited size of the monthly reinvestments would probably not be sufficient to carry out sufficiently credible interventions. The theoretically unlimited and flexible possibilities of the TPI therefore seem more suitable.
However, the possibility of an intervention by the ECB already could create a moral hazard problem for the fiscal authorities concerned, even if the TPI is conditional. The danger of so-called 'fiscal dominance' is lurking: central bank policy is in danger of being held hostage by the sustainability of public finances. The fiscal government is aware of this, and it could lead to less budgetary discipline, counting on the central bank to intervene when push comes to shove. The remark of French presidential candidate Mélenchon that the French central bank should delete the French government bonds from its balance sheet is a warning sign.
The Fed, in contrast to the ECB, ended its policy of partial reinvestments of its policy portfolio in December 2025, stating at the time that it believed liquidity in the financial system had declined sufficiently from "abundant” to "ample." However, fearing from the outset that liquidity had declined too much to ensure the smooth functioning of the market, the Fed immediately launched a new programme of so-called 'reserve management' purchases in the same month. In doing so, it buys short-term Treasury bills every month to provide the market with sufficient liquidity. In one move, the Fed thus transitioned from quantitative tightening to quantitative easing. Since August 2026, the monthly amount of those purchases has been temporarily set to zero until mid-November, because the Fed currently considers the amount of liquidity in the market to be sufficiently “ample”.
That pause is consistent with new Fed Chair Warsh's critical stance on a large Fed balance sheet as a result of previous quantitative easing. It is no coincidence that one of the task forces he set up after taking office is looking at the size and composition of the Fed's balance sheet, and on the other side of the coin, the merits of the current policy goal of 'ample' reserves. The results of the task force and their discussion in the Fed's policy committee will provide more clarity on the Fed's future balance sheet policy, which is likely to be more restrictive.
Bond yields rise, with divergence between the US and Germany
German and US bond yields have risen in recent weeks. This was true in both nominal and real (inflation-adjusted) terms. It was mainly an American, and only to a lesser extent a European phenomenon. After all, the rise in interest rates was mainly due to the US government's large financing need and the burden of financing investments in artificial intelligence (AI) on the available supply of macroeconomic savings. The latter factor also plays a greater role in the US than in Europe.
At the moment, there is concern in financial markets about the financing of (American) investments in AI. This led to greater risk aversion in bond markets. As a result of this 'flight to safety', the ten-year benchmark bond yields fell somewhat. However, they are likely to remain relatively elevated and volatile for some time.
For both the US and German yield curves, our scenario implies a flattening of the yield curve, driven by the short end of the curves due to the expected rise in policy rates. This is clearly reflected in the steepness of the current market curves up to the two-year maturity, which is strongly influenced by the expected monetary policy. For maturities longer than two years, we do not expect further curve steepening. This reflects the expectation that long-term interest rates are currently near their expected high.
Significantly higher intra-EMU spreads
As a result of the political and fiscal risks in Europe, such as the unrest and the run-up to the presidential elections in France, parliamentary elections in November in Spain, increasing political paralysis in Germany and the difficult budget talks in Belgium, among others, most intra-EMU interest rate differentials of government bonds have widened sharply in recent weeks. This was a general trend, but France and highly correlated markets such as Belgium were particularly affected.
The widening interest rate spread was not only driven by higher absolute interest rates in the affected countries, but also by the recent decline in the German benchmark interest rate. This flight to safety has also been visible in ten-year US government bonds in recent days.
We assume that the jump in interest rate differentials will not be fully reversed soon, without, however, necessarily leading to a new European debt crisis. Spreads may rise further from their current levels to a limited extent and peak in the spring of 2027. After the French presidential election, spreads are likely to stabilise and gradually decline back to near their current levels towards the end of 2027.
Weaker euro
Due to the deteriorating risk sentiment towards Europe and the widening long-term interest rate differentials to the detriment of Europe, the euro weakened against the US dollar to 1.12 USD per EUR. Since the causes of this are likely to persist for some time, the euro's weakness will also be persistent. The euro is likely to reach a bottom in the first quarter of 2027 ahead of the French presidential election. After that, the euro may stabilise and recover very gradually against the dollar. That recovery will mainly be based on the fundamental overvaluation of the dollar.
All historical prices, statistics and charts are up to date as at 20 October 2026, unless otherwise stated. The positions and forecasts provided are those as at 20 October 2026.