Economic Perspectives for Belgium
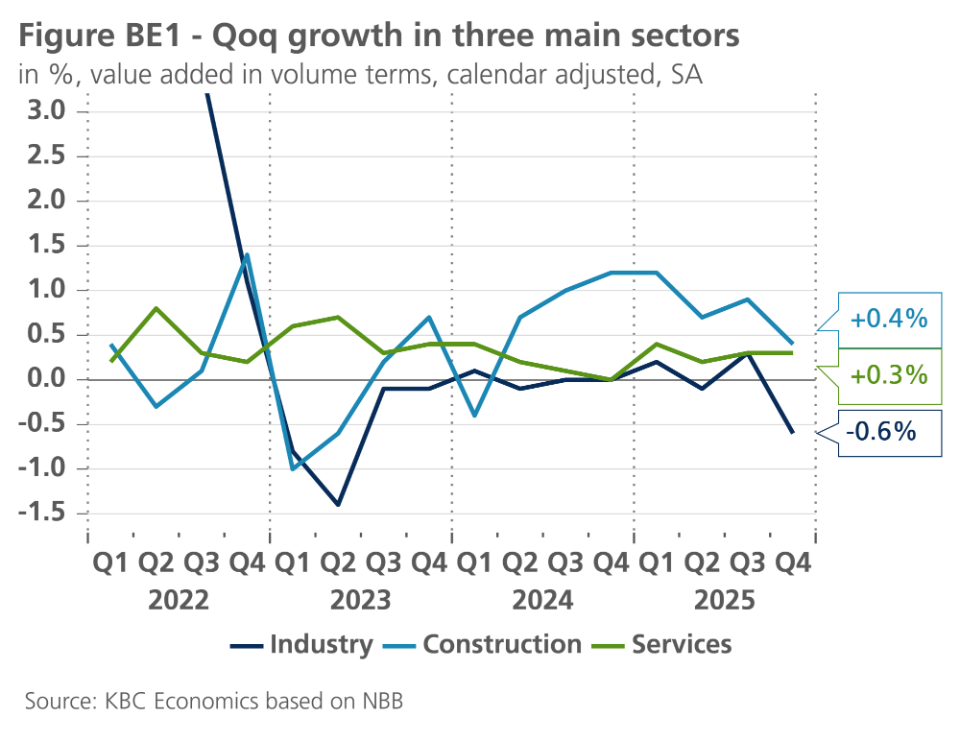
The flash estimate of Belgian growth in the final quarter of 2025 came out at 0.2% qoq. The figure was a bit lower than what we had expected and signalled a slight deceleration from the 0.3% growth recorded on average in the previous three quarters. Q4 growth was below the euro area figure (+0.3%) and driven by activity in services (+0.3%) and construction (+0.4%), while industry recorded negative growth (-0.6%) (see figure BE1). For the full year 2025, real GDP growth slowed to 1.0%, from 1.1% in 2024. The Q4 component breakdown has not yet been published, but details for the first three quarters already indicate that 2025 growth was underpinned by final domestic demand (private consumption in particular) and inventory change, while net exports were a drag. After having realised three years of stronger growth in a row, Belgium no longer outperformed the euro area in 2025, where annual growth was at 1.5%. Looked at from a longer perspective, economic activity in Belgium in Q4 2025 was 8.5% higher than its pre-pandemic level (Q4 2019), as against 7.3% higher in the euro area.

Regional economic growth
2025 was another difficult year for Belgian industry. After having contracted by 1.0% in 2024, value added in the sector grew by a meagre 0.2% in real terms in 2025, while that in construction and services grew by 3.8% and 0.9%, respectively. Regional growth figures lag behind the publication of the national GDP figures, meaning that it is unclear for now to what extent economic activity grew differently in the three Belgian regions in 2025. Flanders having a relatively bigger manufacturing sector and a more open economy than Wallonia and Brussels, the region likely was affected more by the sluggish industry and still strained external environment.
In 2024, for which regional growth data have recently been published by the National Accounts Institute (NAI), growth in Flanders was already significantly affected by a weak industry. Flanders recorded general economic growth of only 0.7% that year, compared to 1.2% and 1.4% in Wallonia and Brussels, respectively. A year earlier, in 2023, growth in three regions was at 1.9% (Flanders), 1.8% (Wallonia) and 1.4% (Brussels). Hence, Flanders saw the most pronounced slowdown in 2024. Looked at from a longer perspective, growth in Flanders since 2008 nevertheless still outperformed that in the two other regions (see figure BE2).

Unchanged scenario
The rise in both business and consumer confidence in January offset the sharp decline recorded in the final month of 2025. Sentiment rebounded in all sectors surveyed, with the exception of business-related services. In industry, the rebound was due to a more optimistic assessment of (total as well as export) order books. The capacity utilisation in the sector fell slightly, though. In the consumer survey, unemployment expectations dropped further, with the indicator reaching an all-time low in Wallonia (see figure BE3).

Respondents, especially in Wallonia, believe that unemployment will decline as a result of the policy decision to limit the unemployment benefit duration. This contrasts with the recent development of regional unemployment rates (based on administrative data). While an uptick in the rate in the second half of 2025 was seen in all three regions, it was most pronounced in Wallonia (see figure BE4). Belgium’s unemployment rate (based on the harmonised Eurostat definition) was up as well on the second half of 2025, rising from 6.0% in July to 6.4% in December. Over 2025 as a whole, the harmonised rate averaged 6.2%, up from an average of 5.7% in 2024.

As in January, we decided to keep the outlook for Belgian real GDP growth unchanged at 1.1% and 1.3% for 2026 and 2027, respectively. Forecasts for all other macro variables, including inflation, stayed unchanged as well. Belgian HICP inflation for January came in at 1.4% yoy, down from 2.2% in December. The decline was driven by a strong fall in energy inflation, from -4.4% to -9.0%, while core inflation (excluding energy and food) was slightly up, from 3.0% to 3.1%. Within the latter category, services inflation was down, while inflation for non-energy industrial goods was up. Core goods inflation in January 2026 was strong, caused by base effects as the month-on-month price decline (traditionally caused by the winter sales) has been unusually big in January 2025. In our scenario, we continue to expect Belgian HICP inflation to average 1.9% and 2.0% this and next year, respectively.
