

Economic Perspectives April 2026
Read the full publication below or click here to open the PDF.
- The war in Iran is causing significant volatility in energy markets. Oil prices have increased by 55% year-to-date since the outbreak of the conflict, while natural gas prices are up 44% year-to-date (as of Monday 20 April). Our base scenario still assumes a resumption of passage through the Strait of Hormuz in the near term. However, a longer-lasting disruption remains a major risk to our scenario. The war is also affecting other commodities. Global food prices rose by 2.4% last month, partly as a result of higher fertilizer prices and higher demand for biofuels.
- High energy prices are pushing up euro area inflation. Headline inflation increased from 1.9% to 2.6% year-on-year in March. Energy prices are now up 5.1% year-on-year. In contrast food inflation declined. Core inflation also declined from 2.4% to 2.3% year-on year as both core services and goods inflation decelerated. As the inflation figure matched our expectations, we maintain our average forecasts of 2.7% and 1.9% for this year and next year, respectively.
- High gasoline prices drove US inflation up from 2.4% to 3.3% year-on-year in March. The increase was primarily driven by a double digit increase in energy prices. In contrast, food prices were unchanged. Core inflation also increased from 2.4% to 2.5% year-on-year. This was primarily caused by a likely temporary acceleration in shelter prices. In contrast, core goods and core services (ex. shelter) prices saw more modest increases. Given the increase in gasoline prices, we upgrade our forecast by 0.2 percentage points for both 2026 and 2027 to 3.3% and 2.4% respectively.
- The Iran war will negatively affect euro area growth. Business sentiment indicators have weakened, especially for the services and construction sector. Consumer confidence also weakened substantially. The labour market remains in good shape (mainly due to outperformance in Southern economies). We maintain our 0.7% and 1.3% growth forecast for this year and next year, respectively.
- The US economy is showing signs of strain. Q4 growth was revised down again and hard data point to weakness in Q1 as well. Consumption growth may come under pressure. The labour market is resilient however, as March job growth was solid, and the unemployment rate ticked down. The war in Iran is also weighing on confidence (especially consumer confidence). We downgrade our 2026 GDP growth forecast from 2.1% to 2.0%, while maintaining our 1.9% forecast for next year.
- Chinese GDP growth accelerated to 1.3% quarter-over-quarter in the first quarter of GDP, supported by a recovery in investment. The strong Q1 growth figure offsets weaker expected growth going forward, leading to an upgrade of 2026 average GDP growth from 4.6% to 4.7%. Exports, which have been a major driver of Chinese growth the past two years, may face headwinds due to the global energy price shock, while household consumption remains sluggish.
- Central banks continue to remain in wait-and-see mode. Both the Fed and the ECB kept rates unchanged last month. We expect both central banks to keep rates unchanged this year, thus largely looking through the inflationary impact of this energy shock. For 2027, we expect the Fed to bring its policy rate to a neutral level by cutting rates twice (50 basis points in total). For the ECB, we expect the current 2.0% policy rate to be maintained next year as well. Risks are tilted to the upside as a longer conflict could spur central banks into tightening monetary policy.
Energy prices remain volatile
The evolution of the war in Iran remains the dominant factor in energy markets. Earlier in the month, Brent oil prices rose to almost 110 USD per barrel as US President Donald Trump threatened to attack key infrastructure in Iran. As the US and Iran agreed on a two-week ceasefire, oil prices again dropped below 100 USD per barrel. Negotiations are now ongoing to make a more long-term agreement, which would likely involve a.o. a reopening of the Strait of Hormuz. Our base scenario assumes a deal will soon be reached. Oil markets seem to agree. As of Monday 20 April, oil prices were around 94 USD per barrel (a 55% year-to-date increase). However, futures markets expect prices to drop to 81 USD by the end of this year. That said, prices will remain well above the 60 USD levels seen at the beginning of the year, when the market was oversupplied.
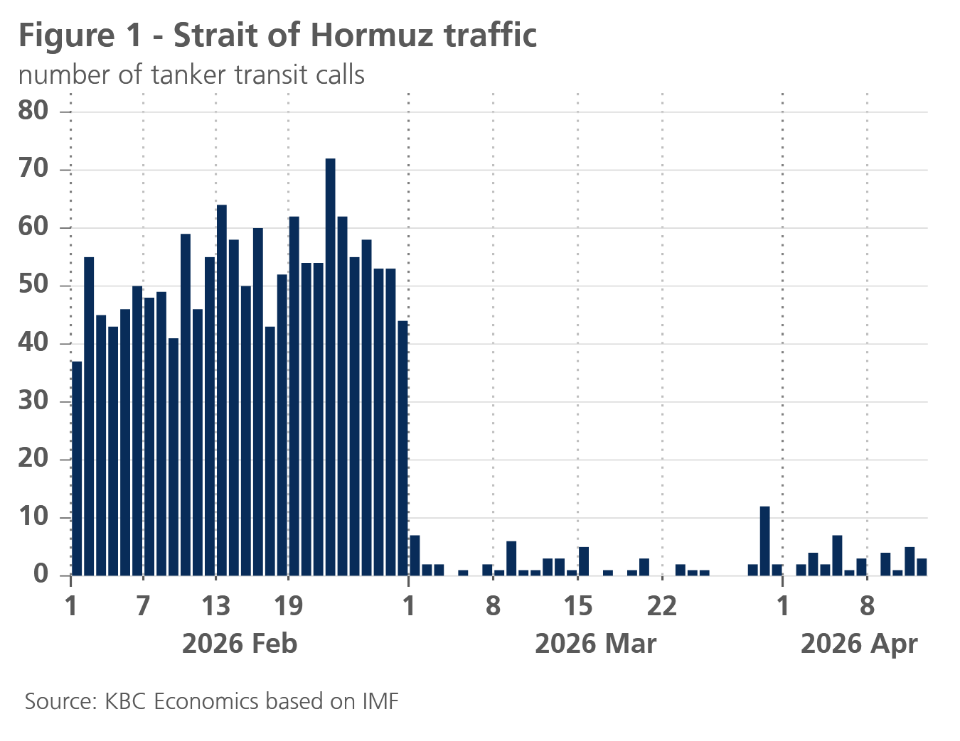
A longer-lasting conflict remains a major risk to our economic scenario, however. The closure of the Strait of Hormuz has caused the market to be largely undersupplied. According to the International Energy Agency (IEA), energy supply was 10.1 million barrels per day lower on average in March. As a result, global inventories fell by 85 million barrels last month. Though traffic through the Strait has been severely reduced, some ships (especially those originating from Iran), still managed to navigate through it (see figure 1). The US’s decision to implement its own blockade will therefore cause a further hit to supply.
Along with oil prices, European natural gas prices show high volatility. Dutch TTF prices peaked at 62 EUR per MWh in March and were down to 41 EUR per MWh as of Monday 20 April. The decline was not only driven by easing tensions in the Middle East. Warmer-than-usual weather lowered demand for heating across Europe. That said, natural gas prices remain well above levels seen at the beginning of this year (around 30 EUR per MWh).
Higher energy prices are starting to spill over to global food prices, which rose by 2.4% last month. This was in large part caused by higher sugar and vegetable oil prices, which both faced upward pressure because of higher demand for biofuels. Cereal prices also rose, partly in anticipation of higher fertilizer costs.
Initial impact of energy price shock on euro area inflation
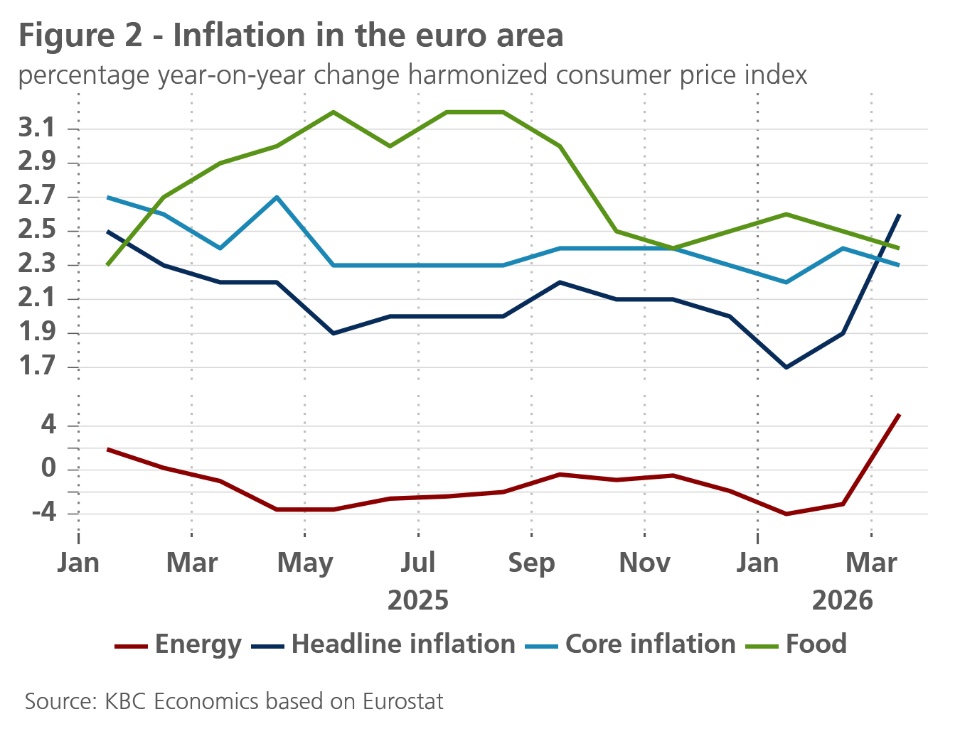
In the euro area, year-on-year inflation rose by 0.7 percentage points to 2.6% in March. The year-on-year rise in energy prices of 5.1% (compared with a fall of 3.1% in February) was the sole cause of this. Both core inflation and food price inflation fell by 0.1 percentage points to 2.3% and 2.4% year-on-year, respectively (see Figure 2). Within core inflation, the rate of price increases for both non-energy goods and services slowed. This partially offset the surge seen in February.
Higher energy prices will push inflation up even further in the coming months. In our outlook, we now assume that indirect effects will also push up core inflation (for the time being) slightly. This month, we estimate expected energy price inflation to be slightly lower than last month, as futures market prices – particularly for European natural gas – are now lower than they were last month. Consequently, we maintain our forecast for average inflation at 2.7% in 2026 and 1.9% in 2027, despite factoring in slightly higher indirect price effects from the energy price shock. The longer the war in the Middle East continues, the greater the risk of higher inflation. In particular, larger indirect effects and second-round effects via wage adjustments to higher inflation are then more likely, at least as long as the economy shows sufficient resilience.
High gasoline prices drive up US inflation in March
US CPI inflation increased from 2.4% to 3.3% year-on-year in March. This increase was largely driven by a 10.9% month-on-month increase in energy prices. Within energy prices, energy commodities (i.e. fuel oil and motor fuel) drove the increase, rising by 21.3% last month. Energy services (i.e. electricity and gas service) remained under control as US natural gas prices have remained largely unchanged since the outbreak of the war. Food prices remained unchanged last month as a drop in food at home prices was compensated by an increase in restaurant prices. Food prices are expected to accelerate as the war (and the resulting fertilizer shortage) are pushing up global food prices.
Core inflation also increased (from 2.4% to 2.5% year-on-year). On a monthly basis core inflation increased by a modest 0.2%. Within core components, shelter prices increased by 0.3% month-on-month. This is likely to be a one-off increase as market rents point to lower shelter inflation ahead. Notwithstanding a big jump in public transportation prices, services (ex. shelter) rose by a modest 0.2% last month. An encouraging trend has been the continued decline in insurance prices (especially health insurance).
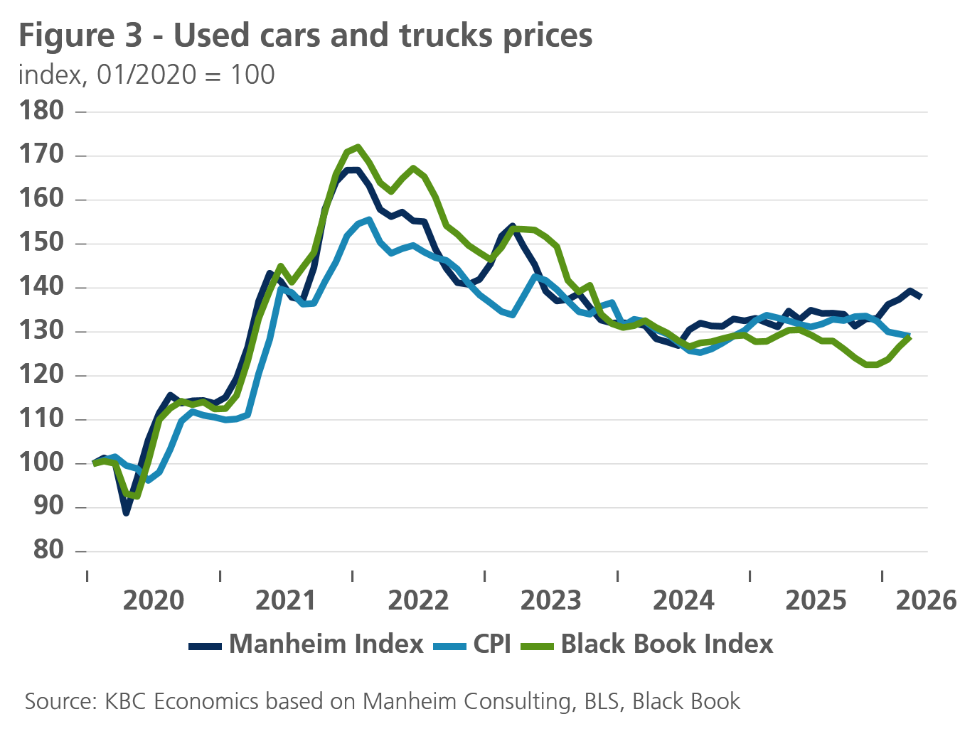
Core goods prices rose by a modest 0.1%. This soft figure is partly due to a continued decline in used cars and trucks. This decline is notable as forward-looking indicators point to price increases in this category (see figure 3). Medicinal drug prices also continued their descent. In contrast, apparel prices posted another big increase, which could be tariff related.
We expect inflation to further accelerate this month, as gasoline prices climbed further at the beginning of April. However, we predict inflation will ease later this year (assuming the Strait of Hormuz reopens). As West Texas Intermediate (WTI) prices have caught up with Brent prices and are higher than at our last forecasting round, we upgrade our inflation forecast by 0.2 percentage points for both 2026 and 2027 to 3.3% and 2.4%, respectively.
How resilient will European economies remain?
The volatile, unpredictable course of the war in the Middle East continues to fuel economic uncertainty. This was reflected in the deterioration of consumer and business confidence in March. Furthermore, the 0.4% month-on-month rise in industrial production in February was far from sufficient to offset the declines seen in December and January. It suggests that even before the start of the war in the Middle East, the economy may have been weaker than hoped. Energy problems therefore threaten to become a serious challenge to economic resilience.
European economies are generally no more energy-intensive than other major economies in the world. However, they are often heavily dependent on oil and gas, of which Europe is a net importer. Higher energy prices therefore lead to a deterioration in the terms of trade, with a corresponding loss of purchasing power for households and a decline in competitiveness for businesses. The longer the war lasts, the greater the threat of physical energy shortages and the risk of further disruptions to supply chains. These could significantly increase the economic damage. After all, in addition to direct exposure to imports from the Middle East, there is also indirect exposure via imports from other regions, not least in Asia. There, a number of economies are feeling the direct impact of the blockade of the Strait of Hormuz more acutely. Problems with suppliers from those regions could cause further difficulties in Europe.
In general, most European economies have demonstrated remarkable resilience during the numerous recent crises. This was partly due to substantial government support. Today, there is hardly any scope for this. The government measures decided upon so far in a significant number of euro area countries remain much more limited than during the pandemic and the previous energy crisis. Today, the economy must demonstrate resilience with far less government support.
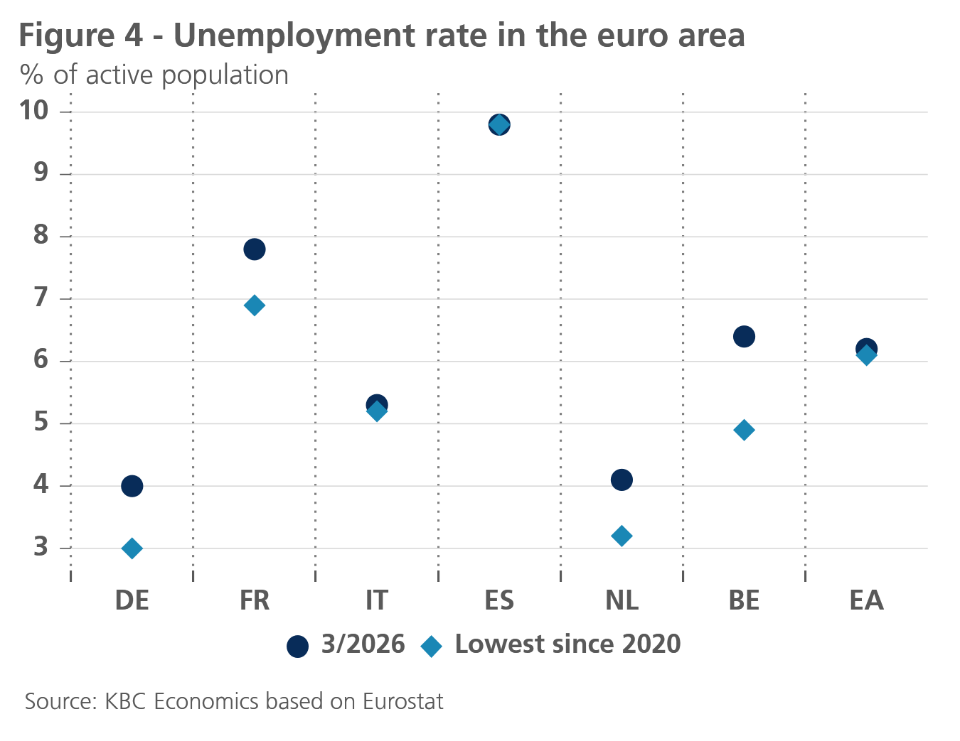
In this respect, developments in the labour market deserve particular attention. In February, the unemployment rate in the euro area rose from a historic low of 6.1% to 6.2%. This figure, which remains very low by historical standards, suggests a tight labour market. This is likely also because, against the backdrop of an ageing population and a shrinking labour supply, companies are reluctant to let staff go. However, other indicators, such as the vacancy rate, do point to a reduction in the tightness of the labour market. Moreover, the low unemployment rate for the euro area as a whole masks divergent trends across countries. In a number of countries, including Germany, France, the Netherlands and Belgium, the unemployment rate has already risen slightly in the recent past (see figure 4). Future developments will be an important indicator of resilience.
Following last month’s downward revision of our growth forecast, we are leaving this month’s forecast unchanged. We therefore expect real GDP growth in the euro area to be 0.7% in 2026 and 1.3% in 2027. However, as the war in the Middle East drags on, the downside risks to this outlook are increasing.
US economy is weakening
The US economy is showing signs of strain. US Q4 2025 GDP was revised downwards again to 0.1% quarter-on-quarter. Downward revisions were made in the consumer spending and investment category. In the latter, there was a significant downward revision to the contribution of inventories.
Data on Q1 2026 have also been weak overall. Real personal consumption expenditures rose by only 0.1% last month and were unchanged in January. Though retail sales point to increased consumption in March, the trade deficit is also widening again, led by stronger imports, which could hurt the contribution of net exports. Housing data have also been on the weaker side, with new home sales and construction spending declining in January. Confidence of house builders also dropped significantly this month.
In contrast to activity indicators, the labour market is showing signs of strength. The 133k job decline in February was reversed in March with a 178k gain. The low February figure was caused by poor weather and strikes, which were over in March. Ignoring this month-on-month volatility, job growth was decent in Q1, with jobs increasing by 205k last quarter. The unemployment rate also ticked down last month, indicating resilience in the labour market.
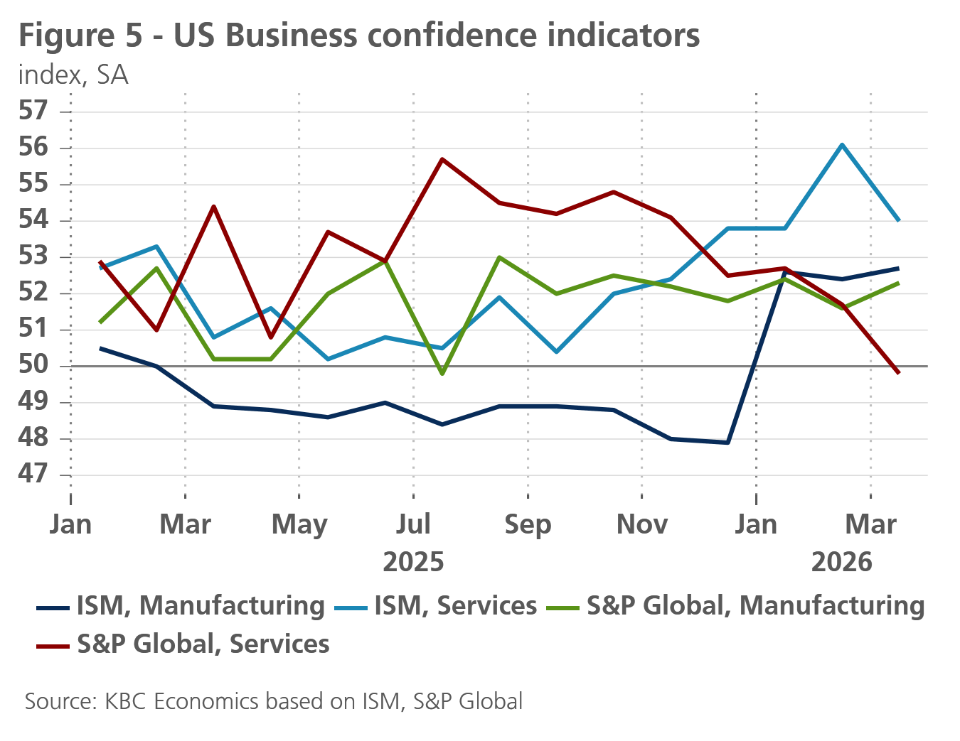
Looking ahead, the on-going war in Iran seems to have hit confidence. This is especially the case for consumer confidence as the Michigan consumer sentiment index reached a historic low last month. Business sentiment indicators have been more resilient. However, while manufacturing confidence improved slightly, this was driven by sharply higher supplier delivery times, indicating supply disruptions stemming from the war in the Middle East. In contrast, confidence indicators in the services sector dropped notably (see figure 5).
We thus expect the war in Iran to weigh on consumer spending. However, as the US is a net exporter of oil, we could see its terms of trade improve this year, resulting in more positive contributions from net exports. Nonetheless, given the weaker Q4 2025 and Q1 2026 data, we downgrade our 2026 average GDP forecast from 2.1% to 2.0% while maintaining our 1.9% forecast for next year.
China’s economy remains resilient
The Chinese economy accelerated in the first quarter of 2026, growing 1.3% quarter-on-quarter (up from 1.2% in Q4 2025). A breakdown of the contributions to growth shows that a strong recovery in investment in the first quarter played an outsized role, contributing 1.9 percentage points to the 5% year-on-year figure. Consumption contributed a roughly stable 2.3 percentage points while net exports contributed a smaller 0.77 percentage points (down from 1.4 percentage points in Q4 2025).
The economy continues to be supported by a surge in hi-tech manufacturing (+12.5% in the first quarter compared to the same period last year), bolstering industrial production. Strength in industrial production has been closely linked to China’s export performance, which was a major driver of growth in 2024 and 2025. Elevated demand for Chinese goods, however, may come under pressure as the energy shock weakens global demand. Already in March, export growth was weaker, at 2.5% year-on-year, relative to the outsized growth seen in recent months (39.6% year-on-year in February). China’s growing market dominance for green tech goods (solar cells, EVs, e.g.), however, may present an offsetting tailwind to Chinese exports, as higher oil and gas prices could induce demand for these products.
Meanwhile, domestic demand remains weak but shows some signs of stabilisation. Consumer confidence continues to climb from low levels, while retail sales were somewhat stronger in Q1, partly related to holiday spending. Challenges remain, particularly as the housing market remains weak and house prices continued to decline in February. Prices in the secondary market were down 6.33% relative to a year earlier and down 22.3% since the market correction started in mid-2021. The labour market also continues to show signs of weakness, with the employment components of business sentiment surveys (PMIs) for the construction and services sectors declining further in March.
We have therefore downgraded the GDP growth outlook modestly for Q2 and Q3 2025. However, given the stronger-than-expected growth outturn in the first quarter, 2026 average GDP growth is revised up, from 4.6% to 4.7%, while the 2027 average figure is revised down from 4.2% to 4.1%.
Inflation, meanwhile, continues to show signs of escaping a deflationary spiral. Though both headline and core inflation ticked down in March (to 1.0% and 1.1% year-over-year, respectively), partially due to some holiday-related impacts (prices for travel services, hotel accommodation, and vehicle rentals eased substantially), producer price inflation finally turned positive in year-over-year terms in March (0.5%) after forty-one months of decline. The higher producer prices are directly related to higher imported energy prices due to disruptions in the Strait of Hormuz. We have revised our outlook for 2026 average annual inflation from 0.9% to 1.0%.
ECB faces difficult policy choice
The ECB's reaction to the current negative supply shock is highly uncertain. While our outlook for headline inflation in 2026 and 2027 for the euro area remains unchanged, it conceals lower expected energy price inflation, offset by stronger indirect pass-through of energy prices into underlying core inflation (both the goods and services component). Significant second-round effects in market inflation expectations for 2027 and beyond are not observed for the time being, so on balance we still assume that the ECB will remain on the sidelines. However, the continued anchoring of medium-term inflation expectations around the inflation target is a crucial precondition for this. Consequently, we are monitoring this risk factor very closely.
Regarding the April ECB policy meeting, market expectations are in line with our scenario. While just after the previous policy meeting in March a rate hike in April was almost fully priced in by the market, the market currently assigns a probability of over 80% to an unchanged ECB deposit rate. For the June policy meeting, when the ECB will have its new staff projections available, the market does still take into account a possible rate hike, with a probability of just above 50%. However, even that expectation is highly volatile, and the main alternative market scenario is also an unchanged policy rate for June.
On balance, we confirm our scenario that the ECB will remain on the sidelines for the remainder of 2026. However, we are aware of the upside interest rate risk, and therefore closely monitor developments in inflation expectations over the medium term. On the other hand, however, there is also the risk that the energy price shock and extreme uncertainty would weigh more strongly and for longer than expected on European growth. The ECB would presumably take that into account as well. That would, ceteris paribus, make a rate hike less likely. While the ECB only has price stability as its primary policy objective, in the past it has also been sensitive to developments in the growth outlook.
The Fed is also likely to remain on the sidelines
Partly as a result of the catch-up in WTI oil prices relative to Brent, we have revised upwards our US inflation outlook for 2026 and 2027. The inflationary impact of the 2025 trade tariffs seems to have largely worn off, so future inflation dynamics will mainly be determined by the impact of the current energy price shock. However, medium-term market expectations still remain well anchored around the Fed's inflation target.
Consequently, we confirm our scenario that the Fed will keep its policy rate unchanged until spring 2027, despite the fact that the current policy rate is still at the upper end of the neutral band (unlike the ECB policy rate, which is already at a neutral level). This is because both headline and core inflation are likely to remain above the Fed's inflation target in the near term. We expect the Fed to cut its policy rate by around 50 basis points in total to 3.125% during 2027. This is the neutral policy rate that the Fed puts forward in its median projections ('dot plots').
Stable bond yields
German and US 10-year bond yields have hovered around a relatively stable 3% and 4.3% respectively in recent weeks. This is in line with our bond yield scenario, which assumes largely stable German yields, and slight upside potential for US yields to 4.5% by the end of 2026. The limited near-term rise in US 10-year rates is related, among other things, to the positive 10-year spread between US government yields and dollar interest rate swaps. This contrasts with Germany, where 10-year German government interest rates and euro interest rate swaps are almost equal. The positive spread in the US points to a risk premium in US 10-year government bond yields, which may be mainly related to the unfavourable US fiscal development.
Intra-EMU spreads ease again
After the start of the war in Iran and the subsequent energy price shock, intra-EMU interest rate spreads between European government bonds and Germany jumped. This was especially the case for countries that rely heavily on energy imports from the Middle East. The Italian yield spread was a telling example. The jump in the spread reversed again in recent days due to easing energy prices and speculation on a possible quick resolution of the conflict. Based on the fundamental assumption of our scenario that the current crisis is temporary, we assume the latest easing of European bond yield spreads will persist.
All historical prices, statistics and charts are up to date as of 21 April 2026, unless otherwise stated. The positions and forecasts provided are those as of 21 April 2026.