

Economic Perspectives September 2026
Read the full publication below or click here to open the PDF.
- Tensions in the Middle East have pushed up energy prices over the summer. Natural gas prices in particular rose from 43 EUR per MWh end of June to 83 EUR per MWh (as of 14 September), driven by the unavailability of Qatari LNG supply and low EU reserves. Oil prices also rose from 73 USD per barrel end of June to 107 USD per barrel (as of 14 September). On top of that, Ukrainian attacks on Russian refineries have further pushed up prices of refined oil. Future curves still price in gradual energy price normalisation (in line with our base scenario). However, a longer and widening conflict, resulting in further and more persistent price increases is the most important downside risk to our scenario.
- Euro area inflation accelerated from 2.9% to 3.2% in August. The acceleration can largely be attributed to another big increase in energy inflation. In contrast, food inflation decreased, while core inflation decelerated from 2.5% to 2.4%. Within core components, services inflation declined materially, while core goods inflation accelerated. Given the rise in energy prices, we have revised our euro area inflation forecasts upwards from 2.8% to 3.0% in 2026 and from 1.8% to 2.1% in 2027, with risks clearly tilted to the upside.
- US inflation remained at an elevated 3.4% in August, driven in large part by higher energy prices. Food inflation remained contained and core inflation decreased from 2.5% to 2.4%. Goods prices increased slightly due to an increase in vehicle prices. Higher hotel prices pushed up shelter prices. Services inflation (excl. shelter) accelerated, though this was partly due to some exceptional price increases. Given the rise in oil prices, we upgrade both our 2026 and 2027 inflation forecasts by 0.1 percentage points to 3.4% and 2.6%, respectively. A further rise in oil prices is an important upside risk to our base scenario.
- The euro area economy remains resilient to the energy shock for now. Q2 GDP was revised upwards from 0.4% to 0.6% quarter-on-quarter, mainly due to a strong rebound in Irish GDP growth. Excluding Ireland, euro area growth remained at a decent 0.3%. Net exports and consumption made the strongest contributions to Q2 growth, while inventories contributed negatively. Confidence indicators also point to decent growth ahead, while the labour market remains in solid shape. We upgrade our 2026 forecast from 0.7% to 0.9%, but downgrade 2027 growth from 1.1% to 0.9% (given higher energy prices and tighter monetary conditions). A worsening of the energy crisis, which is a material risk, could result in further downgrades to our 2027 scenario.
- The US economy remains in healthy shape. Though Q2 growth was only 1.5% quarter-on-quarter annualised, it was dragged down by volatile components (i.e. net exports, inventories and government spending). Investments and consumption again made strong contributions. Growth is expected to rebound in Q3 as consumption remains healthy and non-residential investments continue to drive up growth. The labour market also remains on a strong footing and business confidence point to strong growth ahead. We thus raise our 2026 growth forecast from 2% to 2.1%, while maintaining our 2% forecast for 2027.
- The Chinese economy continues to grow at a somewhat sluggish rate, with imbalances between the export-oriented and domestic economy still evident. We expect average GDP growth of 4.5% in 2026, falling to 4.2% in 2027. Both core and headline inflation remain tepid, with energy prices pushing producer prices somewhat higher.
- The continued rise in energy prices is pressuring central banks to tighten their monetary policy. In line with expectations, both the Fed and the ECB raised their policy rates in September . Further rate rises are in the cards. We expect the expect the Fed to raise its policy rate again next quarter. We expect the ECB to raise its policy rate two more times this rate hiking cycle (in Q4 2026 and Q1 2027). Risks to our interest rate scenario are tilted to the upside as even higher energy prices could result in a more hawkish monetary policy.
Iran war causes jump in energy prices
The war in the Middle East continues to roil energy markets. Though the US and Iran signed a Memorandum of Understanding in June, hostilities resumed in July. Consequently, Iran has severely constrained passage of commercial vessels through the Strait of Hormuz, while the US continues to enforce a blockade of Iranian oil exports. Recent escalations, such as the Iranian and US strikes on oil tankers, point to a longer-lasting conflict. Furthermore, the conflict is widening throughout the region as tensions between the Houthis and Saudi Arabia are flaring up.
The prospect of a longer conflict has driven up energy prices since the summer. Natural gas prices in particular rose rapidly. They reached 83 EUR per MWh (as of 14 September), up from 43 EUR per MWh end of June. The sharp reduction in LNG supply from Qatar (which used to provide 20% of global LNG exports) is the prime driver of this rise. On top of that, summer heatwaves increased demand for air-conditioning. Furthermore, European gas reserves are at historic lows (69% of total capacity), meaning that gas demand from Europe will be elevated in the coming months as refilling picks up pace.
Oil prices have also increased substantially since the summer. They reached 107 USD per barrel (as of 14 September), up from 73 USD per barrel end of June. Low tanker activity through the Strait of Hormuz, along with Houthi attacks on Saudi oil installations are the prime driver of this increase. Consequently, Gulf oil production declined by more than 10 million barrels per day in August. Non-OPEC+ countries are partly compensating the shortfall, particularly in the Americas. Demand is also set to decline in 2026, with the International Energy Agency now forecasting world oil demand to decline by 2.5 million barrels per day this year. Inventory loss is also partly compensating this shortfall as global oil observed inventories declined by 507 million barrels since the outbreak of the war. As inventories are running low, further demand destruction might be required in compensation.
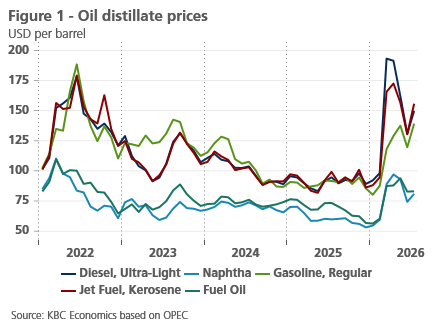
Refining activity is also under pressure. Global refinery output has diminished substantially since the outbreak of the war, as Middle Eastern refineries have remained largely idle and as Ukrainian drone strikes have taken a large part of Russian oil refineries off-line. These supply disruptions have sharply increased prices for refined oil products (see figure 1). As off 14 September, the 3-2-1 Brent crack spread, which represents the margin gained from refining three barrels of brent crude oil into two barrels of gasoline and one of distillate fuel reached 53 USD per barrel (up from 19 USD per barrel end of February).
Oil and gas futures still price in a gradual easing of energy prices, which is in line with our base scenario. However, a much longer and widening conflict is a serious risk to our scenario and would push energy prices even higher.
Euro area inflation continues to rise
In August, year-on-year inflation in the euro area rose by 0.3 percentage points to 3.2%. The rise was entirely due to the increase in energy price inflation from 10.3% in July to 14.3% in August. Food price inflation declined the remarkably low level of 1.1%, whilst core inflation – that is, the rate of price rises for services and non-energy goods – fell by 0.1 percentage points to 2.4%. The latter was mainly due to the cooling of services inflation from 3.3% in July to 3.0% in August. The year-on-year rate of increase for non-energy goods picked up from 0.9% to 1.2%.
The inflation picture continues to be dominated by trends in energy prices, which will give inflation a further boost in the coming months. In our outlook, we assume that normalising energy prices from spring 2027 onwards will put inflation back on a downward trajectory. A sharp fall is then possible, but in the meantime, inflation is likely to continue to fluctuate between 3.5% and 4.0%. The actual trend will depend not only on energy prices, but also on the extent to which the rise in energy prices feeds through to core inflation. The response of food prices to the rise in energy costs and the hot, dry summer will also have a decisive, though difficult-to-predict, impact. Regarding core inflation, we maintain our view that indirect effects of the energy price shock and second-round effects via wage adjustments are likely to remain rather limited. In other words, we expect that there will be no renewed sharp surge in wage cost pressures, as was the case with the previous energy price shock (see figure 2). Leading wage indicators certainly do not yet point to any wage adjustments on the horizon, whilst some improvement in productivity growth may temper the rise in labour costs per unit of output, as was indeed the case in the second quarter of 2026 (see figure 2).
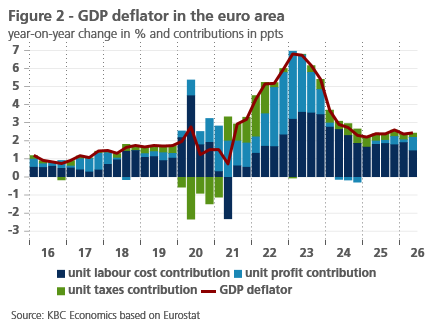
Nevertheless, the recent stronger-than-expected rise in energy prices has prompted us to revise our forecast for average inflation in 2026 upwards, from 2.8% to 3.0%, and from 1.8% to 2.1% for 2027. However, the uncertainty surrounding this forecast is particularly high, with the risks predominantly on the upside.
US inflation remains persistent
US year-on-year inflation remained unchanged at an elevated 3.4% in August. This upside surprise was largely due to another big jump in energy prices. These increased by 2.1% month-on-month due to jumps in gasoline and fuel oil prices. In contrast, food inflation remained contained, as food at home prices were unchanged in August. Food producer price inflation was also low in the last few months (see figure 3), indicating that food inflation is likely to remain subdued in 2026. However, as global food prices are rising and high energy prices and El Nino will likely negatively affect harvests, food price inflation is set to accelerate next year.
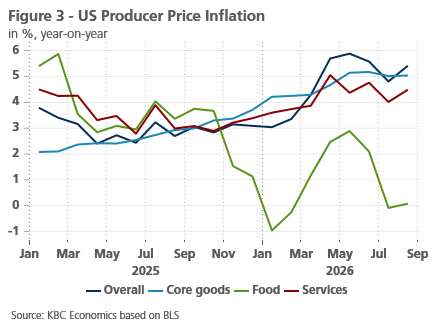
Core inflation declined marginally from 2.48% year-on-year to 2.45%. Core goods price increased slightly, largely due to increases in vehicle prices. In contrast, apparel, household furnishings and recreation commodity prices were unchanged, while pharmaceutical prices declined. Core goods producer prices suggest somewhat stronger goods inflation ahead (see figure 3).
Shelter prices accelerated last month to 0.3% month-on-month, though that was mostly due to a jump in hotel prices. Rent inflation remained contained.Services prices (excluding shelter) increased by 0.4% last month. There were some notable increases in airline fares and telephone services. Insurance prices (both for health and car insurance) continued their descent.Services inflationcould further moderate in the months ahead, as wage pressures are diminishing.
The somewhat stronger-than-anticipated inflation figure, along with the continued rise in oil prices prompted us to revise our inflation forecasts upwards. We thus upgrade both our 2026 and 2027 inflation forecasts by 0.1 percentage point to 3.4% and 2.6% respectively. Further oil prices increases are an important upside risk to this outlook.
Euro area economy remains resilient
Eurostat’s figures for quarter-on-quarter growth in euro area real GDP in the second quarter of 2026 have been revised upwards by 0.2 percentage points to 0.6%. The upward revision was mainly attributable to Ireland, where the initially estimated growth of 3.9% was revised upwards to 10.2%. Excluding Ireland, real GDP growth in the euro area in the second quarter stood at 0.3%, the same as in the first quarter, and still slightly better than our initial forecast. This points to the continued stronger-than-expected resilience of the European economy.
Growth in the German economy was also revised upwards compared with the initial estimates (from 0.2% to 0.3%), confirming the positive surprise. Growth in the French economy, by contrast, was revised downwards from 0.2% to 0.0%, following a sharper-than-expected decline in the first quarter (-0.2% instead of -0.1%). Among other things, measures to keep the budget deficit under control – such as an increase in VAT and social security contributions, and a reduction in public investment – are weighing on growth. The growth forecast for the other major euro area countries remained unchanged. This means that the Spanish economy remained the frontrunner with growth of 0.7%, that the Dutch economy (+0.4%) continued to perform well, and that, by Italian standards, economic growth on the peninsula was also satisfactory: 0.2%, following two consecutive quarters of 0.3% growth.
Figures on the components of expenditure show a strong contribution to growth from net exports, which is largely offset by destocking. This picture is somewhat distorted by the Irish figures. Excluding Ireland, the contribution to growth from (net) exports remains very significant but is less dominant (see figure 4). In fact, the largest contribution comes from household expenditure. As in the past two years, Spanish consumers in particular played a key role in this, whilst Italians also made a substantial contribution. In Germany, by contrast, consumers remained remarkably sluggish. The stronger-than-expected real GDP growth there was almost entirely attributable to (net) exports. After all, investment demand also remained very weak there. The latter was also true of the euro area as a whole.
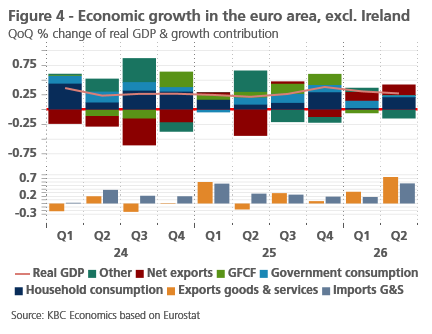
The stronger-than-expected resilience of economic growth is accompanied by a further rise of the labour population, albeit at a slower pace than in 2025. The increase is nevertheless sufficient to stabilise the unemployment rate, keeping it close to its historic low. Moreover, in the European Commission’s recent confidence surveys, employment expectations are improving. This improvement is part of a broader upturn in confidence indicators, among both consumers and producers, albeit mainly in industry and services, and to a much lesser extent in construction.
Particularly encouraging were the surveys by the German ifo Institute on the expected economic outlook for the next six months. These show a notably strong improvement (see figure 5). This may be a consequence of the observation that the fiscal stimuli and reforms of the Merz government, following an initial sluggish start, appear to be gaining momentum. The slight growth in value added in industry can be seen as the first signs of a successful restructuring of the German economy. However, tentative glimmers of light at the end of the tunnel do not necessarily imply that the end of the tunnel is near. Major restructurings are still ahead, and the political climate in Germany remains precarious, as is also the case in various other parts of the euro area.
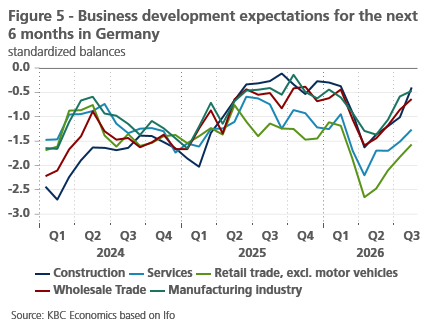
Furthermore, the geopolitical environment remains highly unstable and risky, with the sharp recent rise in energy prices in particular posing new challenges. It also remains to be seen what economic damage the extreme heat and drought during the summer months will have caused. Despite the improvement in sentiment indicators, our growth forecasts for the near future therefore remain cautious.
We have slightly raised our growth forecast for the third quarter of 2026, but due to the recent sharp rise in energy prices, we lower our expectations a bit for the fourth quarter of 2026 and the first half of 2027. More expensive energy means a new blow to the purchasing power of households and a deterioration in the competitiveness of companies. The stronger than expected monetary tightening by the European Central Bank is not helping the recovery in growth either.
However, because of the upward revision of the growth rate for the second quarter, the average growth of real GDP in the euro area in 2026 is expected to be slightly higher than projected in our previous estimate: 0.9% instead of 0.7%. But we are lowering our growth forecast for 2027 from 1.1% to 0.9% as well. Further downgrades are likely if the situation in the Middle East were to further deteriorate.
US economy remains in good shape
US GDP was confirmed at 1.5% quarter-on-quarter annualised. The softer figure is mostly due to more volatile components. Net exports, inventories and government spending all made negative contributions. Private consumption and fixed investments both made solid contributions of 2.3 and 1.2 percentage points respectively. This confirms that the underlying growth momentum remains on a strong footing.
Hard data also point to decent growth in Q3. Continued strength in capital goods orders, shipments and imports point to another strong contribution from non-residential investments this quarter (especially from the IT sector). Consumption is also set to remain strong this quarter. Though real personal expenditures were broadly unchanged in July compared to June, this was partly because Amazon Prime Day fell in June this year (it typically falls in July). This shift boosted consumption in June and dampened it in July. Goods consumption dropped by 0.6% in July. However, services consumption increased by 0.3% in July, suggesting a healthy underlying consumption trend. Elevated retail sales in August also suggest consumption growth will be robust in Q3.
The strong consumption trend is supported by the continued resilience of the labour market. Following two months of weak job growth, non-farm payrolls increased by a healthy 162k in August. The unemployment rate also remained at a low 4.1%, while the participation rate ticked up. Average weekly hours worked also ticked up slightly. The number of people employed part time for economic reasons dropped notably. Job openings also remain at an elevated level.
Some pockets of weakness remain. With mortgage rates rising sharply, the housing market is under pressure. Housing starts fell by 12% in July. Pending home sales also fell in July. Building sentiment also remains very weak, as residential construction spending dropped by 1.3% in July.
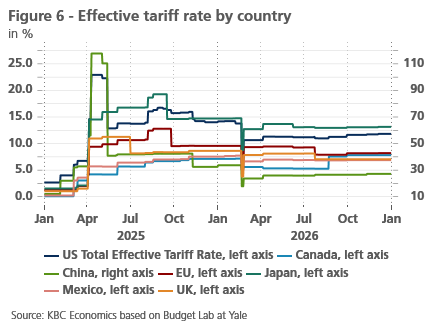
Net exports are also set to make a negative contribution in Q3, as the trade deficit widened by 24.4% in July. US trade policy remains an important source of uncertainty for the US economy. In July, the 10% Section 122 tariffs expired (as mandated by law). They were largely replaced by Section 301 tariffs on sixty economies (of 10% to 12.5%). However, thanks to the many exemptions, the effective tariff rates of several economies are lower than the headline rate suggests (see figure 6). The US also escalated its trade war with Canada in August by levying 50% tariffs on 20 billion USD worth of Canadian imports. Canada retaliated in kind.
Despite all these important changes to US trade policy, the US overall effective tariff rate has remained remarkably steady. It is now at 11.3%, which it the same level as it was before the Section 122 tariffs expired. As new Section 232 tariffs on pharmaceuticals and polysilicon products are set to go into effect later this year, the total effective tariff is expected to reach 11.8% by end of this year (assuming no new tariffs).
That said, we expect the economy to remain resilient to the on-going trade war and energy shock. Given the strength of the latest hard data, along with the continued strength in confidence indicators, we upgrade our 2026 growth forecast from 2.0% to 2.1%, while maintaining our 2.0% forecast for 2027.
China’s domestic activity remains weak
The Chinese economy continues to grow at a somewhat sluggish rate. In August, private business sentiment surveys (S&P PMIs) rebounded, to 51.4 for services and 51.5 for manufacturing (where above 50 signals expansion), while official sentiment surveys (CFLP PMIs) remained in contraction territory at 49.8 (manufacturing) and 49.0 (services). The divergence in these indicators may reflect a stronger representation of export-focused manufacturers in the S&P PMI. Indeed, the duality of the Chinese economy continues, with supercharged export growth compensating for lackluster domestic activity. Exports were up 25% in August relative to a year earlier, supported by high tech exports (including batteries and electric vehicles). Imports were also up strongly, by 28.2% year-on-year in August, much of which has been driven by high tech imports and other inputs for China’s manufacturing sector as well as fertilizer.
Meanwhile, domestic demand in China continues to be weighed down by both structural and cyclical headwinds. Consumer confidence is still lackluster, the real estate sector has not turned around, employment surveys point to ongoing labour market slack, and retail trade grows at an underwhelming pace (even contracting 0.13% month-on-month in August). Other indicators also point to ongoing weakness in the economy. Fixed asset investment continues to decline, contracting 7.2% in the first eight months of the year compared to the same period last year. For now, we continue to expect average GDP growth of 4.5% in 2026, falling to 4.2% in 2027.
While the imbalances in the Chinese economy are widely seen as contributing to China’s growing trade surplus with the rest of the world, temporarily slower growth in China may hold a silver lining for the global economy. Since the start of the closure of the Strait of Hormuz, China’s import of crude and refined petroleum products has dropped sharply (down 25% year-on-year in July). Much of this was thanks to a significant build-up of China’s strategic oil reserves last year, allowing China to draw down on those reserves as global oil prices shot up. Lower demand from China helped put a lid on oil prices despite the significant supply shock. Since June, Chinese oil imports have started to climb again but remain well below pre-conflict levels. With fixed asset investment contracting, it seems unlikely that Chinese demand for crude oil will swing back to those levels in the near term. However, industrial production, which has grown at a rather stop-start pace this year, accelerated from 4.5% to 5.2% year-on-year in August. Stronger demand for crude oil from China’s manufacturing sector would likely add to global energy price pressures in the absence of a reopening of the Strait.
ECB reacts to persistent energy price shock
On 10 September, the ECB raised its policy rate, the deposit rate, by 25 basis points to 2.50%, as expected. As a result, the refinancing rate and the marginal lending rate also increased by 25 basis points each to 2.65% and 2.90%, respectively. The decision was accompanied by new forecasts from the ECB economists. Again, there were a total of three alternative scenarios in addition to the baseline scenario (one milder and two more pessimistic).
In the base scenario, two things in particular stood out. First, ECB economists revised their growth forecast upwards for 2026 and 2027 compared with the June projections (for 2026 to 0.9% (+0.1 percentage points) and for 2027 to 1.4% (+0.2 percentage points). Once again, Ireland's GDP distorted these figures. Based on the measure of Ireland's 'modified domestic demand', European growth is expected to be 0.4 percentage points higher at 1.2% compared to June forecasts in 2026 and unchanged in 2027 from June forecasts at 1.2%.
Second, it was striking that according to the ECB, both in the baseline scenario, and in all three alternative scenarios, underlying core inflation remains well above the 2% inflation target until 2028. On this point, it is important to note that when making these projections, the ECB economists incorporated market-implied interest rate expectations and commodity future prices prevailing on 19 August. At that point in time, markets were already pricing in, in addition to an interest rate hike in September, two further rate hikes of 25 basis points each. Therefore, the combination of market expectations and ECB models, strictly speaking, suggests that even with a policy rate peak of around 3%, the path of underlying core inflation in the baseline scenario will not returning to the ECB's 2% target quickly enough. This is even more pronounced in the ECB's 'adverse' and 'severe' scenarios, and, remarkably, is also the case in the milder scenario in which energy prices normalise to the downside relatively faster.
Our current headline inflation outlook for 2026 is in line with the ECB’s baseline scenario (3%). However, for 2027 (2.1%) and 2028 (1.6%), our outlook is lower than that of the ECB (2.5% and 2.1%, respectively). The same is true for our estimate of underlying core inflation. The KBC and ECB forecasts for 2026 are close at 2.4% and 2.5%, respectively. However, in 2027 and 2028, we expect core inflation of 2.3% and 2.0%, respectively, compared to the ECB’s 2.6% and 2.3%, respectively.
The difference in these core inflation forecasts lies mainly in our expectation of lower services inflation in 2027-28 (2.7% and 2.4%, respectively) compared to the ECB (3% and 2.9%, respectively). Regarding headline inflation, we also expect a stronger negative statistical base effect in 2027-28 for energy price inflation (-1.7% and -4.4%, respectively) compared to the ECB (+1.0% and -0.6%, respectively). This discrepancy stems mainly from different cut-off dates for oil and gas prices based on futures curves. While we are working with recent data from 10 September (after a sharp increase and consequently a subsequent stronger expected percentage decline in 2027-28), for the ECB it is 19 August.
The ECB economists see three important determinants for the expected strength of inflation. First, of course, there is the energy price shock, which is likely to last longer than initially expected. Further geopolitical developments in the Middle East play an important role in this. Second, there is the stronger-than-expected starting point of the projected real GDP growth path in the euro area, which is accompanied by lower unemployment rates and thus potentially stronger wage growth than would otherwise be the case. The currently more favourable growth environment, which was reflected in the growth figure for the second quarter, is partly due to German fiscal stimulus and public investment, but also private investment in AI. Moreover, there was a sharp drop in energy prices in the second quarter after the temporary truce in the Middle East. Third, the ECB expects food price inflation to pick up, starting from a current lower level.
The ECB also indicated that no second-round effects of price increases are yet visible in, for example, its 'wage tracker' indicator. According to the ECB, there are no abnormal developments yet visible in pricing policy by companies or in wage negotiations.
The conclusion is therefore that the September rate hike was obvious. In the words of ECB President Lagarde and chief economist Lane, this was a "robust decision." During Lagarde’s press conference, market expectations became somewhat more restrictive, moving from two to three additional rate hikes priced in (implying a deposit rate peak of 3.25%). This trend has continued in recent days in a highly uncertain geopolitical context, especially after the recent escalation in Yemen and the threats to shipping off the Bab-el-Mandeb Strait.
Two additional rate hikes by the ECB therefore seem reasonable based on the currently available data. Our base case is therefore in line with this. As mentioned, however, there is a large and growing risk that two additional rate hikes by the ECB will not be enough to adequately address a longer-lasting inflation shock.
Fed also raises its policy rate
The Fed also raised its policy rate by 25 basis points to 3.875% on 16 September. Although this decision was a less straightforward matter than in the case of the ECB, it nevertheless made economic sense. Indeed, the US labour market remains resilient, giving the Fed room to focus on the second pillar of its policy mandate, price stability. In August, headline CPI inflation remained unchanged at 3.4% year-on-year. Though the Fed's preferred inflation measure is the (core) PCE price index, 3.4% CPI inflation is still well above the Fed's 2% target. Underlying core CPI inflation also remained stubbornly high, falling only 0.1 percentage points to 2.4% in August.
Taking into account the Fed's dual policy mandate, the September rate hike was therefore economically consistent, with more hikes likely to come. We expect at least one more 25 basis point hike by the end of 2026, which would bring the peak of the policy rate to 4.125%.
Nevertheless, the risks are also high in the US. More persistent-than-expected high inflation could force the Fed to raise rates (at least once more) to 4.375% in early 2027. However, the current uncertainty surrounding such estimates is exceptionally high.
Steeper yield curve via higher bond yields does some of the tightening work for central banks
When estimating the number of additional rate hikes by both the ECB and the Fed, we should also take into account the fact that the recent sharp steepening of yield curves via rising long-term real interest rates is already causing financial conditions in both the euro area and the US to tighten.
After all, the higher nominal ten-year German bond yields are the result of several factors. First of all, it reflects a higher inflation expectation that is mainly driven by the energy price shock. But that only explains part of the increase, as real bond yields are also rising sharply. This in turn partly reflects an upward revision of market expectations regarding policy interest rate paths, but above all a higher risk premium (term premium). In turn, this higher risk premium is likely to be partly related to higher inflation uncertainty (i.e. the future higher variability of inflation due to more frequent supply shocks), but also to fiscal risks, not only in the euro area, but also outside it, such as in the US.
Since global long-term interest rates (and especially their inherent term premia prices) are highly correlated, European bond yields are also rising due to what is happening in the US and Japan in terms of public finance and politics. Part of the recent interest rate development is therefore an exogenous tightening of financial conditions from a European perspective, which could mean that the ECB would have to tighten less than would otherwise be necessary.
For the Fed, the curve steepening is a lot more sensitive under the hypothesis that the jump in ten-year US yields is largely due to a higher risk premium from unorthodox and, in the long run, unsustainable fiscal policy. If this trend continues, it could increasingly lead to a conflict between fiscal and monetary policy. The worst possible outcome of this would be a deterioration of the Fed's independence and credibility.
Intra-EMU spreads again under upward pressure
Intra-EMU spreads have recently faced upward pressure again. Two main reasons for this are the energy price shock and a number of country-specific political risks. The geopolitical escalation in the Middle East has a direct effect on countries, and their interest rate spreads, which are highly dependent on the Middle East for their energy imports. Italy is an example of this. A more general indirect effect manifests itself through the negative impact on economic growth and public finances. As a result, for the rest of 2026 to much of 2027, we have become (temporarily) more pessimistic about the overall level of yield spreads in the euro area relative to German bond yields.
Secondly, there is the political risk. The French presidential elections in the second quarter of 2027 are particularly striking. The uncertain political consequences are likely to widen the French yield spread in the first quarter. In the end, a pragmatic political solution will probably emerge, after which that spread may decline again fairly quickly. Nevertheless, countries which traditionally have close economic ties with France, such as Belgium, could face spillovers from possible French turmoil due to the fragility of their own public finances.
All historical prices, statistics and charts are up to date as at 18 September 2026, unless otherwise stated. The positions and forecasts provided are those as at 18 September 2026.