
Traffic jams grow with economy


Belgium has been among the European congestion champions for some time. Traffic jams are particularly heavy in and around Antwerp. Busier car traffic is usually an inevitable consequence of increasing economic activity. In this way, road congestion could be seen as an indicator of positive economic dynamics. But if traffic jams become structural, the relationship between economic activity and mobility is in danger of becoming increasingly manifest in the opposite, negative sense. In other words, traffic congestion then puts a brake on growth potential.
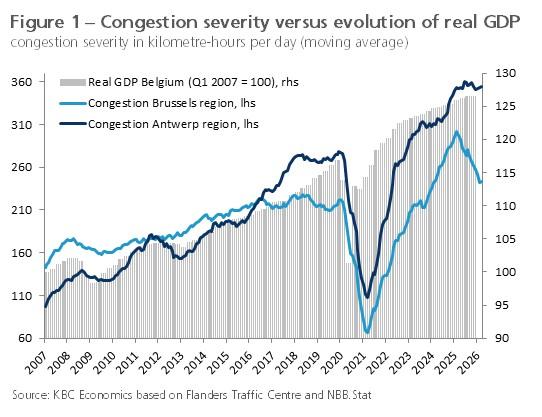
According to the Global Traffic Scoreboard by the consultancy INRIX, Belgium has been one of the most congested countries in Europe for years in a row. The situation is most worrying in the two most economically important cities, Brussels and Antwerp. The so-called 'congestion pressure or severity' is usually calculated by multiplying the length of traffic jams (the number of kilometres of traffic jams) by the length of time the traffic jam has been there. Figure 1 shows that this indicator (expressed in kilometre-hours per day) has been trending upwards in the Brussels region and, more so, in the Antwerp region. Specifically, congestion severity in Brussels at the beginning of 2026 was 1.7 times higher than at the beginning of 2007, in Antwerp it was even 3.6 times higher.
Traffic movements depend on many factors. In the long term, these are the development of the number of +18-year-olds (the potential drivers) and the number of vehicles in circulation. Whether those travel many kilometres is then determined by factors such as location policies for residential, work, shopping and leisure areas, the availability of alternative modes of transport, social trends including teleworking, fuel prices, car taxation,.... Whether the desired movements do lead to traffic jams, also depends on the size and quality of the road network.
Business cycle as a determinant
In the short term, traffic dynamics are related to the course of economic activity. This correlation plays out at several levels. Economic growth (i.e. an increase in real GDP) implies more commuting traffic as additional jobs are created, more goods transport, more shopping traffic,.... In a small open economy like Belgium, economic growth also increases the presence of foreign vehicles. Belgium is located at one of the busiest logistics hubs in Europe with multiple ports and an important petrochemical cluster. Finally, during a favourable business cycle, when public confidence peaks, more new cars are bought. Then, with more cars in circulation, traffic flows also increase further.
Specifically, there is a positive relationship between annual GDP growth and the annual change in distances travelled in road traffic (see figure 2). It is notable that during periods of recession or low economic growth, traffic flows have usually continued to rise. This was true during the oil shocks in the 1970s and during the wave of speculation against the Belgian franc during the EMS crisis in 1993. Until the early 1990s, growth in distances travelled was usually higher than real GDP growth. This is because mobility policy at the time focused on the smooth handling of car traffic (cf. the construction of motorways and ring roads) as well as by a land-use planning characterised by dispersed residential building. This encouraged car ownership and use. Moreover, from the 1970s onwards, car ownership further increased under the impetus of greater female labour participation. The car became commonplace: more and more young people bought one and older people stayed mobile for longer.
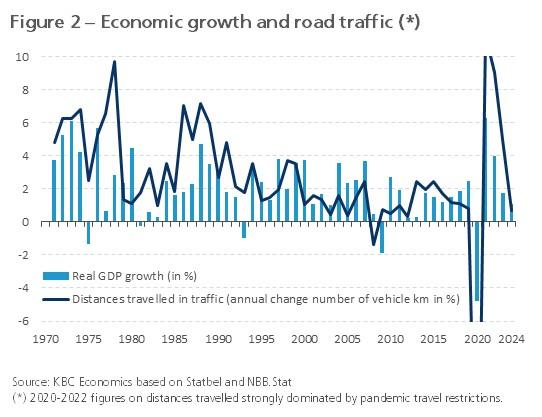
During the period 1970-2024, there were two economically difficult years when traffic intensity (i.e. total kilometres travelled) effectively declined: in 2008 (-1.3%) due to the severe financial crisis and in 2020 (-21.5%) due to the corona pandemic. During the financial crisis, and the Great Recession that followed it in 2009, employment held up well overall, so traffic flows were not particularly hard hit then either. During the pandemic, the number of kilometres travelled did decline sharply, due to the major restrictions on travel (the vertical axis in figure 2 was cut off at -6% but the decline was -21.5% in 2020). A recovery followed afterwards, in line with the economic recovery, but it took until 2024 to return to the same volume of traffic as before the corona crisis. The pandemic structurally increased teleworking. This lowered the number of commuting trips, but figures from the Planning Bureau and the FPS Mobility and Transport show more driving for other reasons. In particular, the number of trips for shopping or leisure activities is now higher, although these tend to be shorter, local trips outside the morning and evening rush hours.
It is notable that although the number of kilometres travelled did not return to 2019 levels until 2024, congestion severity continued to increase solidly after the pandemic (see figure 1). Part of the explanation is that in recent years we were more stuck in traffic jams due to road works (including the construction of the Oosterweel link in Antwerp and the works on the Vilvoorde viaduct), wet weather (especially during autumn 2023 and spring 2024) and accidents (data from the Agency for Roads and Traffic). Surely, the development of economic activity also plays a role. Figure 1 shows that especially in and around Antwerp, congestion severity is in line with the increase in Belgian GDP. Unlike Antwerp, which is a hub of industrial activity and logistics, Brussels is more a region with a lot of service activity, where teleworking, flexible departure and working hours and the use of public transport are easier. In fact, in 2025, congestion severity in Brussels fell considerably.
Inverse relationship
Further growth in economic activity will undoubtedly be accompanied by further traffic growth. However, the extent to which this will be the case remains uncertain. According to the Federal Planning Bureau's transport forecasts, made in 2022, due to the saturation of demand for passenger transport (a consequence of teleworking and the changing age structure of the population), the number of kilometres travelled for passenger transport would only increase further to a limited extent, while that for freight transport would increase more strongly. Total vehicle kilometres travelled in road transport would increase from 114.5 billion in 2019 to 121.3 billion in 2030 and 123.6 billion in 2040.
As this exacerbates the already problematic traffic congestion, the relationship between economic activity and mobility is likely to increasingly manifest itself in the opposite, negative direction. In other words, increasing congestion will weigh more heavily on Belgium's potential growth. It jeopardises Belgium's image as an attractive investment country and companies in urban agglomerations will find it increasingly difficult to attract competent personnel. This makes problematic mobility a serious competitive handicap for the Belgian economy. FEBIAC and the FEB developed a tool several years ago (Belgian Mobility Dashboard) to calculate congestion costs, based on the hours lost in traffic jams, the cost of extra fuel consumption and extra emissions. The estimated costs rose from 4.5 billion euros in 2021 to above 5.7 billion in 2025 (that is 0.9% of GDP or about 450 euros per citizen).
The mobility issue is complex, not least because solutions may involve unwanted side effects. For instance, the necessary modernisation and expansion of road infrastructure offer short-term relief. But in the long run, they create a suck-up effect of traffic if this approach is not combined with other solutions. Although the car will continue to dominate mobility (because it is often the only truly workable solution), more mobility creativity will be needed. Betting on flexible mobility solutions, choosing which means of transport fits best at any given time of the day or even in life, will become increasingly important. This also calls for 'multimodality' (e.g. more use of shared cars and bicycles, a better offer of public transport, the realisation of multimodal interchanges where one can leave the car behind and easily switch to another means of transport). Smart mobility concepts and services can help provide a solution here.