

Economic Perspectives June 2026
Read the full publication below or click here to open the PDF.
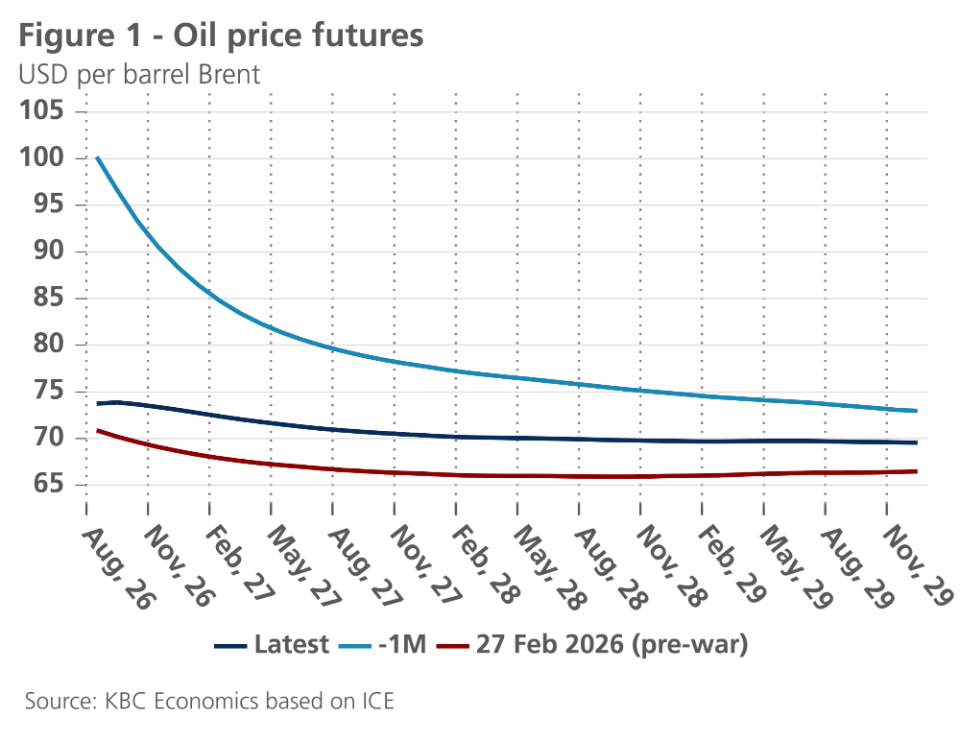
- The memorandum of understanding between the US and Iran caused relief in energy markets. As of Monday 22 June, oil and natural gas prices dropped to 78 USD per barrel and 42 EUR per MWh respectively. Futures markets expect prices to drop to 73 USD per barrel and 33 EUR per MWh respectively by end of 2027. This is in line with our base scenario, which assumes that traffic through the Strait will normalise and that no other long closures of the Strait will occur over our forecasting horizon. Risks to energy prices remain, however, tilted to the upside, as many details still have to be worked out to come to a permanent peace deal.
- Euro area inflation accelerated from 3% to 3.2% in May. The increase can fully be attributed to core inflation strengthening from 2.2% to 2.4%, as both goods and services inflation increased. Within the latter, transport services and package holidays accelerated notably. Non-core components were softer as energy inflation remained unchanged, while food inflation declined. Given the recent decline in energy prices, we downgrade both our 2026 and 2027 inflation forecast by 0.2 percentage points to 2.6% and 1.8%, respectively.
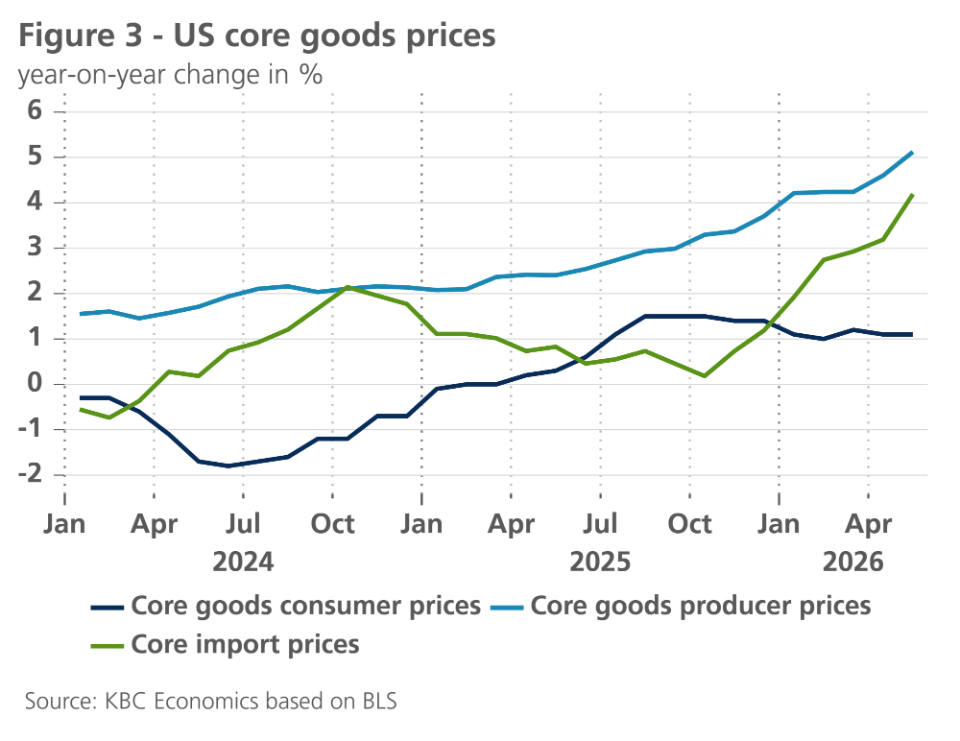
- Higher gasoline prices have pushed US inflation to 4.2% in May (up from 3.8% in April). Other components came in softer than expected, however. Food prices grew at a modest pace while core goods prices declined. This decline could be temporary, however, as core goods producer prices and core import prices accelerated in recent months. Services increased at a modest pace, thanks in part to a drop in vehicle insurance prices. Given the decline in oil prices, we downgrade our 2026 inflation forecast from 3.6% to 3.5%, while maintaining our 2.7% 2027 forecast.
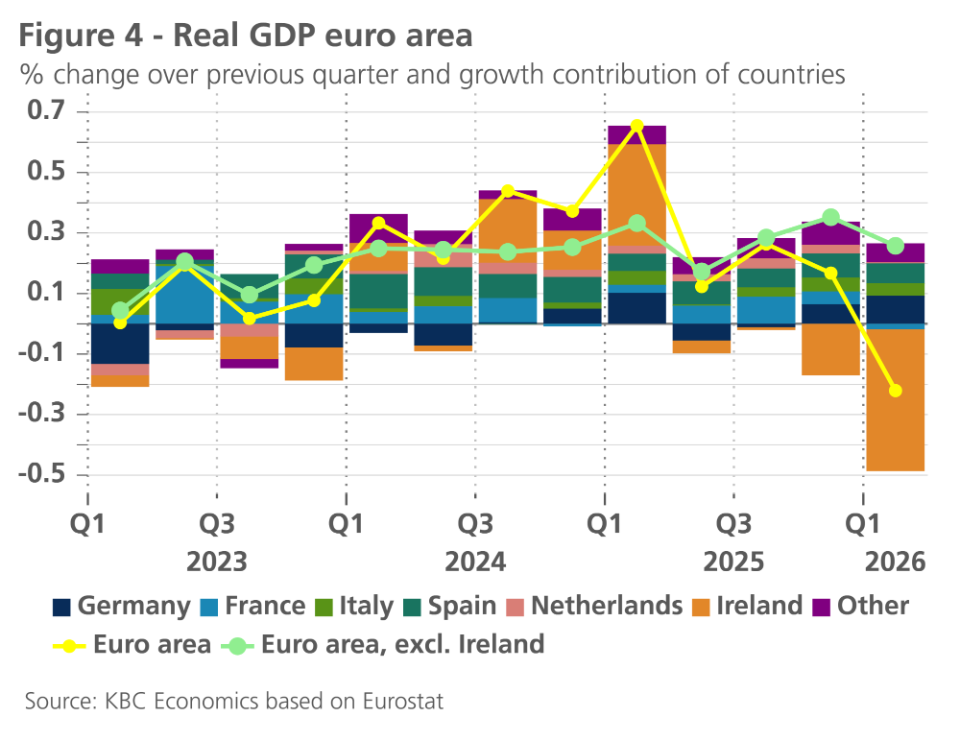
- The euro area real GDP figure for Q1 was unexpectedly revised downward from an expansion of 0.1% to a contraction of 0.2% quarter-on-quarter. This revision largely resulted from a strong negative correction in the Irish Q1 GDP growth figure. The latter was almost entirely driven by a slump in the Irish multinational-dominated industrial and pharma sectors, as proven by the continued growth in the underlying domestic activity in Ireland. Excluding Ireland, growth in the euro area would have been 0.3% quarter-on-quarter. The Spanish economy continues to overperform, while the French economy contracted. Germany posted decent growth, mostly because of (likely exceptional) strong net exports. Sentiment indicators for the euro area continue to point to growth weakness. We thus downgrade our 2026 growth outlook from 0.7% to 0.3% in 2026 and from 1.2% to 1.0% in 2027.
- The US economy remains in solid shape. Though Q1 growth was slightly revised downwards, hard data point to strong growth in Q2. Retail sales grow at a rapid pace, as do non-residential investments. The labour market is also in good shape as non-farm payrolls rose by 172k in May, while the unemployment rate remains low. Confidence indicators also point to strong growth in the coming quarters. Given these positive developments, we upgrade both our 2026 and 2027 growth forecasts by 0.1 percentage points to 2.1% and 2% respectively.
- The Chinese economy is likely to have decelerated in the second quarter given weak retail trade and investment data in April and May, though exports may still provide some offsetting strength. We downgrade our forecast for 2026 average GDP from 4.7% to 4.6% while keeping 2027 unchanged at 4.1%.
- The energy shock presents a challenge to central banks. In response, the ECB hiked its policy rates in June by 25 basis points. However, given the recent declines in oil and gas prices, we expect this rate hike to be a one-off. Risks are tilted to the upside, however. If hostilities in the Middle East were to resume, further rate hikes are likely to occur. In contrast to the ECB, the Fed hasn’t hiked rates yet this year. Given strong economic growth and above-target inflation, we expect one rate hike next quarter.
Iran ceasefire causes drop in energy prices
Last week, the US and Iran signed a memorandum of understanding, lasting 60 days. Among other elements, the memorandum includes a reopening of the Strait of Hormuz and an end to the US blockade of Iranian shipments. This negotiated outcome is in line with our base scenario, though the closure of the Strait lasted longer than we initially anticipated. Our base scenario assumes however that traffic through the Strait will normalise and that no other long closures of the Strait will occur over our forecast horizon.
Oil prices tumbled as the memorandum was announced, dropping to 78 USD per barrel (as of Monday 22 June), down from 113 USD per barrel end-April. Futures prices point to further declines, with prices declining gradually to 73 USD per barrel by end-2027 (see figure 1). That said, these futures prices remain well above levels seen prior to the war, for a multitude of reasons. First, though the damage to oil infrastructure has been limited, it will take time for production to restart, the Strait to be demined and for ships to return to the Strait. Second, inventories and reserves have been depleted and will need to be replenished. In May alone, global observed inventories declined by 143 million barrels. Finally, Iran retains the capability to close the Strait at any given moment (as illustrated by its reaction to the escalation of hostilities in Lebanon). A permanent risk premium thus remains embedded in oil prices.
Some of the consequences of the war will put downward pressure on prices, however. The war has weakened the OPEC+ cartel, as the UAE left the cartel. This will limit OPEC+’s ability to curtail supply. Furthermore, the war has also dampened demand. Global oil demand is expected to decline by 1.1 million barrels per day this year, due to a.o. lower air traffic and lower LPG and naphtha demand. The war might also have caused some permanent demand destruction, as EV sales jumped thanks to the higher oil prices.
Gas prices also declined notably. As of Monday 22 June, prices reached 42 EUR per MWh, down from their peak of 62 EUR per MWh in March. Prices remain well above levels seen in the beginning of this year (30 EUR per MWh). This is partly because heatwaves have dramatically increased demand for air-conditioning in recent weeks. Furthermore, EU gas storage levels are at historical lows (46% of total capacity) and will need to be replenished rapidly over the summer and fall.
Higher inflation in the euro area
Inflation in the euro area rose further in May to 3.2% year-on-year (see figure 2). Compared with the acceleration from 1.9% in February to 3.0% in April, the increase was significantly smaller. It was mainly driven by the rise in core inflation from 2.2% to 2.6%. Energy price inflation remained stable at 10.8%, whilst food price inflation fell from 2.4% to 1.9%.
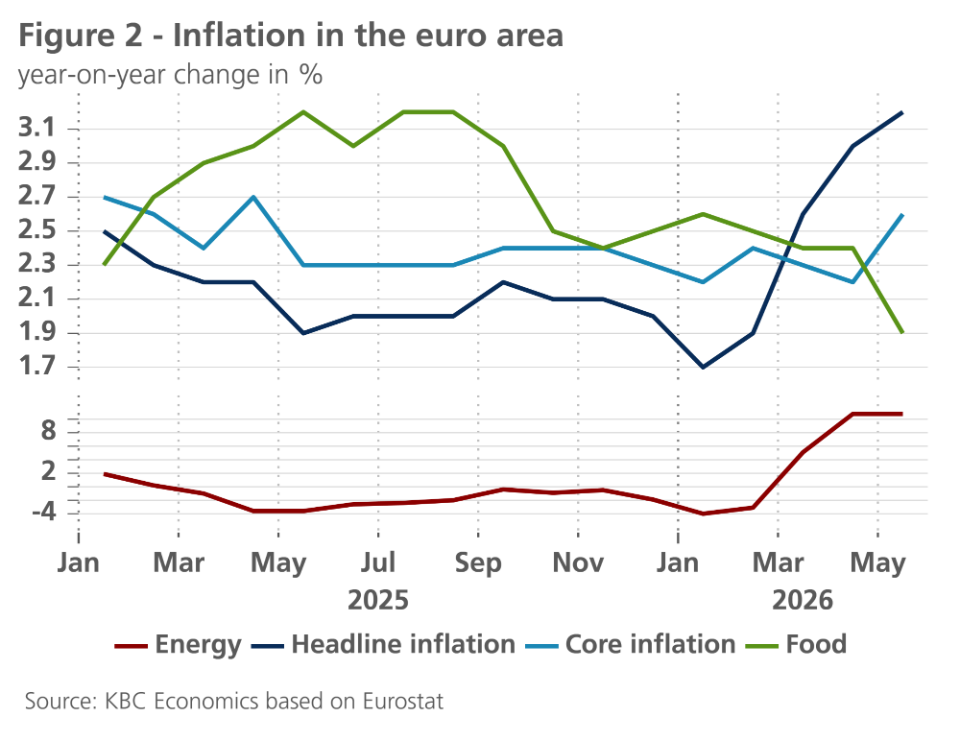
The levelling off of energy price inflation is in line with the stabilisation and slight correction in the price of crude oil and natural gas on the energy markets in mid-May. The downward correction in those prices following the agreement between the US and Iran will cause energy price inflation to fall in the coming months and is likely to bring it back into negative territory in the spring of 2027.
In the meantime, the indirect price effects of the recent surge in energy prices will continue to exert limited upward pressure on core inflation. In May, this was particularly noticeable in services inflation, especially transport services and package holidays. In addition, the rate of price increases for software is also accelerating, likely in the wake of the AI boom.
We expect, however, that the indirect price pressure resulting from the rise in energy prices will remain fairly limited and will not, or hardly, be exacerbated by second-round effects, partly because the surge in energy prices is likely to remain temporary and – compared with the previous energy shock – more limited. The resilience of the labour market will also be a decisive factor in this regard. The historically low unemployment rate points to a structurally tight labour market, in which wage pressure can rise rapidly. However, the low unemployment rate is also the result of labour hoarding – the practice of retaining staff when economic activity slows down. This puts a strain on companies’ financial breathing space. Together with other signs of some cyclical weakening in the labour market, this is likely to prevent excessively sharp wage rises and thus help to limit second-round effects.
We have therefore raised our forecasts for core inflation only slightly (from an average of 2.4% to 2.6% in 2026 and from 2.3% to 2.4% in 2027). However, as we now estimate expected energy price inflation to be lower than a month ago, our forecast for headline inflation has fallen from an average of 2.8% to 2.6% in 2026 and from 2.0% to 1.8% for 2027.
US inflation above 4%
US inflation accelerated again in May, reaching 4.2% year-on-year (up from 3.8% in April). Rising gasoline prices were again the main driving factor, as energy prices rose by 3.9% last month. In contrast, food prices remain well-behaved. The same can be said of core inflation. Core inflation reached 2.8% year-on-year in May. On a monthly basis, core inflation was only 0.2% month-on-month.
Within core components, goods prices dropped slightly on a monthly basis, thanks to declines in a.o. furniture, new vehicles and pharmaceutical prices. This weakness in goods inflation is likely to be temporary, however. Forward-looking indicators for used cars and trucks point to higher vehicle prices ahead. Furthermore, recent rises in core goods producer prices and import prices point to higher core goods consumer prices in the months to come (see figure 3).
Core services prices also increased relatively mildly by 0.3% last month. Within services, shelter prices rose by 0.3% last month, somewhat firmer than anticipated given softness in forward-looking indicators in this category. Services excl. shelter also increased by 0.3%. This modest figure can partly be explained by a sharp drop in vehicle insurance prices. Looking ahead, services inflation is likely to moderate as average hourly earnings are growing at a modest pace (3.4% year-on-year) and recent rapid rise in airline fares could revert, in the wake of the recent declines in oil prices.
Given the decline in core goods prices and lower oil prices, we downgrade our 2026 inflation forecast from 3.6% to 3.5%, while maintaining our 2.7% 2027 forecast.
Surprising contraction in the euro area economy
According to Eurostat’s latest estimate, real GDP in the euro area in the first quarter of 2026 was 0.2% lower than in the previous three-month period. The preliminary estimate had indicated slight growth of 0.1%. This surprising revision was mainly due to the much sharper contraction in Irish GDP growth (-12.1%), a figure that is always heavily influenced by the activities and accounting decisions of foreign multinationals. The Irish growth slump in Q1 is attributed to weakness in the multinational-dominated industrial and pharma sectors, as proven by the continued growth in the underlying domestic activity in Ireland. Excluding Ireland, growth would still have been almost 0.3% (see figure 4).
As in previous quarters, the Spanish economy was a key driver of growth in the euro area. In the first months of 2026, Italy also made a significant contribution. France, however, fell short, recording a slight contraction.
The most notable development, however, appears to be Germany’s increasing contribution to growth. Against the backdrop of Germany’s long-standing economic malaise, this appears encouraging at first glance. However, the relatively robust growth in the first quarter (+0.3% quarter-on-quarter) is mainly the result of strikingly strong export growth, which is likely to have been driven also by a number of rather incidental factors. For instance, the strong growth in exports to the US likely reflected some normalisation after earlier losses resulting from President Trump’s erratic tariff policy. More generally, the strong export growth was likely a correction following the decline in the previous quarter. It is also possible that fears of disruption to trade flows following the outbreak of war in the Middle East provided a precautionary boost to exports. It is certainly striking that the substantial growth in exports was accompanied by a sharp drawdown in inventories. The trend in domestic demand in Germany was far less encouraging. Growth in private consumption almost came to a standstill, whilst gross fixed capital formation declined. Only public consumption made a modest positive contribution to growth.
The latter illustrates that the easing of fiscal policy in Germany is not only – as intended – stimulating investment expenditure, but also public consumption. Meanwhile, the German government continues to struggle with the implementation of its economic reform agenda. Parliamentary approval of government decisions is dragging on, and new government decisions are proving difficult to reach. The economic impetus from the paradigm shift in fiscal policy – for which high expectations had been raised when the Merz government took office just over a year ago – is therefore likely to materialise somewhat later and with less vigour than initially anticipated.
Following the sharp decline in April, indicators of consumer and business confidence in the euro area improved slightly in May. The provisional agreement between the US and Iran will enable a further improvement in confidence in the short term, but uncertainty will remain a key feature of the economic environment for some time to come. We therefore maintain our forecast of only very modest economic growth in the second and third quarters of 2026.
In summary, we are revising down our forecasts for average annual real GDP growth in the euro area from 0.7% to 0.3% for 2026 and from 1.2% to 1.0% for 2027. The downward revision for 2026 is almost entirely due to the negative growth figure in the first quarter and is therefore mostly ‘technical’ in nature. The downward revision for 2027 mainly reflects a less robust and delayed recovery in economic momentum in Germany, for which we are lowering the growth forecast from 0.7% to 0.6% for 2026 and from 1.4% to 0.9% for 2027.
The somewhat more cautious assessment of growth in the baseline scenario implies that the risks are spread somewhat more evenly. Numerous factors, such as a renewed escalation in the Middle East, trade conflicts, domestic political tensions and/or economic restructuring in the context of a weakening labour market, could cause growth to fall short of projections. However, it remains equally possible that a demand-led boost, following an unexpectedly strong recovery in confidence, could propel the euro area economy onto a higher-than-expected growth trajectory.
US economy remains strong
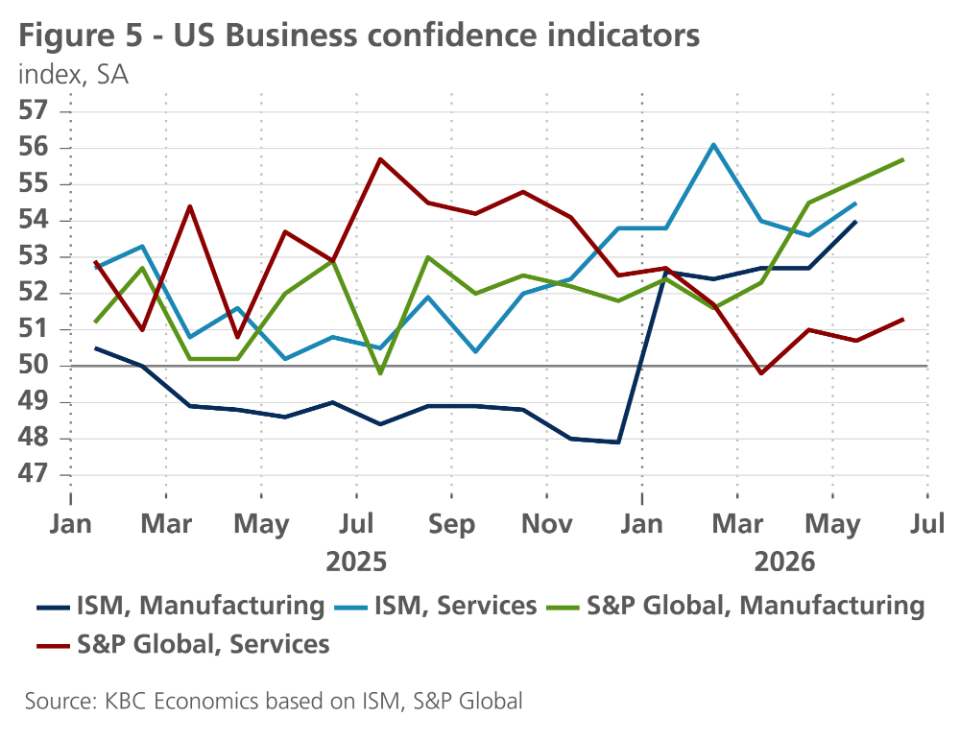
Despite facing severe headwinds (on trade, energy and migration), the US economy is growing at a solid pace. Though Q1 GDP was downgraded slightly from 0.5% to 0.4% quarter-on-quarter, hard data point to above-potential growth in Q2. Retail sales increased by a solid 0.9% last month, while the control group (which excludes volatile items) rose by a strong 0.7%. Higher gasoline prices thus have had a limited impact on consumer spending thus far. The strong increases in capital goods imports and durable goods orders also point to continued strength in non-residential investments. In contrast, residential investments continue to be a drag on growth as housing starts declined for the second month in a row. Meanwhile, sentiment indicators are recovering and indicate solid growth ahead, especially for the manufacturing sector (see figure 5). Within subcomponents of these indicators, the strong rise in the new orders component is especially encouraging.
The labour market is also showing strong momentum. Non-farm payrolls rose by 172k in May, the third strong payroll figure in a row. Non-farm payroll growth averaged 114k per month thus far this year, compared to 10k last year. The unemployment rate also remained unchanged last month at a low 4.3%, while the number of people working part-time for economic reasons declined. Job openings also jumped up remarkably last month, in large part because of a big increase in professional and business services.
Looking further ahead, we expect the momentum in non-residential investments to be maintained well into next year and expect a mild positive effect from the opening of the Strait of Hormuz. We thus upgrade both our 2026 and 2027 forecasts by 0.1 percentage point to 2.1% and 2% respectively.
China’s economy is weakening
After several months of economic resilience, certain cracks become visible once again in the Chinese economy. Retail sales declined for the third month in a row in May, marking the first contraction in year-on-year terms (-0.6%) since February 2023. The sluggish dynamics in retail trade reflect still weak domestic demand in China stemming from both structural and cyclical factors. The years-long downturn in the property sector continues, weighing on confidence and household wealth. Survey-based employment indicators point to ongoing weakness in the labour market. Consumer confidence, which had been steadily inching up for the past year from extremely depressed levels, declined again in March and April. Meanwhile, the recovery in investment, which contributed 1.9 ppts of China’s 5.0% year-on-year GDP growth in the first quarter, appears to have fizzled out, with fixed asset investment dropping 4.1% year-to-date compared to a year earlier. However, in April and May, exports grew 9.8% and 13.8% year-on-year, respectively, suggesting a solid contribution from exports to GDP growth in the second quarter. We therefore only marginally revise our outlook for Q2 GDP growth from 1.0% to 0.9% quarter-on-quarter. This leads to slightly weaker average GDP growth in 2026 of 4.6% rather than 4.7% but leaves the 2027 outlook unchanged at 4.1%. The outlook for annual average inflation remains unchanged at 1.2% in both 2026 and 2027.
ECB hikes in June
With the announcement of the ceasefire between the US and Iran, our core geopolitical assumption – that the war in Iran, and the associated closure of the Strait of Hormuz, would be temporary – has been borne out. However, the timing of this ceasefire is somewhat later than we had expected, which means that the direct and indirect impact of higher energy prices had more time to feed through into euro area inflation. Consequently, on 11 June, the ECB felt compelled to raise its policy rate by 25 basis points to 2.25%. This contrasted with our original assessment at the start of the war that the ECB could afford to ‘look through’ a relatively short and temporary supply shock.
ECB President Lagarde also indicated that, following the rate rise to 2.25%, the ECB now considers itself well-positioned once again to respond to further developments. Inflation risks remain on the upside. The higher expected inflation path is the result of higher energy prices feeding through to food, goods and services prices. According to the ECB, there is as yet no evidence of explicit so-called ‘second-round effects’ – whereby, for example, inflation expectations begin to influence wage-setting – until further notice.
To assess the robustness of the interest rate decision, the Eurosystem’s staff not only produced new projections for the baseline scenario but also updated the ‘adverse’ and ‘severe’ scenarios from March. In addition, a new ‘milder’ scenario was introduced. In all four scenarios, the ECB concluded that the interest rate rise was the correct ‘robust’ policy decision. Following the announcement (and subsequent signing) of the ceasefire, the futures curves for oil and gas prices now lie between the ECB’s assumptions for its baseline scenario and its mild scenario.
In all four scenarios considered, the ECB deemed a 25-basis-point interest rate rise to be the optimal policy choice. In that sense, it was therefore not merely a ‘precautionary measure’. Future policy decisions will depend largely on how medium-term inflation expectations evolve. In this context, Lagarde referred to the analytical framework she had proposed in March. In it, she stated that the ECB could look through a limited (and temporary) shock, respond to a larger shock that is not persistent with a well-calibrated policy adjustment, and respond forcefully to a significant and sustained deviation from the inflation target.
According to Lagarde, a 25-basis-point interest rate rise is not really a ‘forceful’ response, but it is the appropriate one. In the light of the forthcoming policy meetings, this suggests that, until further notice, the ECB is thinking in terms of a rather limited adjustment to its policy and does not wish to act too hastily for the time being.
On balance, the ECB faces the dilemma of weighing up the currently available data (particularly the absence of signs of second-round effects) against the need to keep one or more further interest rate rises on the table. The comments following the interest rate decision by ECB policymakers such as Nagel and Lane point in that direction. Based, amongst other things, on Lagarde’s statement that the ECB has found a new ‘good’ position, we conclude that, barring any new geopolitical events (such as a failure of the ceasefire) or new economic data (wider-ranging inflationary trends feeding into inflation expectations), the ECB is likely to keep its interest rate unchanged at 2.25% until further notice. This is more cautious than current money market expectations are pricing in, but these can change rapidly in the light of new developments, as the ceasefire (and the markets’ pricing in of a single interest rate rise) illustrated. In any case, the ECB’s future interest rate decisions will be more data-dependent than ever.
The Fed under new Chair Warsh
The Fed kept its policy rate unchanged at 3.625% in June. The first press conference by the new Fed Chairman, Warsh, provided some indications as to the Fed’s future approach. First and foremost, the introductory press release was particularly brief, offering only limited economic commentary. Coupled with the fact that Warsh did not deem it necessary to provide his own economic projections for the ‘dot plots’, this suggests that the Fed will provide significantly less ‘forward guidance’ in the future and will allow the markets to form their own assessments of economic developments and appropriate interest rate trends. From a theoretical point of view, there is a case to be made for this, and it would bring the Fed’s approach back to the one adopted prior to the Financial Crisis, which preceded the period of zero interest rates and the associated ‘forward guidance’.
Also noteworthy was the establishment of a number of task forces, including ones on interest rate policy, balance sheet policy and the handling of economic data. These task forces could produce their conclusions as early as the end of the year. However, the 2% inflation target as the definition of price stability is not up for debate, presumably so as not to jeopardise the anchoring of medium-term inflation expectations.
Despite the fact that Warsh is not in favour of ‘forward guidance’, policymakers released new economic projections in June containing three key messages. Firstly, the median projection for both core inflation and headline inflation (based on the PCE price index) for 2026 was revised sharply upwards (from 2.7% to 3.3%, and from 2.7% to 3.6%, respectively). This was no doubt a reflection of higher energy and food prices for US consumers, but more generally also of the fact that US economic growth remains strong (above potential growth) and is thus creating inflationary pressure against the backdrop of a robust labour market (in contrast to the economic situation in the euro area).
A second unexpected finding in the ‘dot plots’ was that, consistent with the demand-driven economic expansion, the median projection for the US policy rate suggested a 25-basis-point rate hike by the end of 2026. Over the course of 2027, the Fed expects inflation to cool significantly, meaning that, according to the median projection, the restrictive level of the policy rate could be lowered slightly once again.
A third interesting observation was that the median estimate of the long-term equilibrium policy rate remained unchanged at 3.1%. This is slightly lower than our current estimate of the neutral rate (3.375%). However, as the importance of ‘forward guidance’ for the Fed has diminished under the new chair, Warsh, we are inclined to place greater weight on our own estimate.
In concrete terms, this means that we expect the Fed to raise its policy rate by 25 basis points to 3.875% in the third quarter, and to maintain that level until early 2027. In the course of 2027, as inflation cools, there will then be scope for a single rate cut to 3.625%. That level is still slightly above our estimate of the neutral rate.
Weakened link between the US dollar and the oil price
Since the start of the war in Iran, the oil price has been a key determinant of the US dollar exchange rate. Whenever the oil price rose, the dollar strengthened, and vice versa. Following the announcement of the ceasefire, that link appears to have largely disappeared. The oil price fell sharply, but the dollar strengthened. The market currently seems to be focusing more on expected differences in growth and interest rates between the US and Europe. Furthermore, the recent movement in the dollar also suggests that the Fed’s first policy meeting under Chairman Warsh has bolstered market confidence in the independence of future Fed policy, resulting in a stronger dollar.
Bond yields affected by central banks
US and German ten-year bond yields have recently remained relatively stable on balance, at around 4.45% and 3%, respectively. Nevertheless, there was volatility, mainly driven by expectations regarding monetary policy. In particular, following the rather hawkish communication after the Fed’s policy meeting, the ten-year yield rose slightly. We expect the US ten-year yield to rise further, albeit modestly, to around 4.60% in the run-up to the expected interest rate hike in the third quarter. Thereafter, it will stabilise and, against the backdrop of inflation cooling once again and the policy rate falling once more, gradually decline to around 4.55% by the end of 2027.
Intra-EMU government bond spreads slightly higher
As a result of the recent slight fall in German interest rates, intra-EMU spreads have generally risen slightly. However, our medium-term outlook remains unchanged. Following a short-term downward correction caused by a renewed slight rise in German interest rates, we expect spreads to continue to fluctuate broadly within a flat range, with possibly some further slight downside potential. On a country-by-country basis, we still expect a temporary widening of the spread for France in early 2027 in the run-up to the presidential elections. For countries heavily dependent on the Middle East for their energy imports, the announcement of the ceasefire was good news. In particular, the Italian spread fell, although even these fundamentally explainable spread movements remain strikingly modest.
We remain of the view that the relative stability of spreads in the eurozone is structurally a consequence of the market’s confidence that the ECB can deploy all necessary measures should spread developments jeopardise financial stability and, consequently, the monetary policy transmission mechanism. Furthermore, should any disorderly and perceived-as-unjustified market speculation arise, the ECB has the Transmission Protection Instrument at its disposal.
All historical prices, statistics and charts are up to date as of 23 June 2026, unless otherwise stated. The positions and forecasts provided are those as at 23 June 2026.