

Economic Perspectives February 2026
Read the full publication below or click here to open the PDF.
- Geopolitical tensions and cold winter weather pushed up energy prices significantly in January. Oil prices rose by 14.6% to 69.7 USD per barrel last month. Geopolitical tensions (turmoil in Venezuela and Iran, tighter sanctions on Russia) were the primary reason for the increase. Colder winter in the Northern Hemisphere also caused supply disruptions. Colder weather also pushed up prices for natural gas. TTF natural gas prices increased by 42.8% to 40.5 EUR per MWh last month as high gas demand rapidly depleted EU natural gas reserves.
- Euro area inflation declined from 2.0% to 1.7% in February. The decline was largely driven by a drop in energy inflation. In contrast, food inflation accelerated slightly. Core inflation also moderated from 2.3% to 2.2%. This was driven by an important deceleration in services inflation. Meanwhile goods inflation accelerated. Given the recent rise in oil and gas prices, we slightly increase our 2026 average headline inflation forecast from 1.7% to 1.8%, while maintaining our 1.9% 2027 forecast.
- Euro area growth exceeded expectations in Q4 2025 as real GDP grew 0.3% quarter-on-quarter. Spain and Portugal continued to overperform. Nonetheless, other large economies such as Germany, Italy and the Netherlands also posted decent growth figures. Only Ireland’s growth was negative. The labour market also remains in decent shape as the unemployment rate ticked down to 6.2%. Due to overhang effects from the higher-than-expected Q4 growth figure, we upgrade our 2026 forecast from 1.0% to 1.2% while maintaining our 1.4% forecast for 2027.
- US growth continues to be resilient in the face of the on-going trade war. Following a strong Q3 2025 real GDP growth figure, we expect another solid performance in Q4 2025 thanks to high consumer spending and non-residential investments. Net exports will likely also deliver a decent contribution, despite the recent rebound in the trade balance. We upgrade our 2026 growth forecast from 2.3% to 2.4% while maintaining our 1.9% forecast for 2027. US inflation is also past its peak and is expected to continue its decent. We maintain our 2.6% average headline inflation forecast for this year, easing to 2.4% next year.
- The outlook for the Chinese economy remains unchanged compared to last month. Signs of a two-speed economy persist, with solid external demand outpacing sluggish domestic demand. We expect annual average real GDP growth of 4.6% in 2026 and 4.2% in 2027.
- Both the Fed and the ECB kept rates unchanged at their last policy meetings. The Fed kept its policy rate on hold given strong US growth and above-target US inflation. Fed Chair Powell stressed data dependency for the next policy rate decisions. We only expect the rate cutting cycle to resume in H2, where the Fed (under the new Fed Chair Warsh) is expected to cut rates twice, bringing them to a neutral level. The ECB also kept policy rates unchanged this month and is expected to continue to hold rates steady in 2026 and 2027. It remains in a good place given slightly below-target inflation.
Global trade tensions continued to ease in recent weeks. In Davos, Donald Trump retracted his threat to impose a tariff on eight European countries. Furthermore, the US recently agreed to slash its tariff on goods coming from India from 50% to 18%. In return, India promised to halt its purchases of Russian oil. India also made a trade agreement with the EU recently, which will result in lower tariffs on a range of industrial goods.
This good trade news comes amidst global economic resilience. In the euro area, we upgraded our forecasts as the economy grew by 0.3% quarter-on-quarter in Q4. The labour market also remains in good shape. In the US, strong consumer spending and high non-residential investments are boosting growth. In China, exports continue to increase worldwide as lower exports to the US are offset by higher exports in other regions. Consumer confidence is also rebounding from very low levels. Along with stronger growth, global inflationary pressures increased last month as geopolitical turmoil and cold winter weather have pushed up energy prices.
Energy prices shoot up in January
Following months of gradual descent, oil prices rose significantly in January. They rose by 14.6% to 69.7 USD per barrel last month. The increase is largely driven by geopolitical events. In the beginning of the month, the US capture of Venezuelan president Nicolas Maduro drove up oil prices (as Venezuela produces around 1 million barrels per day). Yet more impactful were the tensions in Iran. There, large-scale protests erupted and were followed by a brutal crackdown by the current regime. In response, US president Donald Trump pledged to support the protesters. He threatened to attack Iran, if the regime refuses to make a deal with him. The threat seems credible, as the US recently moved the USS Abraham, an aircraft-carrier, along with other military platforms to the Gulf region. Further escalation would be problematic for oil markets. Iran produces 3.2 million barrels of crude oil per day and exports 1.8 million barrels per day. Furthermore, the conflict could also spread to the rest of Middle East and could hinder trade through the Strait of Hormuz. About 21 million barrels of oil (close to 20% of global consumption) are shipped through this passage every day.
On top of the tensions in Iran and Venezuela, Russia is facing tighter sanctions. On 21 January, the EU banned imports of products made in Russia. In February, the EU is set to approve another sanctions package which would bar EU insurers from insuring tankers carrying Russian oil. The US is also targeting Russia’s shadow fleet, seizing multiple ships since December. Furthermore, Ukraine has also attacked several Russian tankers since November. All this is weighing on Russian export capacity and is putting downward pressure on Urals crude prices.
On top of geopolitical events, cold weather in the Northern Hemisphere has pushed prices further upwards. This is especially the case in the US, where a major winter storm hit crude production and affected refineries on the U.S. Gulf Coast. 1.6 million barrels per day were knocked offline by 26 January as a result. Output is gradually recovering. Cold weather has also reduced output in Russia. Crude output in Kazakhstan was also diminished by a fire at the Tengiz oil field.
Cold weather across the Northern Hemisphere also pushed up natural gas prices last month, as cold winter weather is driving up demand for heating. As the winter weather was more severe in the US, the impact on natural gas prices was more important there. Indeed, the gap between US Henry Hub and European natural gas prices has narrowed substantially (see figure 1).
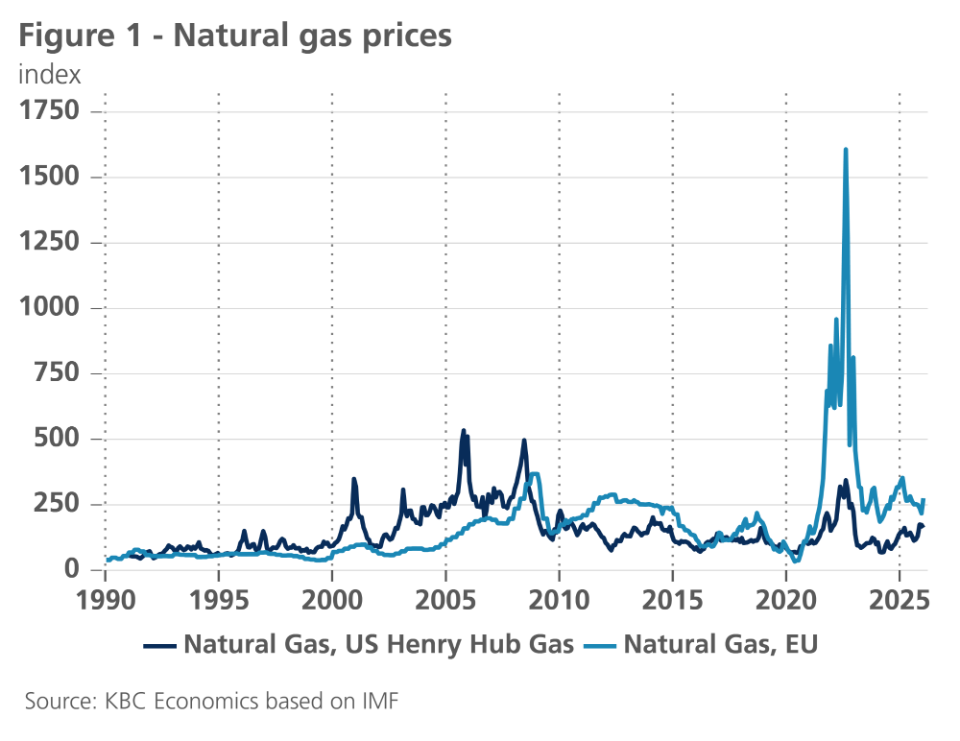
Nonetheless, Europe was also impacted as higher US demand reduced LNG exports from the US. Colder than usual Asian weather conditions also diverted US LNG shipments towards Asia. Furthermore, European demand also increased by the cold winter weather and an outage at a French nuclear power plant. All this pushed TTF natural gas prices up by 42.8% to 40.5 EUR per MWh.
Euro area GDP growth surprises positively again
According to the (preliminary) flash estimate of real GDP, economic growth in the euro area in the fourth quarter of 2025 was 0.3% compared to the previous quarter. This was more than expected and exceeded expectations in all major countries. Once again, the strongest growth was recorded in Spain (0.8%). Both private consumption and investment continued to expand at a robust pace. The Dutch economy also grew remarkably strongly (0.5%), with exports and government consumption being the main drivers of growth. In Germany and Italy, real GDP in the fourth quarter was 0.3% higher than in the previous quarter. No detailed information on the composition of growth is available for these countries yet, but comments from the relevant statistical offices suggest that domestic demand made an important contribution to growth. Destatis, the German statistical office, refers in particular to household and government consumption.
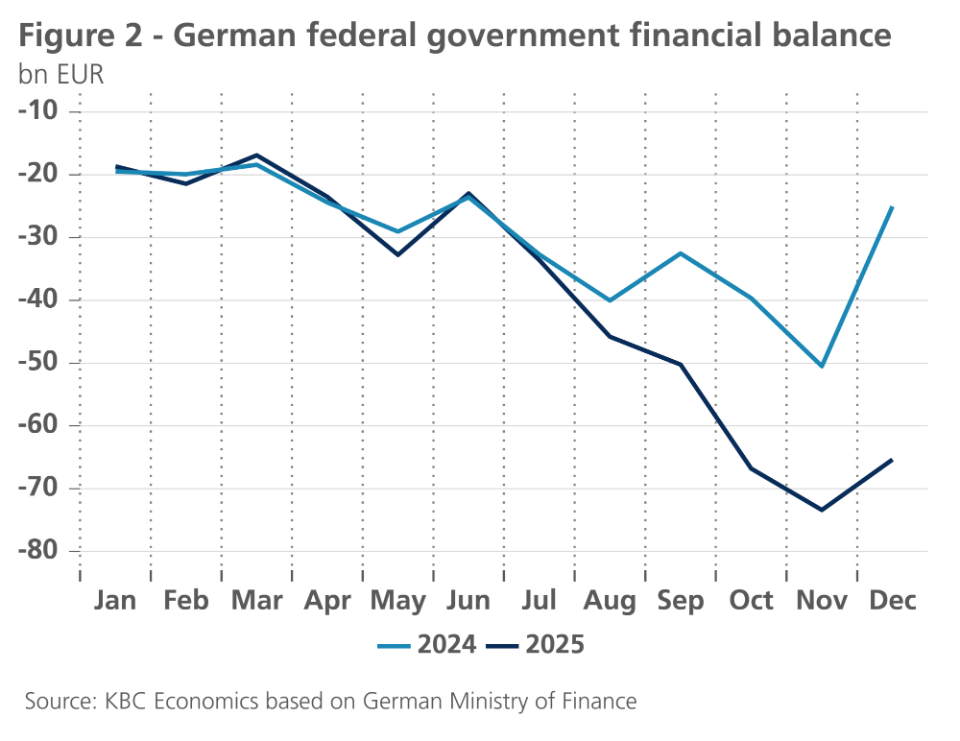
The latter is most likely due to the budgetary stimulus, which finally got off the ground in the fourth quarter. As the 2025 budget was not approved by the German parliament until September 2025, deficit financing, for which the substantial relaxation of the constitutional debt brake had already paved the way in March 2025, only began to increase at that point (see figure 2). In contrast to the two previous quarters, the German economy thus made a positive contribution to economic growth in the euro area once again (see figure 3).
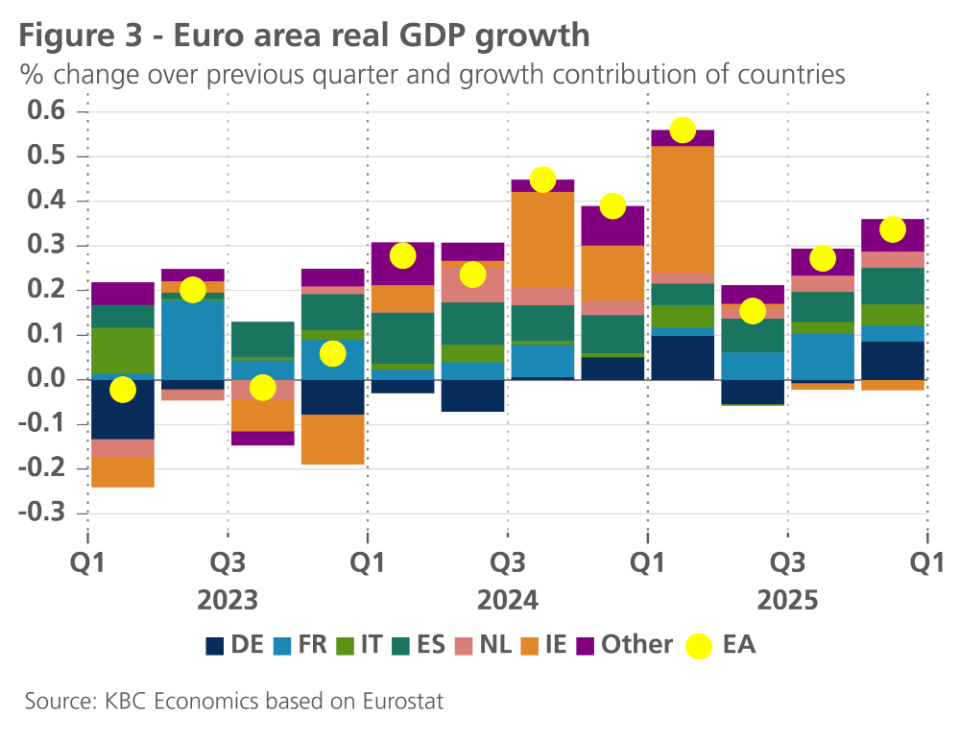
Of the larger countries, France made the smallest contribution to growth. The slight strengthening of growth in household consumption was insufficient to offset the lower contribution to growth from investment and public consumption. Real GDP growth therefore remained limited to 0.2%. Finally, it is striking that the Irish economy, which still made an exceptionally large positive contribution to growth in 2024 and early 2025, made a slightly negative contribution in the second half of 2025. Excluding Ireland, GDP growth in the euro area was 0.4% in the fourth quarter instead of 0.3%.
Meanwhile, confidence indicators at the start of the new year looked better than in the last month of the old year. The European Commission's surveys in particular recorded a significant improvement in business confidence. This was the case in all large(r) countries and in almost all sectors. The surveys of purchasing managers (PMI) painted a more nuanced picture, with improvements mainly in Germany and Spain, but notable weakening in France and Italy. Consumer confidence improved slightly but remained remarkably weak, while the unemployment rate returned to its historic low. Apparently, major (geo)political uncertainty and structural socio-economic challenges, including precarious public finances, continue to stand in the way of a stronger recovery in consumer confidence.
Even so, the tentative signs of stronger consumption growth and the launch of stimulus measures in Germany are encouraging for the expectation that economic growth in 2026 will receive more support from domestic demand. We are therefore maintaining our forecast of a gradual strengthening of quarter-on-quarter growth throughout the year. The stronger-than-expected growth in the last quarter of 2025, moreover, increases the carry-over effect from 2025 to 2026. As a result, we are raising the expected average growth rate for real GDP in the euro area by 0.2 percentage points to 1.2% in 2026. For 2027, we are maintaining 1.4% as the expected real GDP growth, while the growth estimate for 2025 is currently 1.5% instead of the previously projected 1.4%.
Inflation drops below 2% in the euro area
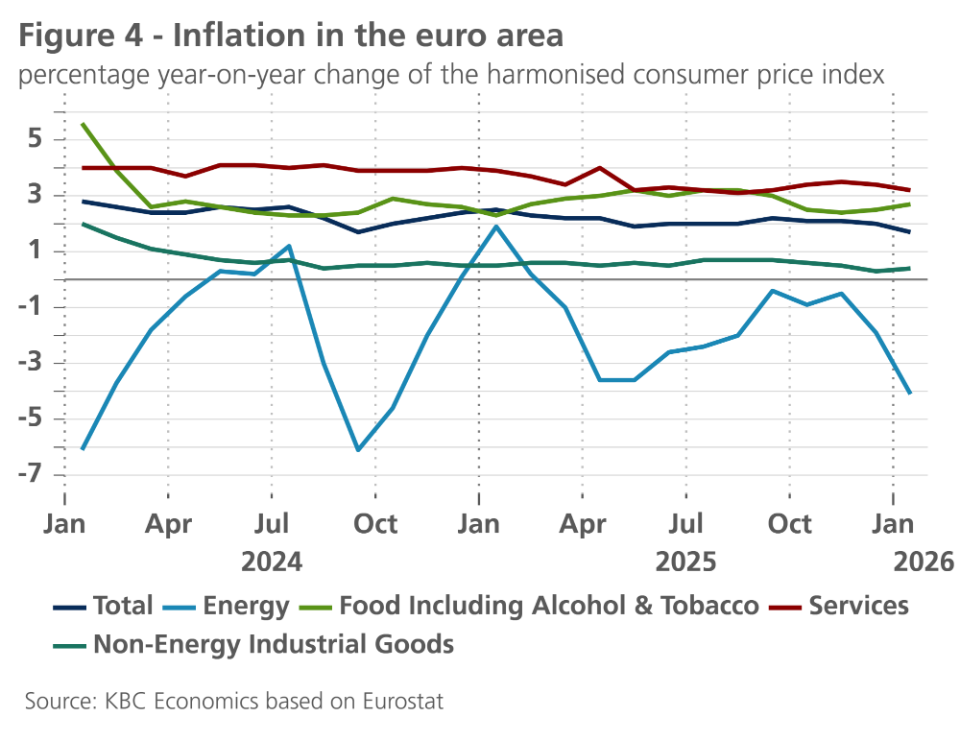
According to the flash estimate, inflation in the euro area fell from 2.0% in December to 1.7% in January. Despite the sharp rise in crude oil and natural gas prices in January, the sharp decline in energy price inflation (from -1.9% in December 2025 to -4.1% in January) was the main cause of the cooling of inflation (see figure 4). The decline in energy price inflation is caused by the higher energy prices in January 2025, which serve as the basis for comparison for inflation in January 2026. This base effect illustrates how the volatility of energy prices continues to cloud the picture of underlying inflation trends.
This trend is better reflected by the trend in core inflation, which excludes energy and food prices (food prices rose slightly to 2.7% in January). Core inflation cooled further from 2.4% in November and 2.3% in December to 2.2% in January. For the first time in several months, this was due to the decline in services inflation (whose weight in the total harmonised consumer price index increased from 45.9% to 46.7% in the annual update). Services inflation fell by 0.2 percentage points to 3.2%, while goods inflation (excluding energy products) rose slightly to 0.4%.
The decline in services inflation is reassuring. It was expected that the cooling of services inflation would be slower than that of goods inflation, but in 2025 it progressed even more slowly than expected. Its resumption confirms the expectation of further progress in the coming months. This will bring core inflation even closer to 2%. Total inflation may remain below 2% in the coming months, although recent price fluctuations on the energy markets make the trend in consumer prices even more uncertain than usual.
Consumer prices for energy are expected to remain lower than a year ago in the coming months, but to a lesser extent than was anticipated at the turn of the year. Energy price inflation will therefore make a smaller negative contribution to overall inflation than was expected until recently. We have therefore raised our forecast for the average inflation rate in 2026 slightly from 1.7% to 1.8%. For 2027, we maintain our forecast of average inflation of 1.9% in the euro area.
Consumer drives up US growth
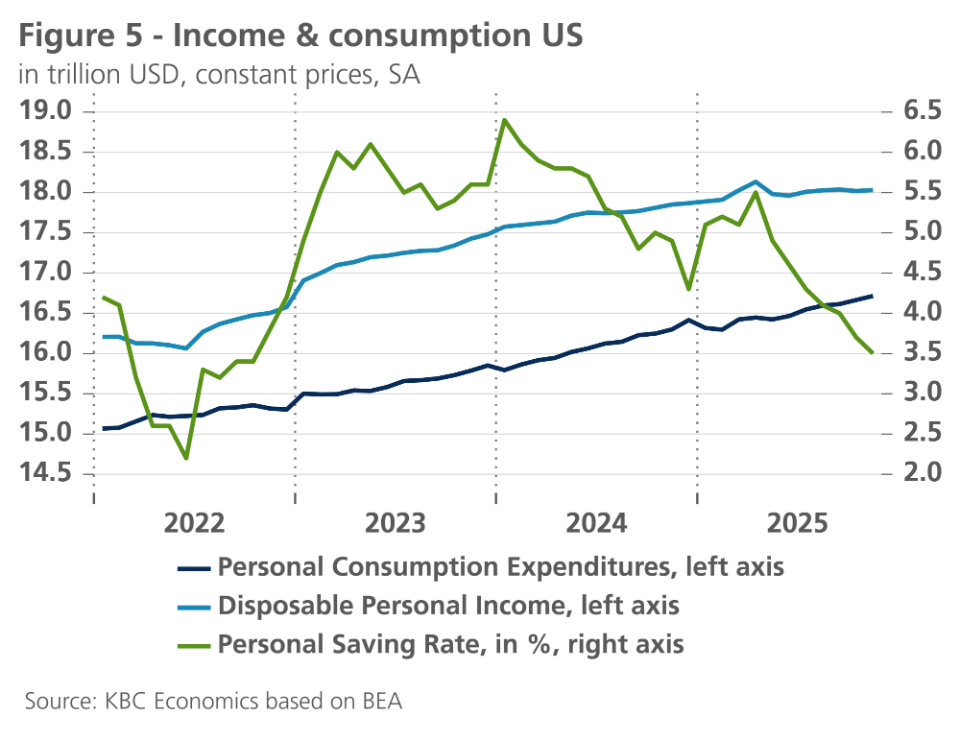
US economic growth remains very resilient. On top of the very strong 1.1% quarter-on-quarter growth in Q3, we now expect 0.7% quarter-on-quarter growth in Q4. This will primarily be driven by consumer spending. Despite the long Q4 government shutdown, real consumer spending increased by 0.3% in both October and November. An important caveat is that consumer confidence remains low and retail sales were flat in December. Furthermore, the slower increase in real disposable income has pushed the savings rate to unsustainable levels (see figure 5).
Non-residential investments are also set to make a decent contribution in Q4 and beyond as durable goods orders increased by 5.3% in October. This is partly driven by the on-going investments in data centers. Both shipments and new orders of computers (and related equipment) and communications equipment are growing at a very rapid pace. The contribution of net exports will be somewhat smaller than we anticipated last month, however. The trade deficit made a very large rebound in November, as both exports decreased and imports increased. Part of increase in imports can again be explained by the AI investment boom as there was a solid increase of imports of computers and semiconductors.
The labour market also showed resilience lately. Non-farm payrolls increased by 130k in January, despite a 42k decline in government jobs. Average weekly hours worked ticked up. The participation rate also ticked up, while the unemployment rate decreased from 4.4% to 4.3%. On top of the decrease in the unemployed, the number of people working part-time for economic reasons also declined. The only caveat is that job openings declined materially in December.
For this year, we still anticipate a slowdown in growth momentum as the effects of the trade war and the migration shock filter through. Given the low savings rate and consumer confidence, we expect softer consumer spending ahead. Nonetheless, continued high non-residential investment spending, along with looser fiscal policy are expected to keep quarter-on-quarter growth close to potential. Given our upgrade of Q4 2025 growth, overhang effects lead to an upgrade of our 2026 average real GDP forecast from 2.3% to 2.4%. We maintain our 1.9% forecast for 2027.
Inflation in the US has passed its peak. Consumer inflation expectations have come down substantially in the last month for both the year ahead and the 5 years ahead. Wage pressures are also declining, pointing to softer services inflation ahead. However, higher energy prices could provide some upward inflationary pressure. Nonetheless, we maintain our 2.6% forecast for 2026 and our 2.4% forecast for 2027.
China’s growth expected to drop below 5%
The outlook for the Chinese economy remains unchanged compared to last month. The Chinese statistical office’s practice of reporting combined January-February data currently leaves us with a dearth of fresh data. However, December data continued to point to a two-speed economy, with industrial production remaining strong (+0.49% month-on-month), supported by external demand, while retail sales remained sluggish (-0.12% month-on-month) on weak domestic demand. Business sentiment surveys are one of the few sources of data available for January. However, the official (National Bureau of Statistics of China) PMIs and the S&P PMIs paint a diverging picture of last month, with the NBS manufacturing and non-manufacturing PMIs both dropping below 50 (signaling contraction) and the S&P manufacturing and services PMIs both moving higher (to 50.3 and 52.3, respectively).
With clear directional data lacking, an important signal comes from the local government growth targets that have been set for 2026. With many local governments reportedly cutting those targets relative to 2025, this may be a signal that the central government will announce a lower growth target as well, likely in the range of 4.5-5%. This is in line with our outlook for 2026 average GDP growth of 4.6%. We then expect growth to slow to 4.2% in 2027.
Chinese inflation, meanwhile, remains low. Due to lower food and energy prices, CPI headline inflation fell from 0.8% to 0.2% year-over-year in January. The decline is likely to be temporary as the later date of the Lunar New Year is causing some temporary distortions. On a month-over-month basis, headline inflation was steady at 0.2% in January. Producer price inflation remains in deflation territory but contracted only 1.4% year-on-year versus a steeper decline of 1.9% in December. We expect headline inflation to average 0.8% in 2026 and 1.1% in 2027.
ECB and Fed keep interest rates unchanged
The ECB has for some time considered its monetary policy rate in a "good position" to adequately respond to future economic shocks. At its February policy meeting, it therefore kept its policy rate unchanged at 2%. The fall in headline inflation to 1.7% in January was in line with expectations. Euro area inflation will probably be below the ECB's 2% target during 2026, mainly due to year-on-year changes in energy prices. However, that will normally be a temporary phenomenon. The ECB did make clear that it is closely monitoring the euro exchange rate, as a euro appreciating too fast and too strongly could have a disinflationary impact on the euro area. However, according to the ECB, this is not yet the case. In addition, the ECB also referred to the disinflationary effect of increased cheap imports from China (trade diversion), due to trade tensions between the US and China. However, that disinflationary effect is not yet of a nature to prompt the ECB to cut its policy rate further.
So while there were no changes with respect to monetary policy itself, ECB president Lagarde did call for further steps in European integration to strengthen European economic-financial competitiveness. One notable plea was for the larger-scale issuance of common European bonds, e.g. for defence spending, to also promote the international role of the euro (see also our Economic Brief of 6 February 2026 on this subject).
The Fed also kept its policy rate unchanged in January. It too sees its policy rate as currently "well positioned". According to Fed chair Powell, both upside inflation risk and downside risk to the US labour market (the two parts of its policy mandate) have declined. As a result, the Fed is taking a wait-and-see and data-dependent stance. Nevertheless, the current level of the Fed fund rate, currently at 3.625%, is still above the 3% longer-run rate indicated by the FOMC in their latest December 'dot plots'. Consequently, we continue to expect the Fed to cut its policy rate further to a 'neutral' 3.125%. Given the somewhat more favourable risk framework for the Fed, we expect this to happen at a somewhat slower pace. This allows the Fed to wait for new macro-financial data. On balance, this results in our expectation of two more rate cuts of 25 basis points each, spread over the third and fourth quarters of 2026.
A crucial factor in this scenario is whether or not the Fed adjusts its median neutral rate forecast in its dot plots of March and/or June. We expect not. Nor do we assume that the nomination of Kevin Warsh as Powell's successor will lead to a fundamental change in Fed policy. After all, Warsh is a reputable economist, who also has only one vote on the Fed's rate setting FOMC. This is likely to ensure that US monetary policy will continue to be determined primarily according to economic-financial data.
Bond yields remain in upward channel
Both US and German 10-year bond yields rose slightly last month. This partly reflected the Fed's somewhat more wait-and-see stance in its easing cycle, but also the further upward normalisation of the German term premium. Indeed, with some delay, the German fiscal stimulus and the associated infrastructure and defence investments are gaining traction. A third factor was rising Japanese bond yields, which increased ahead of the snap parliamentary elections on 8 February. Indeed, the eventual winner of the elections, Prime Minister Takaichi of the Liberal Democratic Party, had made fiscally far-reaching election promises. In integrated global bond markets, this also had an upward impact on US and German yields.
For the US, we expect 10-year yields to gradually rise further to around 4.50% by the end of 2026. That level is close to what we consider a 'fair value'. For now, we do not assume that bond markets are pricing in a US-specific geopolitical risk premium on US bonds. Following the recent faster-than-expected catch-up of German 10-year yields, we assume that there is still limited upside potential during 2026, and that yields will stabilise around 3% from the second half of the year.
Against this background, we continue to assume a moderate depreciation of the dollar against the euro, mainly for the fundamental reason of overvaluation. However, the dollar exchange rate remains volatile due to further developments in the geopolitical environment.
Intra-EMU spreads decrease slightly further
EMU sovereign bond yield spreads versus Germany continue to narrow slightly. This is primarily due to the increased German benchmark yield. In addition, financial markets may also rely on an (implicit) bailout by European monetary and fiscal authorities in case of a debt problem in a specific member state. In the case of the ECB, there is explicitly the Transmission Protection Mechanism. There is no automatic procedure for any assistance by European fiscal authorities, but markets are probably rightly counting on the fact that Europe cannot afford another debt crisis in the current geopolitical context.
Consequently, we assume in our scenario that the further downward potential of spreads is limited, but that the current low level is sustainable. However, this does not mean that there cannot be temporary flare-ups, for instance due to political events. That was temporarily the case after the first round of the Portuguese presidential election, and it could also happen in the run-up to the French presidential election, scheduled for April 2027.
All historical prices, statistics, and charts are up to date as of February 9, 2026, unless otherwise stated. The positions and forecasts provided are those of February 9, 2026.