

Advanced and emerging market sustainability KBC Country Sustainability Barometer: update 2025


Content table:
Read the publication below or click here to open the PDF .
Abstract
Every year, KBC Economics updates its Sustainability Barometer for advanced and emerging markets. This Sustainability Barometer is used as an important input in the screening of countries for KBC Asset Management’s Responsible Investment Funds. The tool takes a wide range of sustainability indicators into account and allows us to rank country performances according to their overall score. In this research report we give an overview of the methodology and the results of the latest update (made end-2025). Since 2022, we consider both advanced and emerging economies together in the same model. Unsurprisingly, advanced economies tend to outperform. We continue to see that Switzerland and the Scandinavian countries (aside from Finland) occupy the first four places in the country ranking, while Finland has dropped from fifth to seventh place. Among emerging markets in the ranking, the Central and Eastern European countries also continue to perform well. Belgium has moved up several places from 17th to 12th out of 163 countries considered.
Sustainability forms an integral part of KBC Group’s general business strategy. The KBC Country Sustainability Barometer supports this strategy by providing a key input for the Responsible Investing (RI) funds offered by KBC Asset Management. Responsible investment in government bonds requires additional analysis, just as it does with equities and corporate bonds. This amounts to ‘country screening’ or, more specifically, analysis of the importance that national governments attach to sustainability and social responsibility in their policies. We begin this research report by sketching out what ‘sustainability of countries’ entails. We then look at the way in which countries can be analysed for sustainability. In doing so, we examine the yardstick that KBC Economics has developed for its Sustainability Barometer. We briefly discuss the screening methodology and the five themes used in the scoring model. Finally, we discuss the results of our most recent calculations (the 2025 update of the KBC Sustainability Barometer).
1. Sustainability of countries
Definition
There is no universal definition of what the ‘sustainability of countries’ precisely encompasses, which in turn reflects the fact that the objectives and tasks of governments are more multifaceted than those of businesses. Government policy should be focused overall on the sustainable promotion of general well-being – i.e., the well-being of as many citizens as possible. This is determined by a whole range of factors: material prosperity, health, personal development, justice, equal opportunities, liberties, absence of social and political tensions, security and so on. It is equally important that this well-being is not achieved at the expense of future generations, citizens of other countries, animal welfare or the environment. Consequently, aspects such as environmental sustainability and international peace must be explicitly taken into account.
Viewed in these terms, the sustainability of countries may be defined as ‘the totality of actions, institutions and policy interventions in a country that promote the well-being of its current and future population in a sustainable manner, without jeopardising the environment or the well-being of the population of other countries’.1However, fleshing out this definition in practice is subjective and not straightforward. In addition to the many relevant factors, subjectivity arises from conflicting views on the extent to which the government should intervene to achieve this sustainability. Opinions can range from a strong preference for far-reaching governmental correction of the potential excesses of profit maximisation by corporations (social exploitation, environmental neglect, etc.) to the opinion that, at the end of the day, free-market principles continue to offer the best guarantee of sustainable prosperity and progress (greater likelihood of personal initiative, full employment, etc.).
Methodology
Numerous yardsticks have been developed in recent decades to combine various sustainability factors into a single index. Broader measures primarily attempt to achieve a better indication of social well-being than traditional per-capita GDP. However, most alternative measures of well-being continue to correlate closely with per-capita GDP. This is not necessarily the case with benchmarks that take substantial account of ecological aspects, as countries with a high level of material prosperity may pay a price for it in terms of environmental pollution or depletion of natural resources.
Individual indices tend to provide an incomplete picture of what is meant by the sustainability of countries. It was for this reason that KBC decided to develop its own benchmark starting in 2002, which would approach the matter from as broad an angle as possible. The Sustainability Barometer was first calculated by KBC Asset Management (KBC Group’s fund manager) to serve as the basis for investment choices in its RI funds. It was developed in consultation with the macroeconomists in KBC’s research department and is now updated yearly by KBC Economics and continues to serve as an important input for those funds.
The scoring model generates a country ranking using a database that is updated annually with newly available information for the different indicators. It is a dynamic model that can be adjusted when necessary to take account of new sustainability trends. KBC is advised on the various sustainability aspects by a panel of independent experts (the RI Advisory Board). While it remains true that there is no universal definition of country sustainability, the seventeen UN Sustainable Development Goals (SDGs) provide a useful international benchmark. For this reason, we carried out an analysis in 2022 to determine to what extent the KBC Sustainability Barometer accounts for progress on these SDGs and added a few additional data points to fully encapsulate all aspects of the SDGs.
2. The KBC approach
The countries screened
Since 2022, the KBC Sustainability Barometer examines both advanced and emerging market economies together. We therefore start from a broad list of the 196 UN recognised countries and observer states. We impose a first requirement, however, that in order to be included in the calculation of the Sustainability Barometer, data must be available for at least 80% of the fifteen sub-indicators that make up the model (see below). Applying this rule means that we excluded thirty-three countries from this year’s Barometer, leaving a total of 163 countries in the analysis.
The themes and sub-indicators
The KBC model is divided into five themes: (1) General economic performance and stability; (2) Socio-economic development of the population; (3) Equality, freedom, and rights of the population; (4) Environmental performance and commitment; and (5) Peace, security, and international relations. Each theme is sub-divided in turn into three sub-indicators, which are in turn made up of one or more data points (see below). By considering a broad range of sustainability factors, we aim to avoid any tendency towards extremes. All data is sourced via Macrobond (a provider of macroeconomic data) from international institutions such as the United Nations, the IMF, and the World Bank, or other prominent organisations, which allows for better international comparison between many countries. The five main themes and their sub-indicators are laid out below, including a rough description and an explanation of their significance.
Theme 1 – General economic performance and stability
Good and stable macroeconomic performance is the bedrock of a society’s prosperity. Specifically, this means a satisfactory and stable economic growth rate and the absence of imbalances (sub-indicator 1.1). The latter implies the fullest possible utilisation of the labour force (low unemployment), the retention of monetary value (low inflation), and balance-of-payments and public-sector-budget equilibrium. The model measures average real GDP growth over the most recent five years as well as its volatility over that period. Regarding imbalances, we calculate the sum of the unemployment rate, inflation, the deficit on the balance-of-payments current account (as a percentage of GDP) and the public-sector deficit (as a percentage of GDP). Once again, the five-year average is taken into account.
In addition to the recent economic situation, we consider the future economic potential (sub-indicator 1.2) and the quality of institutions (sub-indicator 1.3). The first of these relates to technology and innovation, while the second concerns rule of law and governance, both of which are crucial to supporting market-oriented economic activity.
Theme 2 – Socio-economic development of the population
In addition to economic performance and stability, governments should focus on the socio-economic development of their citizens. The first indicator we consider in this regard is comprised of traditional development benchmarks: per capita GDP, poverty levels (population living below 50% of median income), life expectancy (number of years) and severe food insecurity (% of population as measured by the Food Insecurity Experience Scale) (sub-indicator 2.1). A second indicator measures achievements and policy efforts concerning citizens’ education and employment (sub-indicator 2.2). This is based on education levels and mean years of schooling for the population, employment relative to population (aged 15+) and youth unemployment.
The second theme also embraces the situation and policy efforts in public health (sub-indicator 2.3) as reflected in the number of people employed in the healthcare sector (doctors, dentists, pharmacists, and nurses; per 100,000 inhabitants), government spending on healthcare (as a percentage of GDP), the percentage of the population living in slums, and access to electricity.
Theme 3 – Equality, freedom and rights of the population
It is the task of government to limit inequality between citizens, but also to provide them with liberties and rights to enable their personal development and their ability to take initiatives. For sub-indicator 3.1, prevalence of inequality is measured by income inequality, specifically using the GINI coefficient and by a measure of gender inequality regarding reproductive health, empowerment and the labour market. In the case of political rights and civil liberties (sub-indicator 3.2), we draw on an indicator that measures perceptions of citizens' ability to select their government and other traditional rights and liberties (freedom of speech, association, and a free media, etc.). We also consider economic freedom as proxied by a measure of overall business regulations (administrative requirements, costs, licensing restrictions, etc.) (sub-indicator 3.3).
Theme 4 – Environmental performance and commitment
The model also takes account of progress in environmental quality (air, water, biodiversity, etc.) and reducing pressure on the environment (waste reduction, carbon emissions, combating the depletion of raw materials, etc.). We focus on three aspects within this fourth theme: environmental performance, ecological footprint, and climate change. Environmental performance (sub-indicator 4.1) is measured by benchmarks for environmental pollution, biodiversity, forest management, overfishing, etc. The ecological footprint (sub-indicator 4.2) indicates how large an area of biologically productive land and water a population group requires in one year to maintain its level of consumption and process its waste production. Climate-change aspects (sub-indicator 4.3) measure a combination of data on levels and changes in carbon emissions, energy use per capita and the share of renewable energy in the energy mix.
Theme 5 – Security, peace and international relations
The final theme focuses on the existence and achievement of peace and security, and on international relations between countries. Peace and security are amongst citizens’ most important basic needs and are simultaneously essential preconditions for economic prosperity. To measure peace and security (sub-indicator 5.1), we use a combination of several indicators that include security threats to a state, fragmentation of institutions, state legitimacy, levels of displaced populations, external interventions, militarisation, human rights, rule of law, and incidents of homicides, terrorism and criminality.
There are two dimensions to measuring international relations between countries. The first concerns the degree to which countries are signatories to international treaties (sub-indicator 5.2), which is based on the status of ratification of important treaties relating to fundamental human right, labour rights, and environmental agreements. The second is the degree to which countries have open borders (sub-indicator 5.3), which is measured by a country’s economic, social and political globalisation.
The rating calculations
There are three stages to arrive at a score for each country based on these five themes. We begin at the sub-indicator level, specifically for sub-indicators comprised of various data series. Each series is standardised so that the best performing country gets a standardised score of one and the worst performing country gets a score of zero. The series are then averaged together, giving equal weight to each series, and thus providing us with a score for that sub-indicator (the exception is sub-indicator 1.1 (macroeconomic performance and absence of disequilibria), where ‘disequilibria’, which is made up of several data points is given a 50% weighting compared to 25% each for ‘GDP growth’ and ‘volatility of economic growth’. Sub-indicators based on a single data series are simply standardised from zero to one.
The second stage then moves to the theme level. The values for each sub-indicator, calculated in the previous step, are averaged together (again with equal weighting) and then standardised to a value between zero and one. The best performing country again gets a value of one and the worst performing a value of zero. If a value for one of the sub-indicators is missing, the raw theme score is calculated without that sub-indicator. If a country has data for less than 80% of sub-indicators (i.e., if three or more of the fifteen sub-indicators are missing) the country is excluded from the calculations. In the final third stage, we calculate the average of the standardised scores for the five themes (again with equal weighting). By standardising that average between zero and one, we obtain the KBC Country Sustainability Barometer.
3. Screening results
KBC Sustainability Barometer: update 2025
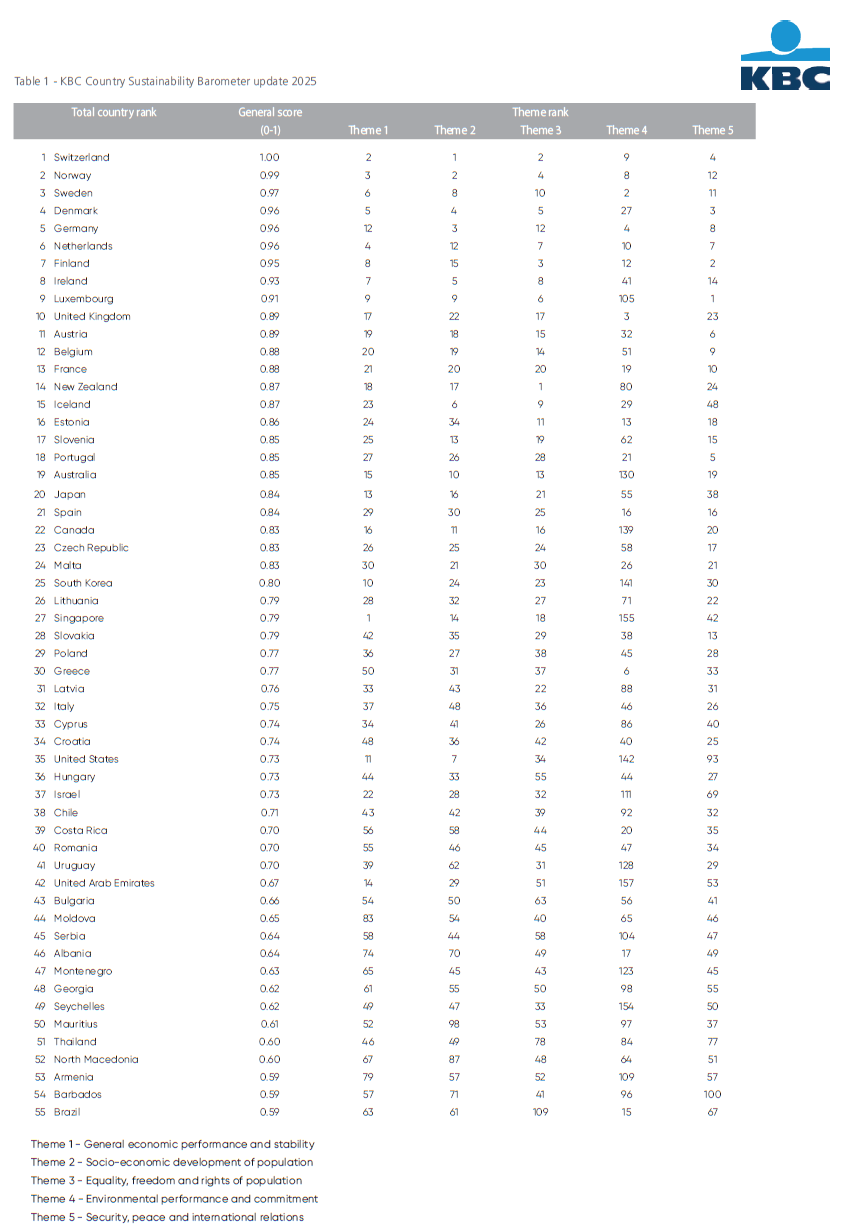
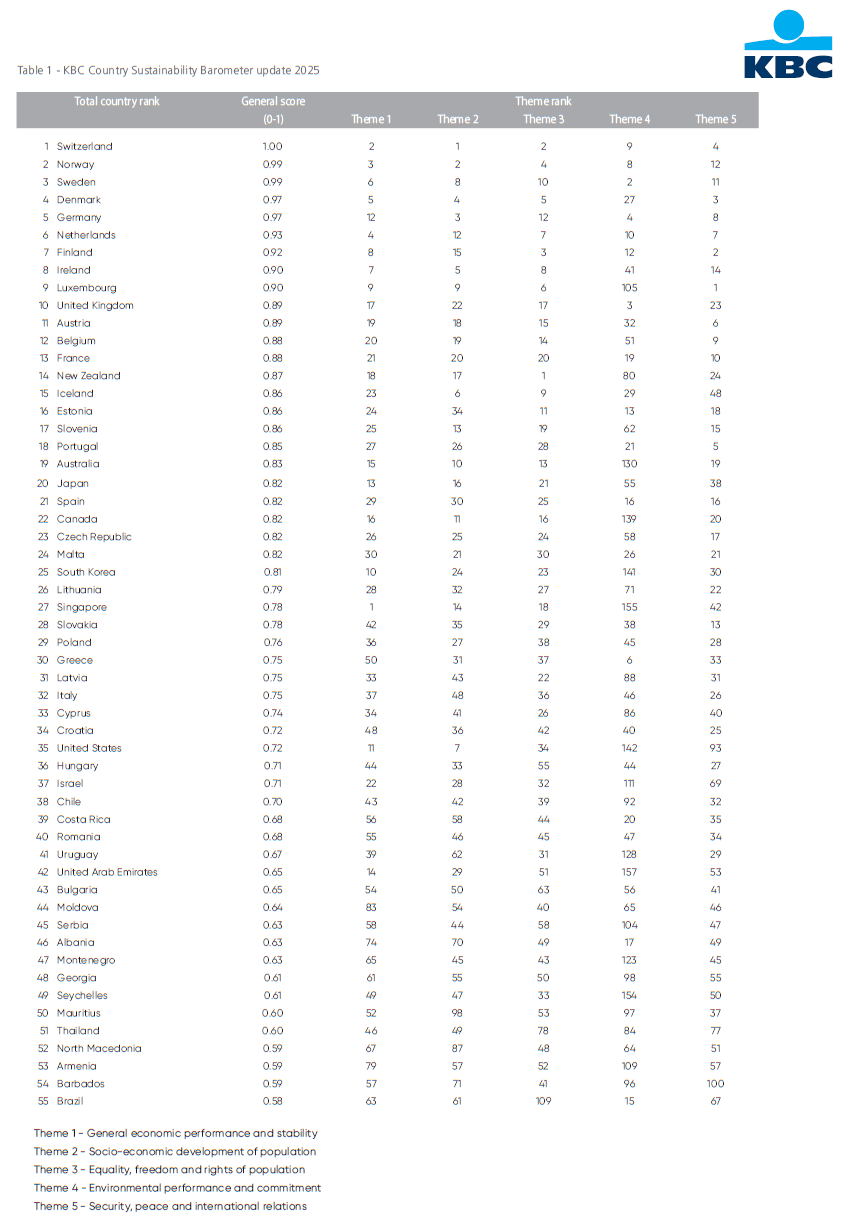
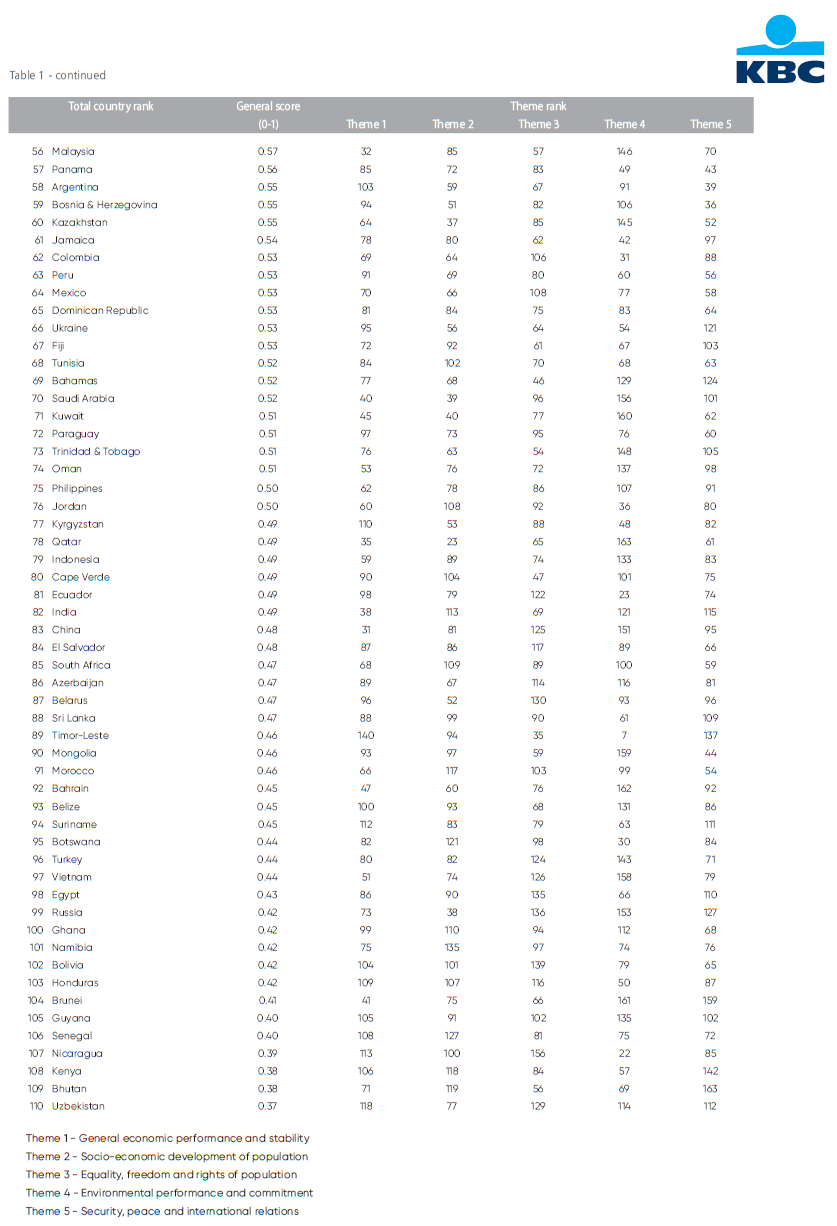
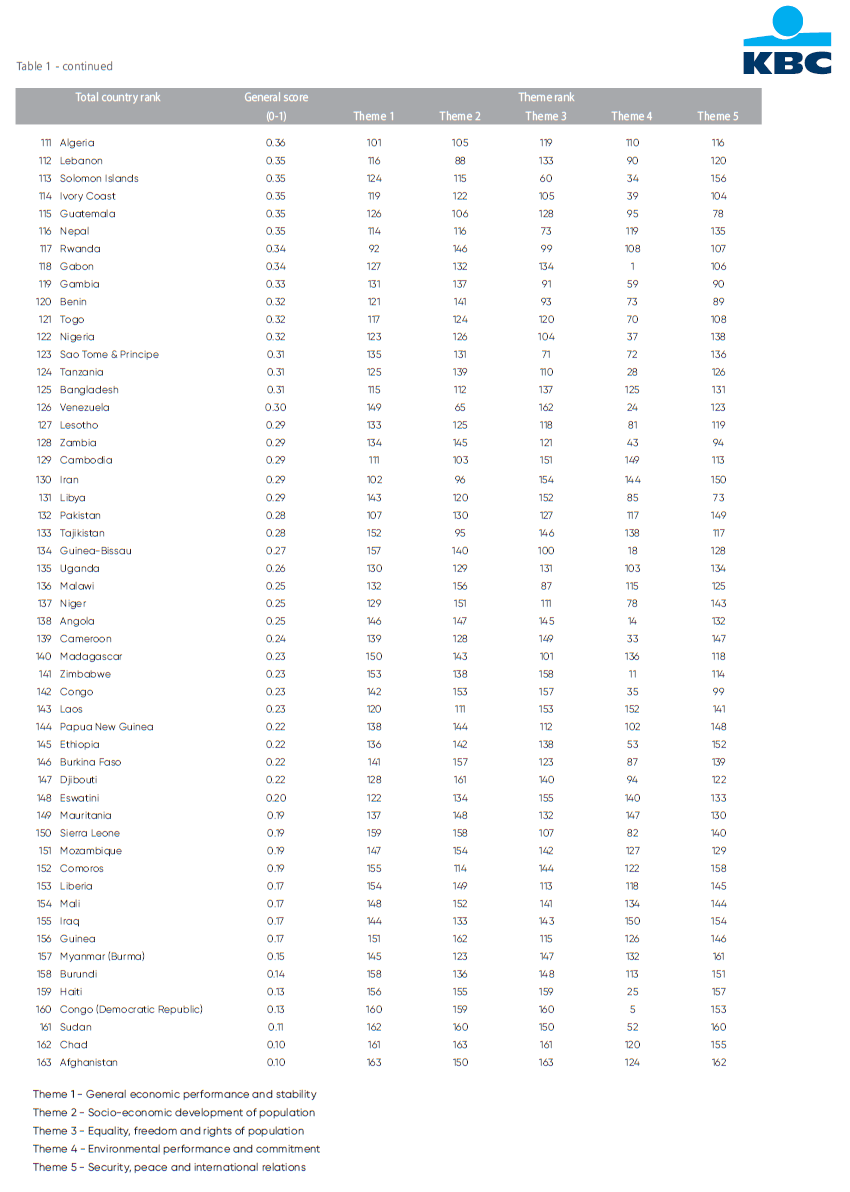
Switzerland, Norway, and Sweden occupy the first three places respectively in the general country ranking of the KBC Sustainability Barometer (see table 1). Denmark and Germany also score very well, taking the fourth and fifth places, respectively. The top four countries ranked in the top four of last year’s rating as well. The Scandinavian countries and Switzerland convincingly demonstrate that economic, social and ecological performance and policy goals need not conflict with each other, but can, on the contrary, reinforce one another. These countries have been at the top of the country ranking since the start of KBC's screening exercise in 2002.
In general, advanced economies outperform emerging economies in the ranking. The highest-ranking emerging market economy is Estonia, at 16th place, though other peer economies with similar GDP-per-capita ratios, such as Slovenia and the Czech Republic, rank 17th and 23rd, respectively. In general, the Central and Eastern European economies perform well relative to the other emerging markets, as was also the case in previous rankings.
Belgium ranks 12th out of 163 countries, after ranking 17th in last year’s screening. That is quite an improvement and a trend reversal, as Belgium had lost several places in the ranking in previous years.2 The country scores best (9th place) for theme 5 (‘Peace, security and international relations’). Belgium owes its recent improvement in the barometer to its better score on ‘Environmental performance and commitment’. However, with a 51st place, its performance on this theme remains relatively poor, implying that there is still some way to go in that area. Belgium is not alone in scoring decent in themes 1, 2, 3 and 5, but still poorly in theme 4, especially among advanced economies. Among the top 20 ranked countries in the 2025 barometer, Ireland, Luxembourg, New Zealand, Australia and Japan all show a less-than-stellar performance in environmental sustainability.
1 This definition is in line with the concept of sustainable development as first put forward by the Brundtland Commission (see WCED, 1987).
2 More detail on Belgium’s performance in the country ranking can be found in a KBC Economic Opinion published together with this Research Report: "Belgium climbs to 12th place in the KBC Country Sustainability Barometer", 4 February 2025.