

Economic Perspectives December 2025
Read the full publication below or click here to open the PDF.
- Continued high supply is putting downward pressure on energy prices. This was most visible in natural gas prices which declined by 7% last month to 29 EUR per MWh, thanks to high US LNG supply. Oil prices also continued their descent, declining by 2.6% to 62 USD per barrel. High non-OPEC+ supply along with recent OPEC+ production quota increases have left the market oversupplied. Along with energy prices, food prices have declined by 1.5% month-on-month and 2% year-on-year thanks a.o. to large drops in sugar and dairy prices.
- Euro area inflation remained unchanged at 2.1% in November. Within non-core components, a decline in food inflation was compensated by an increase in energy inflation (caused by base effects). Core inflation stabilised at 2.4% as a decrease in goods inflation was compensated by an increase in services prices. Given lower oil and gas prices, we maintain our 2.1% forecast for 2025, while downgrading our 2026 forecast from 1.8% to 1.6%.
- The euro area economic recovery is underway. Q3 growth was revised upwards to a healthy 0.3% quarter-on-quarter. The growth was mostly generated by healthy gross capital formation and strong government consumption. Private consumption also remains weak as the household savings rate remains elevated. The labour market is also showing signs of easing. We maintain our 1.4% and 1% growth forecast for 2025 and 2026, respectively.
- The US economy is starting to show some signs of softening. Most notable is the weakening in consumer spending, which was flat in September. Weak auto sales and low consumer confidence point to further weakness ahead. The labour market is also gradually weakening as the unemployment rate has risen from 4.4% to 4.6%. Nonetheless, business confidence indicators continue to indicate economic resilience in the quarters ahead. We maintain our 1.9% and 1.7% forecasts for 2025 and 2026 growth, respectively. US inflation also seems to have reached its peak as forward-looking indicators point to softening ahead. We thus expect 2.7% inflation this year and 2.6% inflation next year.
- The Chinese economy likely slowed further in the fourth quarter, with sentiment indicators, industrial production, retail trade, and investment all pointing to flagging momentum. There could be some room for a modest recovery in 2026, but this will depend on how much and what kind of government stimulus is on the way. Given substantial headwinds to growth that remain, we continue to expect real GDP growth to come in just below the government growth target at 4.9% in 2025 before slowing to 4.4% in 2026.
- Monetary policy choices continue to diverge. The ECB maintained its deposit rate at 2% in December, as the euro area economy remains in a good place (with inflation hovering around its target). We expect this 2% rate to be maintained in 2026. In contrast, the Fed is in a conundrum as inflation remains well above target, while the labour market is weakening. The Fed decided to cut its policy rate in December, nonetheless. We expect two more rate cuts in the next quarter, bringing the policy rate to a neutral rate of 3.125%.
Global trade tensions eased again last month as the US softened its trade stance. In an attempt to address affordability concerns, the Trump administration expanded the list of products exempted from reciprocal tariffs. The focus was on food imports such as beef, coffee and exotic fruits. The US also announced a deal with Switzerland which lowered the tariff rate from 39% to 15%. Deals with Argentina, Guatemala, El Salvador and Ecuador have also been announced, though the details of these deals remain unclear. These recent changes have lowered the US effective tariff rate from 17.9% to 16.8%.
The lower tariffs and lowered trade uncertainty will give some support to the global economy, which is softening. This softening is most apparent in China, where the anti-involution campaign seems to have hurt investment. Retail trade and industrial production remain weak. Continued problems in the real estate sector continue to weigh on confidence as well. Signs of softening are also starting to show in the US, as consumption stalled in September and the labour market is showing signs of strain. The US economy is, nonetheless, surprisingly resilient given increased protectionism by the Trump administration.
In contrast to the US and China, the European economy is recovering gradually. Consumption remains weak, however, and there is strong divergence between member states. Economic divergence between the US and the euro area is also causing monetary policy divergence. While the ECB kept its policy rates unchanged, the Fed cut its policy rates again in December.
High supply keeps pushing energy prices down
Oil prices continued their descent last month, declining by 2.6% to 62 USD per barrel. Prices are now 13% lower than a year ago. Markets expect the current oversupply to continue well into 2026. This expectation was confirmed by an important change in OPEC’s oil forecast for next year (which caused a 4% drop on the day of the report’s publication). While the cartel had forecasted an oil deficit in prior months, it now expects the market to be in surplus in 2026. The unwinding of OPEC+ production cuts has been largely responsible for this oversupply. Since March, the cartel increased its production quota by almost 2.7 million barrels per day. Non-OPEC+ supply has also been rising significantly. The oversupply in the markets explains why recent geopolitical events (tensions in Venezuela, Ukraine-Russia developments…) have a limited effect on oil prices.
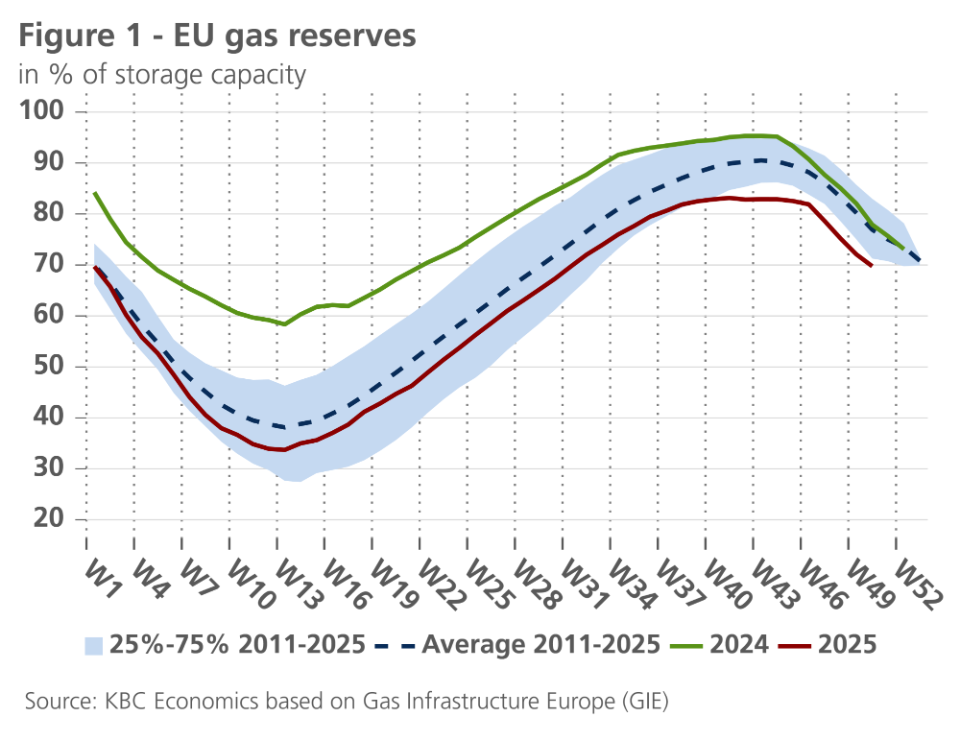
Despite the cold weather, gas prices also declined significantly in November. They reached 29 EUR per MWh at the end of November, 7% lower than the month before. Higher US LNG exports, along with lower Asian LNG demand (especially in China) are putting downward pressure on TTF prices. This explains why prices are subdued, even though EU gas reserves remain below historical averages (see figure 1).
Along with energy prices, food prices declined for the third month in a row. Prices declined by 1.5% last month and are now 2% lower than a year ago. The decline is caused by strong declines in sugar and dairy prices due to supply increases in both categories. Cereal prices ticked up slightly last month but remain 5.3% lower than a year ago. Strong harvests in a.o. Argentina and Australia along with record rice harvests in Asia have brought down cereal prices. In contrast, meat prices increased 4.9% year-on-year, largely driven by strong demand.
Positive surprises in euro area growth
In the euro area, real GDP growth in the third quarter (compared to the second quarter) was revised slightly upwards from 0.2% to 0.3%. The breakdown of growth into expenditure components shows that (excluding Ireland) government consumption made the largest contribution to growth, followed by investment and private consumption. From a sectoral perspective, in most large(r) countries, the service sectors made the largest contribution to growth, while the contribution of manufacturing was significantly smaller. In Germany, the latter was even strongly negative.
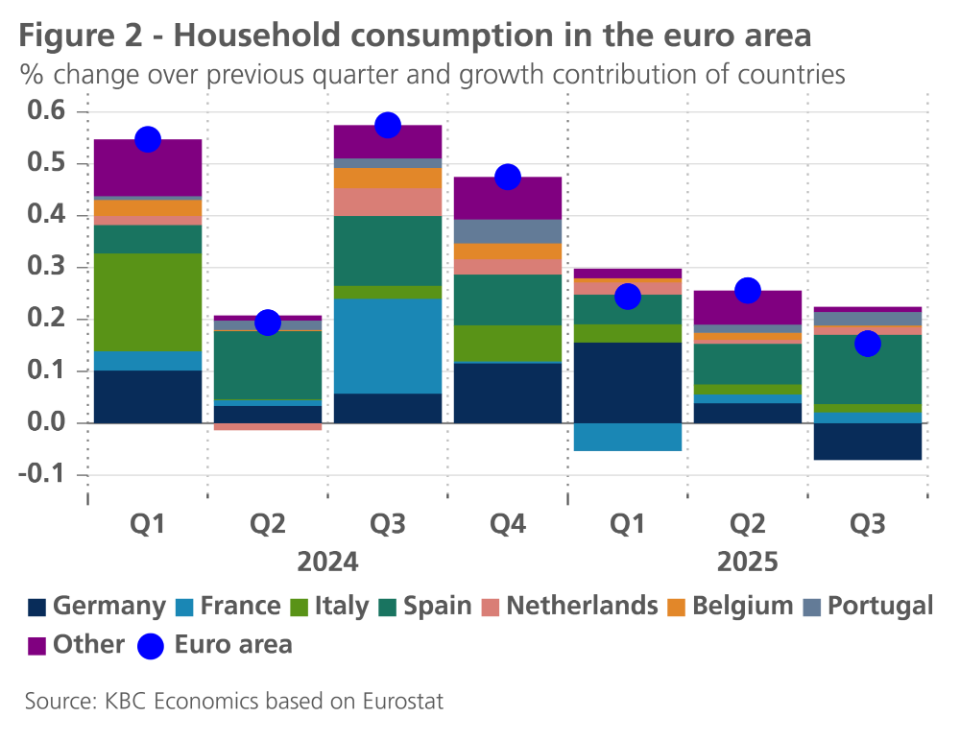
It is striking that quarterly growth in household spending has gradually declined over the past five quarters (see figure 2). It was mainly sustained by Spanish consumers, while German consumers in particular underwhelmed in the third quarter. In general, consumers in the euro area kept their savings elevated, despite the increase in real wages and net job creation. In the third quarter, jobs increased by 278,100 versus the previous quarter, an increase of 0.2%. Compared with a year earlier, the increase was more than 1 million or 0.6%. It appears that sluggish confidence, which is improving only slowly, kept household savings at a historically high level.
Looking back on 2025, it is striking that the economy has weathered the major geopolitical uncertainty and escalating trade tensions with the US in the first half of the year better than expected. Domestic demand is expected to strengthen again in 2026 when significantly more accommodative fiscal policy in Germany, together with the spending of the final tranches of Next Generation EU transfers, will counterbalance the dampening impact of fiscal consolidation in other countries. The past easing of monetary policy will also further stimulate the economy, as usual with some lag.
Producer confidence in the euro area continued to improve in November, although this was only the case in services and construction. In manufacturing, it fell slightly. The slight decline in German business expectations, as recorded in the Ifo surveys, following the upturn in October, was disappointing. This serves as a reminder that the slump in the German economy has not yet been overcome and that the expected improvement is likely to be only gradual.
We maintain our outlook of a gradual strengthening of domestic demand in the euro area from the last quarter of 2025 and especially in the course of 2026. The only tentative improvement in consumer confidence so far suggests that the consumption engine will only gradually shift into higher gear. However, if households reduce their currently very high savings more sharply than expected, there is also a chance that the pick-up in growth will be stronger than assumed here.
We have left our expectations for average real GDP growth in the euro area unchanged at 1.4% for 2025 and 1.0% for 2026. The higher average growth rate for 2025 than for 2026 is due to a higher carry-over effect from the previous year. Growth throughout the year is expected to be slightly stronger in 2026 than in 2025 (1.2% versus 1.1%).
Inflation in the euro area slightly higher again
In the euro area inflation stabilized at 2,1% in November. Core inflation has remained stable at 2.4% over the past three months. However, this stabilisation masks a slowdown in goods inflation (excluding energy and food) from 0.8% in September to 0.5% in November, while services inflation rose from 3.2% in September to 3.5% in November.
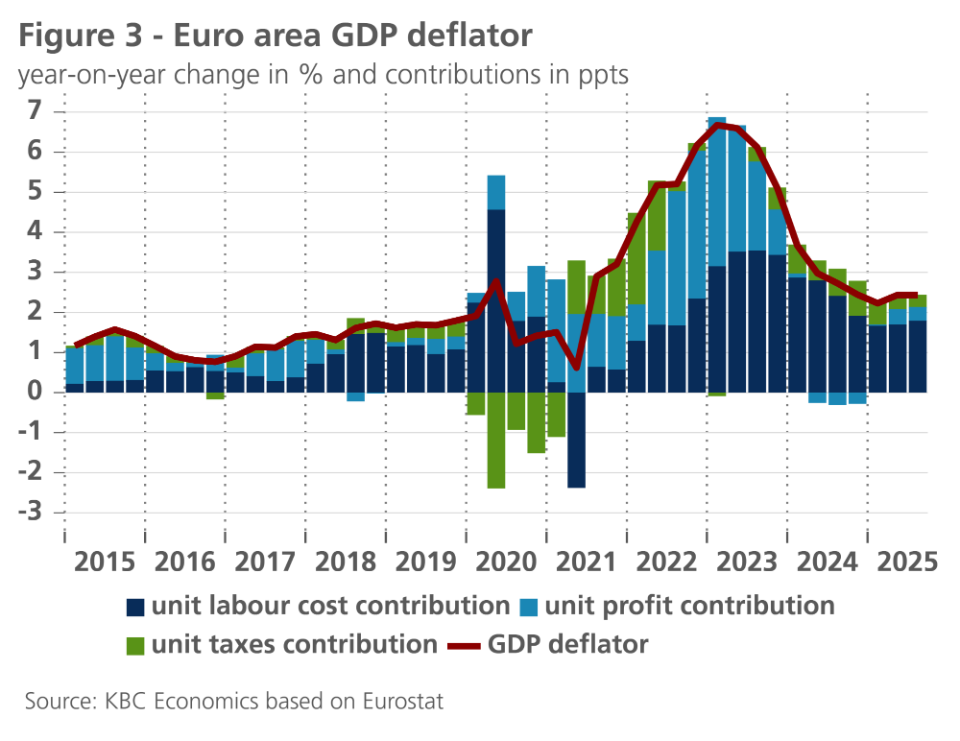
The latter can be linked to the development of unit labour costs. Year-on-year growth in compensation per employee stabilised at 4.0% in Q3, while labour productivity growth slowed slightly. As a result, unit labour costs again made a slightly higher contribution to inflation, as measured by the GDP deflator. This is because companies were able to pass on the slightly higher unit labour costs to their customers without eroding their unit profits (see figure 3).
Nevertheless, wage cost pressures on inflation are expected to ease in the coming quarters. Wage agreements continue to point to a slowdown in wage growth, while labour productivity growth is likely to remain stable or even strengthen somewhat. Given that labour costs are an important factor in services inflation in particular, we are maintaining our expectation of a further cooling of services and core inflation to around 2% by the second half of 2026. Meanwhile, compared to a month ago, futures point to significantly lower energy prices for the coming period. On that basis, we have revised our forecast for energy price inflation downwards, which has also lowered our forecast for total inflation in 2026 from 1.8% to 1.6%. For 2025, the forecast remains unchanged at 2.1%.
US economy is softening gradually
As the shutdown has ended, official data are again being released (though with a lag). They have thus far been a mixed bag. On the positive side, durable goods orders grew at a solid pace in September (+0.5%), boding well for equipment spending in H2. The trade deficit also narrowed substantially over the summer, which will push up the contribution of net exports in Q3 substantially.
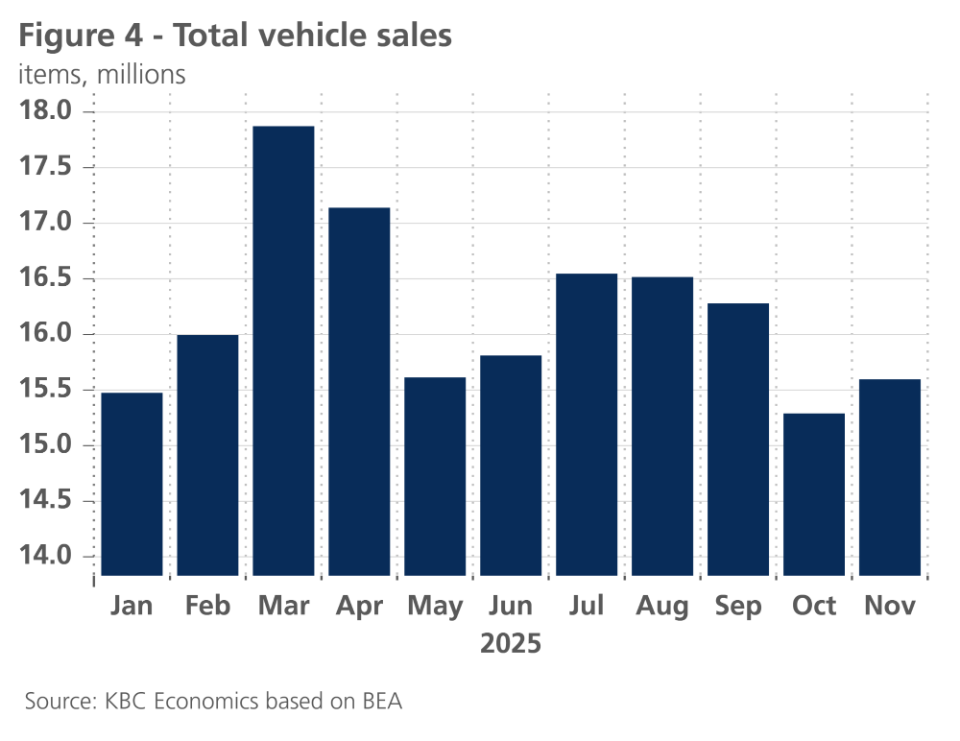
On the negative side, real personal consumption expenditures were flat in September (and August figures were revised downwards). Over the third quarter, consumption still grew at a decent 0.7%. However, consumption is set to weaken in Q4. Consumer sentiment indicators remain at very low levels. The expiration of EV tax credits in September is also weighing on auto sales in Q4 (see figure 4). Furthermore, the shutdown could weigh on consumption by furloughed federal employees in Q4 (and bounce back in Q1 2026).
Some softening is also apparent in the labour market as the US unemployment rate increased from 4.4% to 4.6% from September to November. Job growth was also weak as non-farm payrolls increased by only 67k in total over the last three months. This low figure was partly caused by a sharp decline in federal employees in October by 162,000, as some of them accepted a deferred resignation offer and came off federal payrolls.
Nonetheless, the US economy remains resilient in the face of protectionist trade and migration policies. Business sentiment indicators still paint a positive picture overall, especially for the all-important services industry. We thus maintain our 1.9% and 1.7% growth forecasts for this year and next year, respectively (slightly below potential).
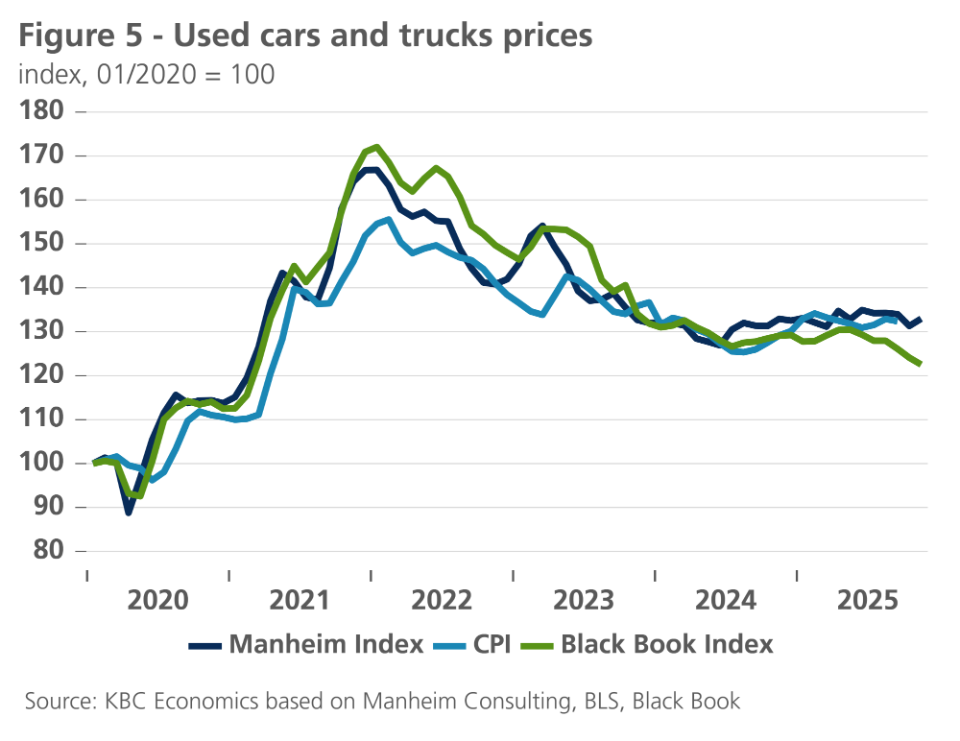
The impact of Trump’s tariff policies is also having a smaller than anticipated impact on inflation. Though at 2.7% in November, US headline inflation remains at an elevated level, inflation seems to have passed its peak. Lower oil prices will bring down energy prices, while the recent lowering of tariffs on certain food items could temper food inflation. Forward-looking indicators also point to further softening in shelter prices and used car prices (see figure 5). Lower wage pressures also bode well for services inflation. Furthermore, consumer inflation expectations have also come down, though they remain at elevated levels. We expect 2.7% inflation this year and 2.6% inflation next year, with risks tilted to the downside.
Chinese economy is under pressure
The Chinese economy shows signs of a continued slowdown in the fourth quarter. Private and official business sentiment indicators generally edged down in November with the exception of the NBS manufacturing PMI, which remains in contraction territory at 49.2. Retail trade and industrial production growth continued to decelerate on a year-over-year basis in November, with retail trade showing particularly weak momentum (-0.42% month-over-month). Meanwhile, fixed asset investment fell for the third month in a row (-2.6% year-to-date year-over-year in November), suggesting so-called anti-involution efforts may be causing a sharper-than-expected pull back in investment. These dynamics support our view of GDP growth slowing further from 4.8% year-over-year in Q3 to 4.4% year-over-year in Q4. This would bring annual GDP growth for 2025 to 4.9%, just under the government’s official growth target of 5%.
Looking ahead, there could be some room for a modest recovery in growth momentum in 2026. Much of this will depend on how much and what kind of government stimulus is on the way, which in turn will likely depend on where the government sets the growth target for 2026. A 5% target will be harder to reach without further support, especially given that long-standing challenges remain (such as the real estate sector correction, weak consumption growth, excess capacity, an aging population, and over-indebted local governments and households). On top of these challenges, exports as a main driver of growth, which was the case in 2024 and 2025, may face new headwinds given ongoing global tensions related to trade (though the temporary trade truce between China and the US reached in October reduces some uncertainty in this respect). Given these dynamics, we leave our 2026 growth outlook unchanged at 4.4%. We also leave our average annual inflation forecasts for 2025 and 2026 unchanged at -0.1% and 0.7%, respectively. Though headline inflation has inched up in recent months on easing food price deflation, overall, deflationary pressures in the economy remain as evidenced by still declining producer prices (-2.2% year-over-year in November).
Fed continues easing cycle
On 10 December 2025, the Fed cut its policy rate by 25 basis points to 3.625% as expected. The statement noted that risks still posed a policy dilemma, particularly downside risk to the labour market and upside risk to inflation. According to Fed Chair Powell, policy rates are now in a zone of plausible estimates of neutral interest rates. This means that subsequent rate cuts will be more data-dependent and thus less obvious than has been the case so far, when Powell still explicitly labelled policy rates as (moderately) restrictive. We confirm our view that the Fed will cut the policy rate to 3.125% in two steps of 25 basis points each at the next two policy meetings (in January and March), thus bringing an end to the easing cycle. That level is consistent with Fed officials' median estimate for the long-term neutral interest rate.
In addition, the Fed explicitly confirmed that reserves in the financial system have declined from ‘abundant’ to ‘ample’. In other words, the already concluded policy of quantitative tightening has achieved its goal. However, the Fed now seems concerned that the liquidity reduction has gone a little too far to accommodate certain moments of additional liquidity needs. For monetary policy transmission, this could pose problems if, as was recently the case, the overnight money market rate were to rise above the target range of the policy rate due to a liquidity shortage. Indeed, that would weaken the Fed’s policy grip on money market rates and thus undermine monetary policy transmission.
In addition, Powell also referred to 15 April 2026, 'Tax Day', when a large number of tax payments will be made. The US Treasury will receive these amounts through its account at the Fed, temporarily withdrawing them as available liquidity in the market. This would threaten to create shortages. The September 2019 liquidity problem, which marked the end of the QT program at the time, followed a similar scenario.
Learning from that experience, the Fed, after its latest policy meeting, announced a new program of 'liquidity management' to be launched this month. To respond to the market's liquidity needs, the Fed will be able to buy short-term government securities (mainly 'T-bills') amounting to 40 billion US dollars in December. In subsequent months, that amount would fall to around 20 billion US dollars per month. Powell stressed that this is purely part of liquidity management and would not affect the Fed's monetary policy stance. This policy neutrality of the planned purchases of 'T-bills' is undoubtedly the Fed's intention. However, we cannot overlook the fact that this will inject non-negligible amounts of liquidity into the market, which will inevitably have a side effect on short-term and long-term interest rates.
ECB keeps its policy rate unchanged as expected
The ECB kept its policy rate unchanged at 2% at its policy meeting on 18 December, as expected. It has long been our view that this is the bottom of the current interest rate cycle. Meanwhile, the market has also largely priced out the possibility of another precautionary rate cut. On the contrary, the main risk scenario for the market is that of a first rate hike in autumn 2026. However, that timing seems too early to us, although we share the assessment that the deposit rate at 2% is rather at the lower end of the neutral band.
The current outlook assumes that no meaningful new shocks to the macro-financial environment will occur in the coming months. Shocks related to the international monetary system cannot be ruled out and would impact the scenario. Examples of such potential shocks include a new focus on the US administration’s 'Mar-a-Lago Accord' plans, disruptive attacks on the Fed's independence and rising geopolitical tensions related to the Euroclear case.
Against this backdrop, we confirm our scenario of the euro gradually appreciating further against the dollar. In the somewhat longer term, this has to do with the relative valuation of both, while in the short term, the interest rate differential between the Fed and the ECB also plays a role.
Higher term premiums push up bond yields
In recent weeks, bond yields rose more sharply than expected. This was especially the case for German yields. The main reason was the further decompression of the term premium of German yields. The era of relative scarcity of German Bunds seems to be over, so the term premium demanded by investors for those bonds is normalising upwards. The recent rise is therefore more than just temporary volatility. The continued upward trend in German 10-year real yields also points in that direction, confirming our scenario that this upward normalisation could continue for some time.
On balance, we confirm the expected path for US 10-year rates. However, since the German counterpart has risen more sharply and faster than we expected, we raise the expected path for 2026. In other words, we expect a further gradual rise in the German 10-year rate to around 2.90% by the end of 2026.
Intra-EMU spreads decrease further
Over the past month, eurozone government bond yield spreads against Germany fell further. In other words, these yields rose less rapidly than German ones. Explanatory factors include the reassuring existence of the ECB's Transmission Protection Instrument (TPI) and the expected (moderate) cyclical recovery in the eurozone. The higher term premium on German government bonds, especially, plays an important role, reflecting the German debt agency's sharply increased debt issuance to finance Germany’s planned fiscal stimulus.
All historical prices, statistics and charts are up to date as of 15 December 2025, unless otherwise stated. The positions and forecasts provided are those of 15 December 2025.