

The misery index revisited: what it tells us on the eve of yet another shock

Cllik here to open the PDF

European economies underwent a series of rapidly successive shocks in recent years. The pandemic was followed by the Ukraine war and energy crisis and, more recently, the tariff shock initiated by US President Trump. Past experience shows that such difficult periods tend to be accompanied by increasing imbalances in the economy. More specifically, higher inflation, rising unemployment, worsening current account balances and widening government budget deficits are often consequences. In this Economic Brief, we quantify a ‘misery index' that combines these imbalances into a single figure. We show how the index for Belgium evolved over the period 1960-2025. We also compare the index among the 27 EU countries for the year 2025. The latter illustrates the extent to which member states face economic imbalances on the eve of yet another shock that has recently emerged, notably the war in the Middle East. The analysis points out that Belgium is among the countries where the value of the misery index is rather large.
The build-up of economic imbalances is usually problematic. It cannot last for years and is best remediated as it threatens a country's financial-economic stability and may eventually cause (long-term) welfare damage. High inflation implies monetary devaluation and erodes households' purchasing power. Unemployment corresponds to unused labour and thus a loss of economic activity and income. Countries with current account deficits are 'net spenders'. On an aggregated basis, households, businesses, and the government spend more (via consumption and investment) than they bring in (national disposable income). Consequently, they live beyond their means and have to borrow abroad. Finally, excessive government deficits can lead to an unsustainable debt ratio. The adjustments required to reduce an out-of-control public debt position are usually substantial and can be costly from a social perspective.
Sum of imbalances
In order to get an overall picture of the extent to which the mentioned economic imbalances are effectively occurring, we can simply add up inflation (in percentage change), the unemployment rate (in percent of the labour force), the current account deficit of the balance of payments (in percent of GDP) and the public budget deficit (in percent of GDP). Thus quantified, this measure is an extension of the simple misery index (i.e. the sum of inflation and the unemployment rate), which was put forward by US economist Arthur Okun (advisor to President Lyndon B. Johnson) in the 1960s. It was intended to give a quick indication of the amount of 'economic misery' in a country.
While such an expanded misery index (supplementing the classic Okun index with other imbalances) is comprehensive, it has limitations and should not simply be seen as the ultimate measure of 'economic misery'. In fact, the word 'misery' does not quite cover it. A country e.g. can have a relatively high GDP per capita and low poverty or inequality, but still have a relatively poor misery index. The latter then does indicate that there are risks behind the prosperity. Moreover, such an index is purely macroeconomic in its nature (it does not take into account the impact of the economy on the environment and climate, for example) and also says nothing about the cause of imbalances (public finances may deteriorate, for example, because of an increase in, hopefully productive, public investment).1
The Belgian picture
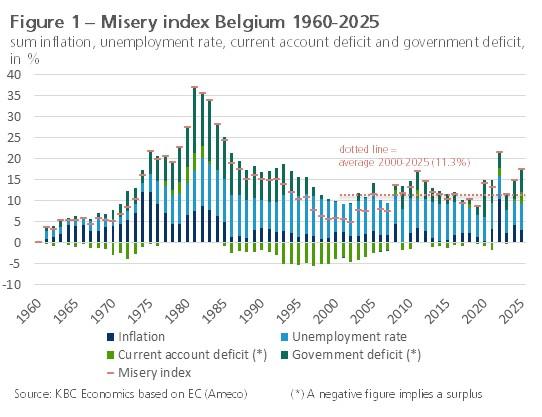
Figure 1 shows the long-term evolution of the expanded misery index for Belgium over the period 1960-2025.2 During the past 25 years, the index peaked in 2011, in the wake of the banking and sovereign debt crisis, and even more so in 2022, during the energy crisis, when inflation in particular soared. At both times, though, the index remained well below the peaks recorded between the mid-1970s and mid-1980s in the previous century. Interestingly, the misery index over the past two years (14.8% in 2024 and 17.3% in 2025) was also well above the average since 2000 (11.3%). The values for both those years were even above the average for the longer 1960-2025 period (13.1%). The deterioration in 2025 was related to a rising unemployment rate and a widening deficit in both the current account and the government budget. Inflation fell in 2025, but remained quite high at 3%.
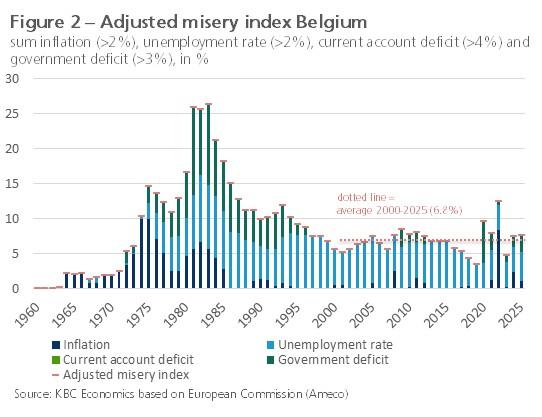
A simple addition of the four variables ignores the fact that 'small' imbalances are usually not really a problem. For instance, inflation below 2% (the ECB policy target) is mostly just a reflection of product improvements. Furthermore, part of the unemployment rate concerns non-problematic search or frictional unemployment. While it is not clear exactly how high it is, the frictional unemployment rate is often estimated at around 2 percentage points. In its Macroeconomic Imbalance Procedure, the European Commission sees a current account deficit as problematic only once it exceeds 4% of GDP. Finally, for the government deficit, according to European budgetary rules, there is a problem when it exceeds 3% of GDP. In figure 2 we show an 'adjusted misery index' for Belgium, taking into account for the four variables only the part above the signal values indicated. Viewed this way, Belgium's current situation is slightly less unbalanced, including a current account deficit that remains below the threshold. Nevertheless, the adjusted value in 2025 (7.5%) was still above the average since 2000 (6.8%), albeit now below the average since 1960 (8.5%).
European perspective
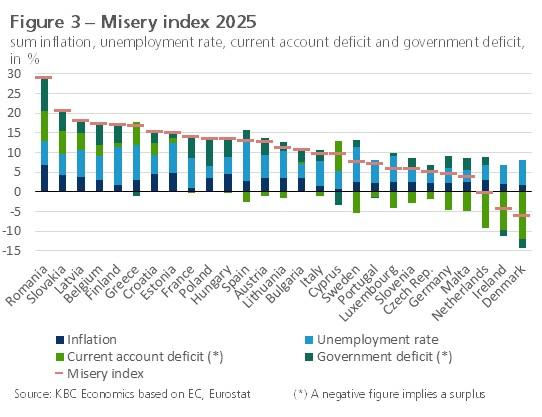
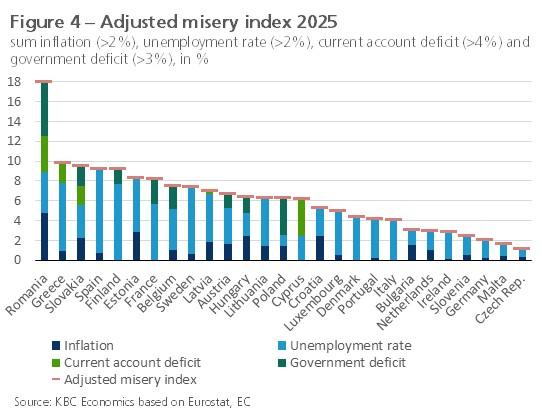
In Figure 3, we compare the misery index for the year 2025 among the 27 European Union (EU) member states. In Figure 4, we do the same for the adjusted version of the index discussed above. The most recently known data for the different variables are taken into account.3 The index calculations give a relative picture of the extent to which EU countries are facing imbalances on the eve of a new shock that has recently emerged, namely the Iran war in the Middle-East.
Based on the normal misery index (i.e. simple sum of the four imbalances, figure 3), Romania and Slovakia were the most unbalanced economies in the EU in 2025. At the other extreme, we see the Netherlands, Ireland and Denmark as the least unbalanced economies. Belgium ranks 4th in terms of the imbalances identified in 2025 and thus does not score particularly well within the group of EU countries. When analysed on the basis of the adjusted index (figure 4), Belgium's position improves, although it remains not very good (8th place). The imbalances for Belgium in 2025 concern inflation (1 percentage point above the 2% target), the unemployment rate (4.2 percentage points above the search unemployment rate) and the government deficit (2.3 percentage points above the 3% target). Even more clearly than for the normal index, Romania remains the country with the largest imbalances for the adjusted index, and this on all four variables considered. The Czech Republic scores best for the adjusted index, with only inflation and unemployment slightly above the threshold values.
1 Note that a large current account or government budget surplus in fact may also indicate an imbalance. Also, the index assumes that each percentage point increase in the four subcomponents is equally pernicious (equal weights).
2 A final figure for the current account balance for 2025 is not yet available. The figure used is a KBC Economics estimate based on already known figures for the first three quarters.
3. For inflation and unemployment rates, these are the figures already known. The current account balance and government balance concern the European Commission's estimate made in autumn 2025.