

The Economics of the Big Beautiful Bill

- Read the publication below or click here to open the PDF

The One Big Beautiful Bill Act will have major implications for the US economy. As it further increases US deficits in the coming decades, it puts US public debt on an unsustainable trajectory. Under unchanged policy, the US debt to GDP ratios could almost double in the next three decades, partly as a result of this act. This debt increase would put upward pressure on yields and lead to a sharp increase in interest payments by the US government. Given the large fiscal impulse provided by the act, the act is likely to provide a boost to growth in the short run (versus a scenario where the Trump tax cuts expire). However, the short-term multipliers are likely to be low as the act continues to favour high-income Americans, interest rates stabilise well above the zero lower bound and US debt levels are already elevated. In the long run, the act is likely to have strong negative growth effects as high rates could hurt private investment, loss of health care coverage could hurt productivity, and tighter migration enforcement could hurt the labor supply. Furthermore, the climate provisions in the act could drive up US emission by an estimated 15% in the coming decade.
While Americans celebrated their national holiday on 4 July, US President Donald Trump signed the ‘One Big Beautiful Bill Act (OBBBA)’ into law. The act will be his most transformative piece of legislation with a major impact on fiscal, environmental, migration and healthcare policies. In this research report, we assess the macro-economic impact of this law.
Impact on debt sustainability
The most obvious effect of this act will be to increase deficits and exacerbate public debt sustainability concerns. The Congressional Budget Office (CBO) estimated that the act would increase public debt by 3.4 trillion USD over the next ten years (11.7% of 2024 GDP). This estimate is only a static analysis, meaning it doesn’t take into account the impact on growth or interest costs. A dynamic analysis by the Committee for a Responsible Budget (CFRB) estimates that the total cost of act would be 4.1 trillion USD over the next 10 years. It is also important to note that many of the tax provisions (such as the tip income exemption, the overtime income deduction or the increased child tax credit) in the law are set to expire after 2028. Given how politically fraught it would be to let these provisions expire, many of them might well be extended afterwards. The CFRB estimates that extending these provisions would add another 1.4 trillion USD to the debt over the next 10 years.
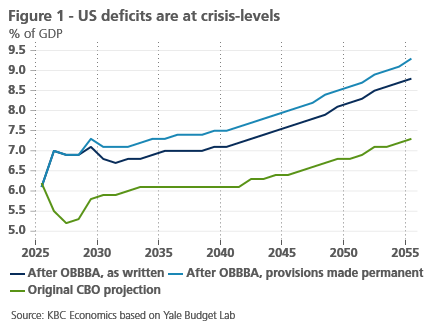
This increased spending will further blow up the budget deficit. Deficits had already reached unsustainable levels during Biden’s term. In 2024, the deficit reached 6.2% of GDP. According to the original CBO projections, deficits were set to decline to 5.2% by 2027, due to the expiration of the Tax Cuts and Jobs Act (TCJA). In contrast, the OBBBA could increase the deficit to 7% next year (see figure 1). Only during the Global Financial Crisis and the covid pandemic were deficits higher than that in the postwar period. On a longer term, deficits will gradually increase further (to 8.8% of GDP by 2055).
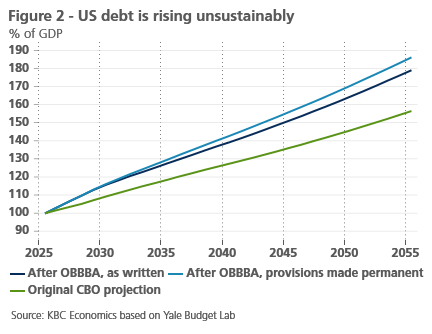
Having such sustained elevated deficits over the next decades will obviously blow up US government debt. The debt to GDP level was already set to rise by 56.6 percentage points of GDP in the next three decades in the original CBO projection. The OBBBA as written would add another 22.6 percentage points to the debt over the same period (see figure 2).
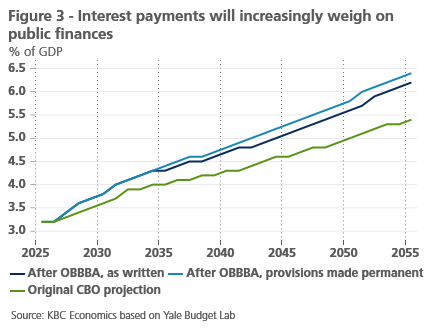
The higher US debt is likely to drive up interest rates. This happens for two reasons. First, as debt increases, there is an increased supply of Treasuries, which the market might have trouble absorbing. Second, rising US government debt raises questions on debt sustainability and pushes up risk premiums on US debt. CDS premia rise when debt to GDP ratios increase. The CBO estimates that a percentage point increase in the debt to GDP ratio raises 10Y Treasury yields by 2.5 basis points. Higher debt and interest rates will drive up interest payments by the US government. The US government already spends more on interest payments than on defense. If OBBBA measures are made permanent, interest payments as a percentage of GDP could double in the next thirty years (see figure 3).
Tariffs could partially cover the costs of the OBBBA
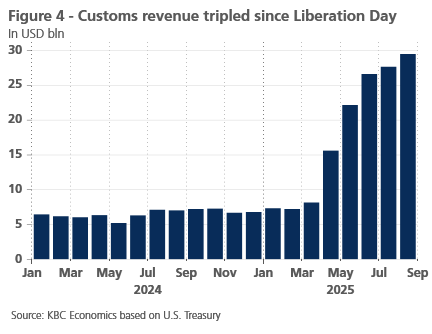
It is important to note that the CBO projections shown above do not include tariff revenues. These have more than tripled since Liberation Day (see figure 4) and could thus partially help finance the OBBBA tax cuts. In a June letter to Congress, the CBO analyzed the potential impact of tariffs on budget deficits. It assumed that the tariffs in place in June (i.e. 10% universal tariff, 30% on China, 25% on non-USMCA compliant goods, and 25% on automobiles, automobile parts, steel and aluminum) would remain in place for the next 10 years. This would reduce US debt by 3 trillion USD over the next 10 years. There is however high uncertainty on tariff revenues given the continuous flip-flopping by the current administration and even the very high uncertainty on the trade policy of the next administration.
Fiscal multiplier likely to be low
Republicans argue that the act will unleash economic growth, allowing debt to GDP ratios to decline. An official White House statement claimed the following: “President Trump’s proven economic formula — historic tax relief, rapid deregulation, balanced trade, and reining in wasteful spending — will slash our debt down to just 94% of Gross Domestic Product (GDP).”
It is certainly true that the act will stimulate economic growth in the short term (compared to a baseline where the TCJA tax cuts expire). That said, though the sums pumped into the economy in the short term are vast, the multiplier on this deficit spending is likely to be quite low, for a multitude of reasons.
First, the act increases the deficits through tax cuts, rather than government spending. Tax cuts tend to have a lower multiplier than government spending, as households tend to save part of the cuts that are offered to them. This is especially the case for richer households, which have a much higher propensity to save than poorer ones. The OBBBA gives larger tax cuts to richer households (see figure 5). According to the CBO, the multipliers of government purchases of goods and services range from 0.5 to 2.5. In contrast tax cuts for lower and middle-income people have a 0.3 to 1.5 multiplier. Tax cuts to higher-income people only have a 0.1 to 0.6 multiplier.

Multipliers also tend to be higher when interest rates are close to the zero lower bound. This was the case for the Tax Cuts and Jobs Act, which was passed during Trump’s first term, but it is not the case now, as the Fed Funds Rate is now at 4.375%. A 2014 IMF working paper1showed multipliers can be up to 4 times higher when rates are close to the zero lower bound.
Another element affecting the multiplier is the debt level. High-debt countries tend to have lower multipliers, as fiscal stimulus could have negative credibility and confidence effects on private demand and the interest rate risk premiums in these countries. One research paper showed that when government debt is high (i.e. exceeding 60% of GDP), the fiscal multiplier is not statistically different from zero in the short term and is negative in the long run2. US debt is currently much higher than 60%. That said, the US remains an exceptional case, given its role as the supplier of the world’s reserve currency. Indeed, despite elevated US debt levels, in its Article IV report last year, the IMF marked the risk of sovereign stress as low, given the international role of the dollar. This factor could limit the negative confidence effects.
One element boosting the multiplier of the OBBBA is the timing of the business cycle. Multipliers tend to be low when growth is high, as economies then typically operate at close to full capacity and have limited ability to absorb new stimulus3. As tariffs are currently weakening the US economy, the OBBBA might indeed provide a compensating stimulus. That said, given the nature of the deficit spending and the current elevated interest rates and public debt, the multiplier is likely to be low overall.
Lower growth in the long term
The Yale Budget Lab made an estimate of the economic impact of the initial House bill (which increased the deficit by 1.1 trillion USD less than the final version). In its analysis, there is indeed an important short-term boost from the increased deficit spending (see figure 6). By 2027, GDP would be 0.6% higher than in the baseline (implying a multiplier of around 0.3 in the short term).
Again, it is important to note that the baseline assumes that the TCJA tax cuts would expire. An expiration of the TCJA tax cuts would have led to a substantial budgetary contraction and could have caused a fiscal cliff. The CBO expected fiscal deficits to decline from 6.2% in 2025 to 5.2% of GDP in 2027 if the TCJA tax cuts were to expire.

In the long run, the growth impact turns negative. The Yale Budget Lab expects US GDP to be 2.9% lower than in the baseline scenario by 2054. It mentions that this is primarily a result of higher interest rates (versus the baseline) caused by the increased debt level and inflationary impact of the act. These higher interest rates would weigh on fixed investments and outweigh the positive effects of lower tax rates. The Penn Wharton Budget sees a larger impact, as it estimates GDP will be 4.6% lower than the baseline by 2054. It assumes that beyond the standard crowding out, foreign take-up of new debt (the most elastic source of debt demand) would decline, given concerns about debt sustainability.
Reduced benefits have an uncertain effect on growth
An element that is not fully captured in these growth estimates is the effect of lower benefits. The OBBBA cuts food assistance (SNAP) and Medicaid spending by respectively, 300 bln USD and 1 trillion USD over the next 10 years, mostly through enhanced work requirements. The CBO estimates 17 million American will lose their health care coverage as a result of this act.
The benefit cuts included in the act could increase hours worked as lower-income workers are likely to work more to compensate for the loss of benefits. The Penn Wharton Budget Model estimates that hours worked will increase by 0.6% versus the baseline by 2034.
However, people who lose their health care coverage tend to lower the intake of preventative medicine and delay treatment when they are sick. This results in adverse health outcomes, which can lower productivity and cause absenteeism. One study showed that an insured worker misses on average 76.54% fewer workdays than an uninsured worker, thus working 5.5 more days in a year4.
Screws on migration will tighten lid on growth
Another element that is not captured in the models is the effect of the act on migration flows. The OBBBA will pour an extra 170 billion USD into strengthening border security and deporting undocumented immigrants. Most of this money will go to two departments, ICE (Immigration and Customs Enforcement) and CBP (Customs and Border Protection), which had combined annual budgets of around 30 billion USD prior to the passage of this act. This act will thus turbocharge the Trump administration’s effort to lower the number of undocumented immigrants in the US.
Even prior to the passage of this act, the Trump administration already made serious efforts to lower undocumented immigration. As border security was tightened, border encounters plummeted (see figure 7). Meanwhile, ICE arrest of undocumented immigrants have surged. Arrests are likely to further increase due to the passage of this act.

This immigration crackdown could have a significant effect on the labor supply, as undocumented immigrants are an estimated 5% of the US workforce. The foreign-born labour force notably declined by 810k year-on-year in August. Historically, the foreign-born labour population has increased by an average of 500k year-on-year. Further declines could be in the cards as spending on immigration enforcement is ramped up.
The Peterson Institute simulated the impact of stricter migration policies on GDP. In its low scenario (1.3 million deported workers), US GDP would be 1.2% lower than the baseline by 2028. In its high scenario (8.3 million deported workers), GDP would be 7.4% lower than the baseline by 2028. The massive CBP and ICE funding increases could bring the US closer to the high scenario. That said, local resistance, especially in Democratic states and cities, will remain a major constraint on deportations.
OBBBA delays decarbonization
Finally, it is important to mention that the OBBBA will also raise greenhouse gas emissions. The act rapidly phases out tax credits and subsidies for, a.o. wind and solar energy, clean vehicles and home efficiency. This will have major implications. In its mid emissions scenario, the Rhodium Group estimates that new law would lower the number of EVs on the road in 10 years by 41 million units, a 34% reduction versus the baseline scenario. It also estimates that new clean capacity additions to the grid would be 62% lower than in the baseline scenario. Overall, US greenhouse gas emissions would be 15% larger as a result of this law.
Conclusion
The OBBBA will have major economic implications. In the short run, it allows the US to avoid a fiscal cliff and even provides a mild fiscal boost to the economy. However, this boost is limited given low short-term multipliers. In the long run, the OBBBA likely lowers economic growth, pushes the debt to unsustainable levels and hinders efforts to combat climate change.
1 “A Simple Method to Compute Fiscal Multipliers”, 2014, Nicoletta Batini, Luc Eyraud, and Anke Weber
2 “How big (small?) are fiscal multipliers?”, 2013, Ethan Ilzetzki, Enrique G. Mendoza, Carlos A. Végh
3 “Fiscal Multipliers: Size, Determinants and Use in Macroeconomic Projections”, 2014 Nicoletta Batini, Luc Eyraud, Lorenzo Fornu, Anke Weber
4 “Health insurance as a productive factor”, 2016, Allan Dizioli, Roberto Pinheiro