
War in the Middle East: Oil and gas prices jump, with gold and the US dollar benefiting as safe havens


In response to the US–Israeli strike on Iran, Brent crude has risen by roughly 9% to around $79 per barrel. Given the scale of the conflict in the Middle East, this remains a comparatively measured market reaction. This reflects, first, the fact that oil prices had already been rising, partly pricing in geopolitical risk, and second, that the oil market does not yet appear to be pricing the worst-case scenario—namely a prolonged, physical disruption to supply.
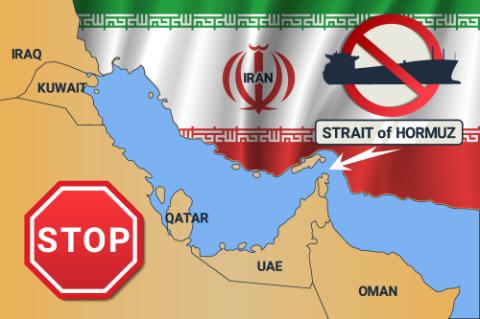
The crucial question for the outlook is how much physical oil production in the Middle East will be taken offline, and for how long. The status of the Strait of Hormuz is pivotal in this regard. For the first time in modern history, transit through the strait has effectively come to a standstill. This is not primarily the result of direct Iranian attacks, but rather a precautionary curtailment driven by a sharp increase in tanker insurance costs for this strategic choke point.
Approximately 20% of global oil supplies pass through the Strait of Hormuz. A sustained blockade would therefore imply a materially tighter market and could push oil prices well above $100 per barrel.
Several factors could, at least temporarily, limit further oil price increases. First, the oil market entered early 2025 with a relatively comfortable surplus of close to 2 million barrels per day, which could partly offset any supply outage in the Middle East. Second, Saudi Arabia and the UAE are able to reroute part of their exports outside the Strait of Hormuz. Third, in the event of a short-lived disruption, the United States could dampen the impact through releases from its strategic petroleum reserves. Fourth, over a 6–9-month horizon, a sustained price spike would likely elicit a supply response from US shale producers.
Beyond oil, there is also a material risk of disruption in the global liquefied natural gas (LNG) market. Qatar is the world’s third-largest LNG exporter, accounting for roughly 20% of global supply; more than four-fifths of its exports transit the Strait of Hormuz and are shipped to Asia (with only around 10% going to the EU). If Qatari LNG deliveries were to fall sharply, prices would likely jump in both Asia and Europe, as the two markets compete for alternative cargoes—most notably from the United States. This adverse scenario is already visible in price action this morning: Europe’s TTF benchmark is up around 20% to €40/MWh, driven by concerns about lower supply.
From a global macroeconomic perspective, the key risk is a renewed rise in inflationary pressures combined with weaker growth. In effect, this would constitute a stagflationary shock—one of several such episodes seen in recent years. The scale of the shock will be determined less by near-term market volatility and more by how far prices rise and how long they remain elevated.
Heightened risk aversion—evident today in a sell-off across equity markets—tends to provide a supportive backdrop for gold, the traditional safe haven, with prices now approaching $5,400 per ounce. A higher geopolitical risk premium is reinforcing the so-called debasement trade, from which gold has benefited for more than a year. The US dollar is also strengthening; historically, shocks of this type—combining higher oil prices with a longer-lasting conflict—have tended to be dollar-supportive.