

The EU-India trade deal: who benefits?


Click here to open PDF

After nearly 20 years of negotiations, the EU and India sealed a free trade agreement on 27 January 2026 in New Delhi. The bilateral deal creates one of the largest free trade areas in the world and embraces nearly two billion consumers. The agreement provides for extensive liberalisation of import tariffs. The EU abolishes tariffs on 90% of tariff lines (91% in terms of trade value). India will do so on 86% of tariff lines (93% in terms of trade value). In addition, both sides will partially liberalise some more tariff lines, bringing the total coverage of trade liberalisation to 99.3% for the EU and 96.6% for India. In this Economic Brief, we estimate the (direct and indirect) impact of the deal on EU economies. For Belgium, which is among the countries where the expected impact is (relatively speaking) high, we also make a sectoral quantification.
What has been agreed
India will open its market mainly to European industrial products, for which the average applied import tariffs currently exceed 16%. Among the highest tariffs currently still levied are those on cars (up to 110%, those on auto parts are lower at 22%). Tariffs on cars will be reduced in two phases: some half will be liberalised upon entry into force of the agreement and the rest gradually over a period of up to 10 years (to a final rate of 10%, with a quota of 250,000). The relatively high tariffs on machinery and equipment, currently as high as 44%, will also be liberalised in two stages.
Tariffs on chemicals, currently as high as 22%, will be largely abolished immediately once the agreement enters into force. On cosmetics, where tariffs also rise to 22%, tariff elimination will follow transitional periods of five or seven years. For plastics, tariffs will be partially liberalised upon entry into force and the rest only phased out over a seven-year period. For textiles and clothing, ceramics and boats, most tariffs will be abolished immediately on entry into force of the agreement.
In the agri-food sector, tariff reductions are more selective but clearly defined. They cover olive oil, processed foods, mutton, alcoholic beverages and non-alcoholic beer, among others. Vulnerable agricultural sectors remain protected. Agricultural products such as beef and chicken, rice, sugar and dairy were excluded from the trade deal. On certain fruits (including pears and kiwis), while tariffs will also be reduced, this will be within certain quotas. Imports from India remain subject to strict European health and food safety standards.
Simulation of effects
The entry into force of the trade agreement will take some time. The texts first have to go through a thorough legal check before the European Commission will initiate the approval process. Then it is up to the EU member states to give the go-ahead, after which the EU and India can officially sign the agreement. Only when after that the European Parliament also gives its blessing will the agreement effectively come into force. Moreover, as mentioned above, part of the tariff cuts will only be implemented gradually in steps.
All this means that the short-term effects of the deal on economic activity will be rather limited. Therefore, in this Economic Brief, we focus on the cumulative long-term effects. We model the direct and indirect effects of the announced measures across EU countries. The direct effects refer to direct trade with India. The indirect effects concern the value added created by the EU country concerned in the supply chain for other countries' exports to India. The phased implementation of tariff reductions is taken into account and we make specific assumptions on the demand response to the resulting price reductions (the so-called price elasticity of demand). The model adopted includes multiplier effects through international production chains using input-output tables and adds an income multiplier.1
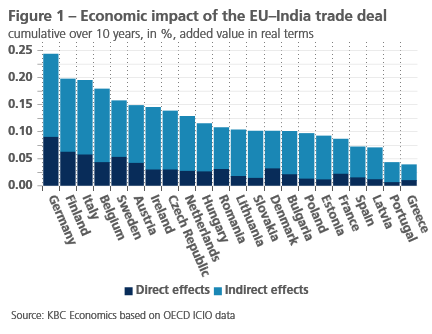
Figure 1 shows the economic benefit of the trade deal for a large group of EU countries, measured as the expected percentage increase in value added in volume terms accumulated over a 10-year period. The simulation shows that, in the group of large countries, Germany and Italy will benefit the most, mainly because of their strong export position for machinery in the Indian market. France and Spain have a significantly weaker position in the Indian market and will therefore mainly benefit only indirectly from the agreement. The agreement is also relatively beneficial for quite a few Central and Eastern European economies, in particular Austria and the Czech Republic. Although these themselves do not have a particularly strong position in the Indian market, they will benefit indirectly from the close trade integration with Germany (including in the automotive sector).
Impact on the Belgian economy
Belgium is among the EU countries where the expected impact is relatively high. This reflects Belgium's relatively large exports to India (as a % of GDP) compared to most other countries. Relative to total exports, India is a small, but not insignificant, trading partner for Belgium. In 2025, India's share was 0.8% of total exports (about EUR 4 billion). This makes India Belgium's 18th most important export market. After the US, China and Turkey, India is Belgium's 4th most important trading partner outside Europe. India's importance in exports did decline significantly over the past decade (see figure 2), mainly due to the sanctions on Russian diamonds, which accounted for a third of Belgium's rough diamond imports before the sanctions took effect. This greatly affected the supply of rough stones to Belgium, which traditionally went from Antwerp to India. Along with diamonds (the tariff on processed diamonds going from 5.5% to 2.5%), chemicals (for which the current 22% tariff will be largely abolished immediately) and machinery and equipment (for which the tariff now rising to 44% will be gradually but significantly reduced) accounted for almost two-thirds of total Belgian exports to India in 2025. Their respective shares were 37%, 16% and 10% in 2025.
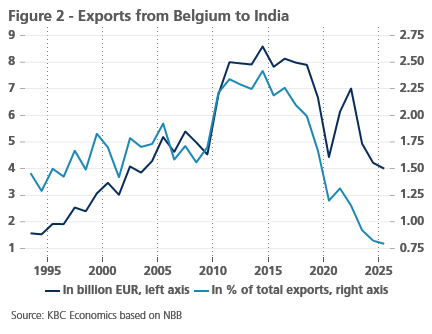
Figure 1 shows that, in addition to the direct trade effect, there is also a relatively large indirect effect for Belgium, largely a result of Belgium's close trade link with Germany. The indirect effect is even three and a half times bigger than the direct one. All in all, for Belgium the positive long-term impact of the agreement is estimated in our simulation at 0.18% of real value added created in Belgium. That in itself is not that much, but it is 0.06 percentage points higher than the (unweighted) average impact across the 27 EU member states. By comparison, the largest effect is for Germany (+0.24%), the smallest for Cyprus (+0.03%).
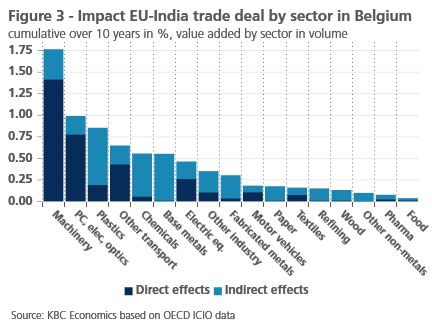
Figure 3 shows the effects (direct and indirect) of tariff reductions in specific manufacturing sub-sectors, measured as the cumulative percentage increase in their real value added over a 10-year period. Irrespective of the tariff reduction or elimination that applies, the quantified impact also depends on India's current importance for value-added created in the sub-sector and the price elasticity of Indian demand for the goods in question. The machinery sector will benefit the most, with an expected 1.75 per cent increase in its value added, with the direct impact being the largest. In the electronics and computers sector, which also benefits greatly from the agreement, the direct effect is also relatively large. By contrast, in the plastics, chemicals and base metals sectors, the indirect effect is mainly large.
With regard to diamonds, we have to distinguish between processed and rough diamonds for the impact of the agreement on added value. The impact concerning processed diamonds is included in figure 3 in the category 'other industry'. It is important to note here that the tariff reduction for natural polished diamonds (from 5.5% to 2.5%) is relatively small compared to that for other product categories. For the rough diamond trade (not included in figure 3), the value added realised in Belgium is limited and it remains uncertain to what extent the agreement will bring additional benefits to the Belgian economy (in terms of real value added). However, for the diamond sector itself, the deal is welcome in light of the losses incurred in recent years due to sanctions on Russian diamonds and increasing competition from synthetic diamonds. On the positive side, the lower tariff on processed diamonds is now structurally anchored and can no longer be adjusted unilaterally by India. In previous years, the tariff was very volatile (between 2% and 7.5%), creating uncertainty in the sector.
Limitations of the analysis
Our simulation suggests that the benefits of the EU-India deal could be large for specific sectors but rather limited for the economy as a whole. That said, the deal is important for the resilience and strategic autonomy of the EU economy. That the EU and India forced a breakthrough in their trade talks is related to the geopolitical situation and the fact that the US has become a more unreliable trading partner. With the deal, the EU and India want to strengthen their position against the US and China. Incidentally, the deal goes beyond classic tariff cuts. It also opens up the Indian services market, including financial services and maritime transport such as dredging services, and could lead to additional FDI flows. In addition, both partners strengthen intellectual property protection and also commit to higher environmental, climate, women's and labour rights standards. A joint platform for cooperation on climate transition will also be set up. Finally, the EU and India are also partnering on defence and security.
Our model-based quantification is only a partial analysis and does not include these wider potential impacts. It also abstracts from the impact of increasing price competition in the European market due to cheaper imported Indian products. For instance, increased imports of cheaper Indian textiles and clothing products may lead to pressure on (and job losses at) European firms in that sector. On the other hand, lower Indian prices in the European market create a real income effect and possibly higher overall consumption. Finally, although the trade deal offers opportunities, effective market access for European companies in India is likely to remain somewhat uncertain even after the agreement. They will undoubtedly continue to face many non-tariff barriers to trade, including slowness and bureaucracy, due in part to a highly fragmented Indian market (28 states that are very different from each other) and a strict hierarchy within private companies.
1 More detail on the model and the assumptions used can be obtained upon request. Input-output tables are matrices showing the values of commodity flows in an economy. They show how industries are interdependent and are often used for macroeconomic impact analysis.