
Belgium more exposed than EU average to Middle East conflict

Click here to open the PDF

The energy shock caused by the war in the Middle East risks having severe economic consequences. However, estimating those consequences is not easy. Apart from the fact that we do not know how long the conflict will last, there is also a multitude of transmission channels, each of which is associated with an uncertain impact. In this Economic Brief, we bring into focus figures on the direct transmission channels, which provides insight into the relative sensitivity of EU countries to the conflict. It shows that the war will not affect all European economies equally. Measures such as the energy intensity of GDP and household energy consumption show that Belgium is relatively more sensitive to the energy shock than the EU average. In terms of direct goods trade with the Middle East, Belgium's exposure is rather average in an EU perspective. Besides the somewhat larger impact on economic growth, the energy shock is also likely to push up Belgian headline inflation more than the European average.
The war in the Middle East represents a severe negative energy supply shock to European economies. It is accompanied by downward pressure on economic growth and upward inflationary pressures. More specifically, the conflict raises serious fears of stagflation, i.e. a combination of stagnant growth (stagnation) and high inflation. How big the impact on growth and inflation will effectively be remains difficult to estimate for now, and depends primarily on the extent to which the conflict escalates further, how long it will eventually last and to what extent damage to energy production capacity is caused.
The impact also depends on the vulnerability of the economy to the shock in question. To get a picture of this, we need to look at the different channels through which the shock impacts on the economy. These are numerous and can be both direct and indirect. For an open economy like the Belgian one, with precarious public finances, the indirect channels can become very important (e.g. should interest rates rise further sharply or more structural damage be done to the global economy). In this Economic Brief, we outline the main direct channels.
Transmission channel 1 - Energy dependency
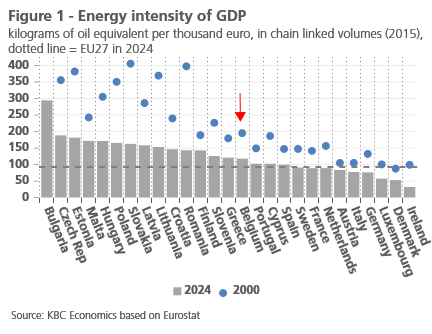
The main direct transmission channel concerns the impact of higher price and lower availability of energy, especially oil and gas. The extent to which these affect the economy depends on the so-called energy intensity of gross domestic product (GDP). This is the amount of energy needed to create one unit of volume of GDP. As the economy has become more service-oriented and the remaining industry has become more energy-efficient, energy intensity decreased in all EU countries in recent decades (see figure 1). In Belgium, however, it remains relatively high, especially compared to neighbouring countries. In 2024, it was still 25.6% above the EU average. In the Netherlands, Germany and France, it was 5.1%, 18.8% and 4.9% below the EU average, respectively.
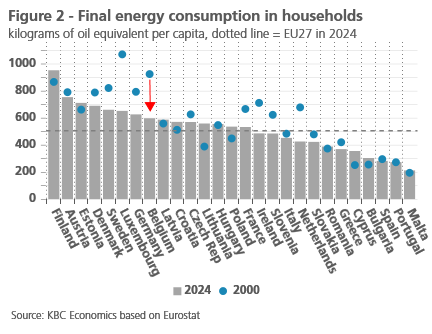
For companies, the energy shock reduces production, to the extent that the lower availability of energy hinders their activity, and reduces profitability, to the extent that they cannot (fully) pass on higher energy prices in their selling prices. The latter may then in turn lead to less investment or, to the extent that activities become loss-making, to their cessation or delocalisation. For households, the shock affects their real disposable income and thus leads to less consumption (unless they reduce their savings rate). The extent of the income effect partly depends on how much energy they consume. In recent decades, households' final energy consumption, expressed per capita, has also declined sharply. In Belgium this was even more than in most other EU countries (see figure 2). But here too, the Belgian figure remains well (18.1%) above the EU average. In the Netherlands and France, consumption was respectively 28.7% and 15.0% below the EU average, in Germany no less than 47.1% above. The real income effect also depends on the extent to which more expensive energy is reflected in the prices of other products (see text box at the bottom of this Economic Brief).
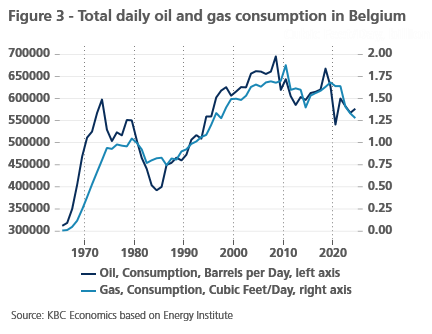
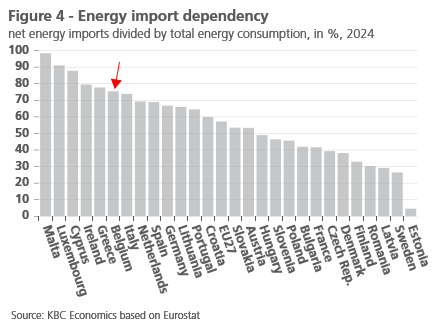
On the positive side, in absolute terms, daily consumption of oil and gas in Belgium has been on a downward trend since 2010 (see figure 3). However, fossil fuels still make up a sizeable share of the total available energy.1 In 2024, that share was 75.6%, compared to 68.6% in the EU. Belgian companies and households are not only relatively more sensitive to the (fossil) energy shock than the EU average, Belgium's energy import dependence is also relatively high from an EU perspective. This is defined as net energy imports relative to total energy consumption. In Belgium, that ratio was 75.4% in 2024. This is well above the EU average figure (57.2%) and also higher than in neighbouring countries the Netherlands (69.3%), Germany (66.7%) and France (41.7%) (see figure 4). The rather high figure makes Belgium relatively vulnerable to lower foreign energy availability.
Transmission channel 2 - Direct trade
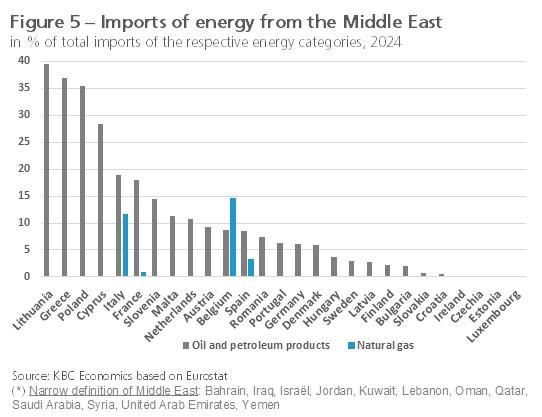
Belgium's direct trade with the Middle East largely consists of imports of mineral commodities, being oil and gas products. Its potentially lower imports are part of the energy supply shock discussed above. Belgium plays a central role as a European gas hub, with mainly transit of LNG gas, which arrives at the Zeebrugge terminal, to Germany and France. In 2024, the Middle East's share of Belgium's total natural gas imports was 14.7%. For oil and other petroleum products, the share was lower at 8.7%, roughly in line with the EU average (see figure 5).
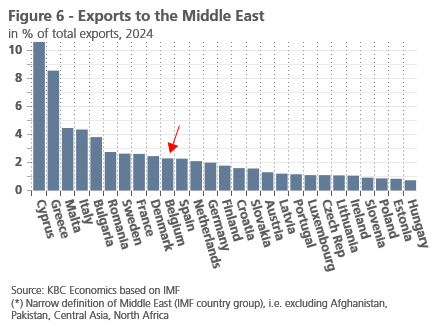
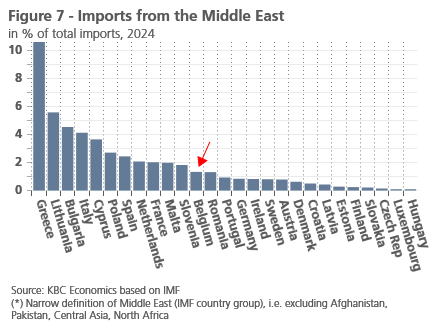
Besides oil and gas, the conflict in the Middle East is also reducing overall goods trade with the region. In 2025, Belgian exports to and imports from the Middle East were EUR 12.1 and 6.7 billion respectively, or 1.9% and 1.1% of Belgium's GDP. Relative to total Belgian exports and imports of goods, respectively, these are 2.4% and 1.4%, roughly in line with the EU average (see figures 6 and 7). In terms of type of goods, Belgium imports from the Middle East, in addition to oil and gas, precious stones and metals, other metals (including aluminium), chemicals, pharmaceuticals and textiles. Belgian exports to the region consist mainly of precious stones and metals, machinery, chemicals, pharmaceuticals, transport equipment and food.
The reduced trade is partly due to the closure of the Strait of Hormuz and the largely halted air traffic with the Middle East. While oil and gas often attract attention, the impact on container logistics is at least as profound. The Persian Gulf accounts for 3.4% of global container volume. Moreover, the conflict will undoubtedly cause reduced demand from the region. Viewed more broadly, the conflict could also lead to serious disruption of broader global supply chains. In recent years, for instance, the Middle East has become an important transit hub for transporting goods between Belgium and Asia. Currently, pharmaceutical companies in Belgium in particular already appear to be suffering from air cargo disruption.
Transmission channel 3 - Confidence
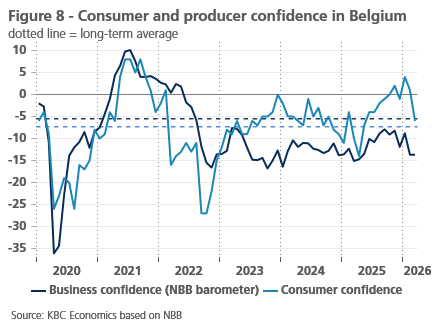
The war in the Middle East may also have an impact on economic activity via an erosion of consumer and business confidence. The conflict comes on top of the already high geopolitical uncertainty caused by the war in Ukraine and the tariff chaos initiated by US President Trump. Persistent and multi-faceted uncertainty tends to make consumers and businesses more cautious in their spending. The effect can be partly psychological. For instance, ample media coverage of the war conflict potentially provokes panic reactions, causing people and businesses to put on the consumption and investment brake. However, the transmission of weakened confidence to effective spending is a complex interplay of factors and thus difficult to estimate. The confidence effect may manifest itself less strongly than expected because of mitigating circumstances (such as government support or the automatic indexation of wages and social benefits).
The latest consumer confidence survey, taken after the start of the war on 28 February, already shows a considerable drop. Business confidence in March barely recovered from February's sharp decline (see figure 8). Should the war in the Middle East continue for some time and/or escalate, confidence is bound to deteriorate further in the coming months. The likelihood of this then spilling over to effective spending becomes ever greater, especially as automatic wage indexation will be capped in 2026 from reaching EUR 4000 gross wages and the government will no longer be able to provide ample financial support to households and businesses due to the plight of public finances.
Estimated impact on GDP growth
What the effects through the various transmission channels will be on economic growth in Belgium remains extremely difficult to estimate. Especially the high uncertainty about the duration of the Middle East conflict plays a role here. After all, it also determines the further course of energy prices, as well as its impact on general inflation (see also the boxed text at the bottom of this Economic Brief). Note that even without the outbreak of the conflict, we would have made limited downward adjustments to our growth forecast for the Belgian economy. Indeed, because the quarterly growth rate for Q4 2025 came out lower (at 0.1%) than in the earlier flash estimate of the National Accounts Institute NAI (0.2%), the statistical spillover from 2025 to 2026 is also lower.2 Moreover, confidence indicators (those in manufacturing in particular) were already deteriorating before the war.
On balance, KBC Economics now assumes real GDP growth in 2026 of 0.6%. In our February scenario, we still assumed that Belgian growth would be 1.1%. This downward adjustment (by 0.5 percentage points) is slightly larger than the one we made for the euro area (by 0.4 percentage points, from 1.1% to 0.7%). For 2027, we assume a gradual growth recovery, this on the assumption that the Middle East conflict is a temporary shock. Nevertheless, we lower the growth estimate for that year too, for the Belgian economy from 1.3% to 1.1% and for the euro area economy from 1.4% to 1.3%.
The outlook mentioned is surrounded by uncertainty that is much higher than usual. The biggest downside risk concerns a further escalation and/or long duration of the war with major damage to local energy infrastructure. The conflict may also lead to bigger-than-expected 'scarring effects' (i.e. permanent damage), to the extent that a termination of the war would nevertheless imply substantially higher energy prices than those before the war. The very high risks with potentially serious economic consequences are yet another wake-up call for Belgium’s still high fossil dependence and an argument for accelerating the energy transition.
Box 1 - Impact of Middle East conflict on Belgian inflation
As with previous shocks, the extent to which the energy price shock caused by the Middle East conflict has an impact on headline inflation will vary across EU countries. That impact depends, on the one hand, on the extent to which higher oil and gas prices impact the energy component in the HICP and, on the other, on the weight of that energy inflation in the HICP.3 Also at play are the price increases of other commodities from the region, such as those of aluminium, helium and fertilisers. The latter threatens to drive up food prices. Helium is important for microchip production. Finally, country differences regarding possible second-round effects (e.g. via rising wages or the pass-through of higher oil and gas prices into a lot of other products) are also at play.
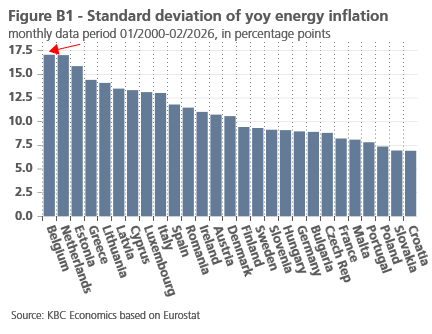
In recent decades, fluctuations in energy price inflation in Belgium have been significantly stronger than on average in the EU. This was especially true during previous periods of energy crisis, such as the one in 2022. Specifically, between 2000 and 2025, the volatility of energy inflation (measured by the standard deviation) was nowhere higher in the EU than in Belgium (see figure B1). This ensured that overall HICP inflation also tended to react more strongly to fluctuations in energy prices. We can assume that this will also be the case this time.
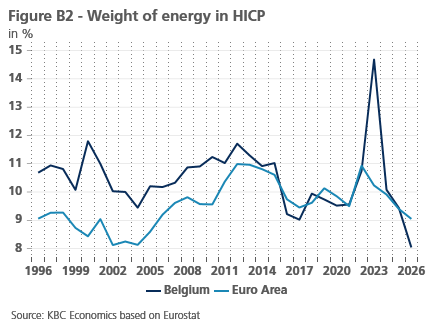
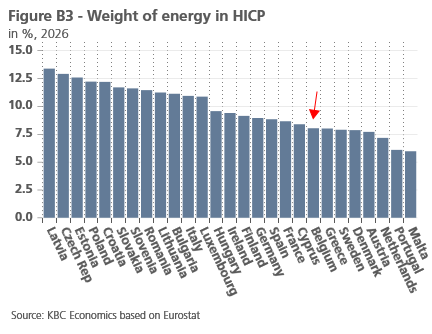
However, the translation of energy inflation into headline inflation is 'softened' by the fact that the weight of energy in the overall HICP, which will be used in 2026, has dropped considerably. Over the past two decades, that weight in Belgium was mostly higher than that applicable for the euro area as a whole. In 2026, it is below (see figure B2) and the weight of energy in the HICP in Belgium is even among the lower figures in the row of EU countries (see figure B3). On the other hand, Belgium is more vulnerable than other European countries to second-round effects due to the mechanism of automatic indexation. This makes price increases translate into higher wages faster than in most EU countries.
On balance, KBC Economics' current outlook (March scenario) assumes that Belgian inflation will average 3.3% in 2026. That is 1.4 percentage points higher than what we had forecast a month earlier (February scenario). For the euro area, we now see overall inflation for 2026 at 2.7% on average, or 0.9 percentage points more than before the start of the Middle East conflict (February scenario). Given that we still assume that the conflict is a temporary shock, we see Belgian and euro area inflation falling to 1.7% and 1.9% on average in 2027, respectively.
1 Note that high energy intensity of GDP (figure 1) or high household energy consumption (figure 2) does not necessarily imply high vulnerability to the current shock. A high share of energy sources other than oil and gas can reduce that vulnerability. For instance, the very high energy intensity of GDP in Bulgaria is accompanied by a lot of power generation through coal and lignite. In Finland, very high energy consumption is accompanied by high consumption of renewable energy.
2 This effect (also called 'overhang') reflects how much of the current year's annual growth has already been acquired purely as a result of quarterly GDP dynamics during the previous year.
3 In all this, the specific functioning of the market for retail energy products also plays a role (e.g. government regulation, the number of fixed versus variable energy contracts,...).