

Economic Perspectives September 2025
Read the full publication below or click here to open the PDF.
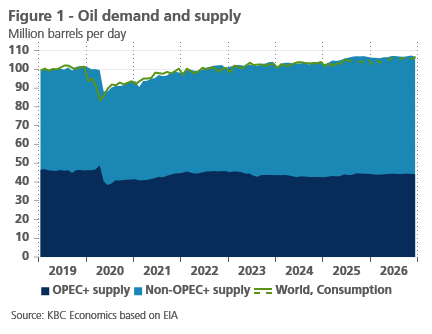
- Oil and natural gas markets are benefitting from ample supply. Oil prices declined by 2% to 67 USD per barrel last month. The consecutive increases of production quota by OPEC+, along with continued increases in non-OPEC+ supply and slow global demand growth are causing oversupply in the oil market. This explains why recent geopolitical events (i.e. sanctions on Russia and Iran, Israeli strikes on Qatar) have such a limited effect on oil prices. European natural gas prices have slightly declined to 31 EUR per MWh as LNG supply from the US is reaching record highs.
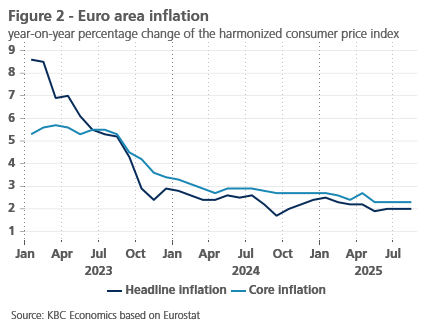
- Euro area inflation remains, as expected, well behaved in August as headline inflation and core inflation remained at 2% and 2.3% respectively. Less negative energy inflation was partly compensated by lower services and food inflation. Goods inflation remained unchanged. Moderating import and producer prices along with lower wage pressures and lingering base effects suggest further easing inflation ahead. We now expect 2.1% inflation in 2025 and expect inflation to drop below target to 1.8% in 2026.
- US inflation is on an accelerating path. Headline inflation increased from 2.7% to 2.9% in August, as food and energy prices showed large increases. Core inflation remained unchanged at an elevated 3.1%. Within core components, shelter prices surprised on the upside as hotel prices recovered and owner-equivalent rents accelerated. Core goods prices also accelerated, though largely because of a big jump in vehicle prices. Evidence of tariff-induced inflation remains mixed for now but producer price inflation at the intermediate production stages seems to accelerate in recent months. Core services (ex. shelter) decelerated last month. Given the upside surprise, we upgrade our 2025 forecast from 2.7% to 2.8%, while maintaining our 2.6% 2026 forecast.
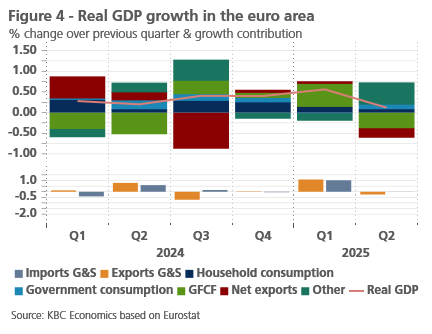
- The euro area economy is starting to feel the heat from higher tariffs amidst strong heterogeneity in growth performance of individual countries. Q2 growth was confirmed at a low 0.1% (both including and excluding Ireland), as net exports and gross fixed capital formations made negative contributions while consumption remains sluggish. There was wide divergence within the euro area, with Spain outperforming again, while German and Italian growth declined in Q2. The labour market remains resilient, however. We maintain our 1.2% and 0.9% forecasts for 2025 and 2026, respectively.
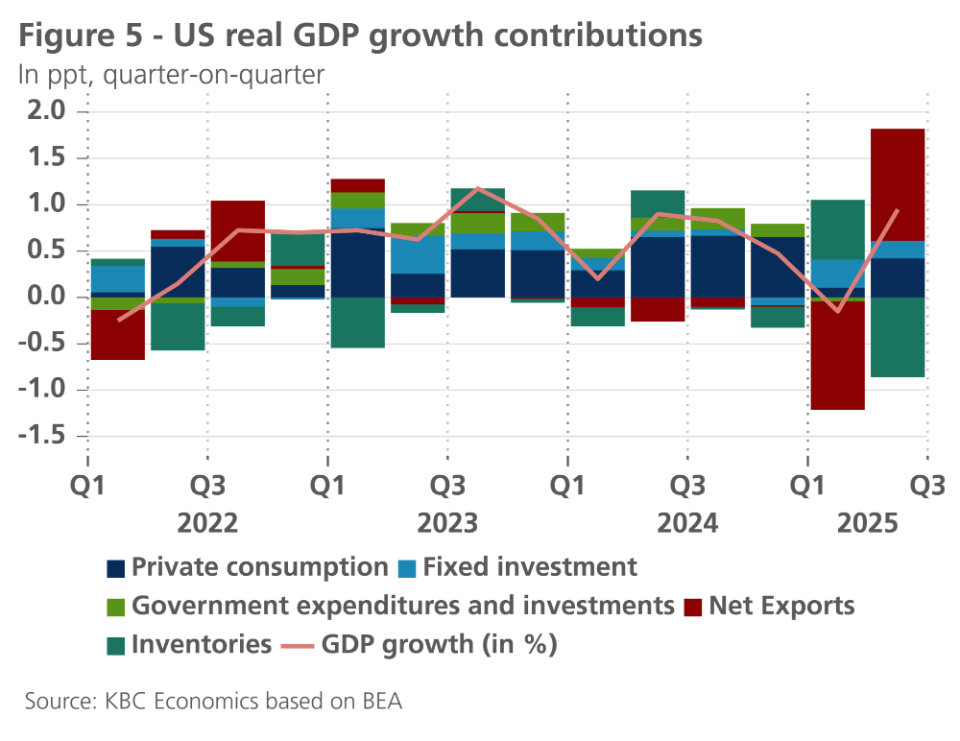
- The US economy is showing signs of resilience. Q2 growth was revised upwards to an elevated 0.95% quarter-on-quarter. This strong growth is set to continue in Q3 as retail sales rebounded and business confidence indicators improved (especially for manufacturing). Though GDP growth remains resilient, labour market data suggest trouble ahead. Non-farm payrolls increased by only 22k last month, while the unemployment rate ticked up to 4.3%. Meanwhile job openings are on the descent. We now expect 1.8% growth in 2025, slowing to 1.5% in 2026.
- Following resilient Chinese real GDP growth of 5.2% yoy in Q2 2025, growth in the coming quarters may face downward pressure from anti-involution measures on top of heightened US trade tariffs. Recent data suggest a slight moderation in activity, but we maintain our forecast of 5% real GDP growth in 2025 and 4.4% in 2026, with risks tilted to the downside.
- Central banks are on diverging paths. Despite lingering downside inflation risks, the rate-cutting cycle of the ECB seems to have ended with a deposit rate at 2%, close to neutral. The ECB views itself as being “in a good position”, as inflation is currently on target. We expect the deposit rate to remain at 2% at least this year and next year. In contrast to the ECB, the Fed restarted its rate cutting cycle by cutting its policy rate by 25 basis points in September, as labour market concerns have overtaken inflation concerns. The dot plots signal more rate cuts to come. We expect 4 more cuts to occur, bringing the cycle low to 3.125% in the first half of 2026.
Global Economy
Last month, the US announced another barrage of tariffs on countries all around the world. These new tariffs lifted the effective US tariff rate to 17.4%, a 15 percentage point increase versus January levels. The good news is that retaliation has been very limited, and that trade policy uncertainty has come down since its historic peak of April.
US protectionism is starting to have a material negative impact on economic growth worldwide. In the euro area, GDP grew by only 0.1% last quarter, as net exports and gross fixed capital formations made negative contributions. As exports in July remained low, net exports are likely to remain a drag in this quarter. Exports to the US are also declining in China. However Chinese exports to other countries are compensating the loss of US exports. Nonetheless, economic momentum is also slowing there as both retail sales and fixed asset investments are sluggish.
The US economy is showing resilience as Q2 GDP growth was revised upwards and consumption rebounded in July and August. That said, strains are emerging in the labour market, where job growth has been lacklustre in the past four months and the unemployment rate is edging up. This could weigh on growth in later quarters.
The labour market concerns have also induced the Fed to start cutting rates (despite continued high inflation). On top of this month’s rate cut, we expect four more rate cuts to occur. This stands in contrast to the ECB where the rate cutting cycle is likely to have reached its end as euro area inflation is on target.
Energy prices under pressure by oversupply
Oil prices declined by 6% to 67 USD per barrel last month. The decline is caused by continued elevated oil supply. OPEC+ recently announced another increase of its combined production quota by 137k barrels from October onwards. This comes on top of earlier increases in the production quota this year. Since May, OPEC+ will have lifted their production quota by almost 2.5 million barrels per day. On top of increased OPEC+ supply, non-OPEC+ countries are also ramping up supply. Output from the US, Brazil, Canada, Guyana and Argentina, in particular, is close to or at all-time highs. The International Energy Agency (IEA) now expects supply to increase by 2.7 million barrels per day (see figure 1). In contrast, oil demand is expected to grow by 700k barrels per day. This leaves the market in oversupply and allows for solid global inventory growth. The IEA expects this oversupply to be maintained in 2026. The current oversupply in the market explains why recent geopolitical events, such as the tightening of sanctions on Russia and Iran and the Israeli strike on Hamas leadership in Qatar, have only had a limited impact on oil prices.
Natural gas prices were also relatively steady in August, declining by 0.5% to a low of 31 EUR per MWh by end-August. As EU gas reserves are now more than 80% full (broadly in line with historical averages at this time of the year) and LNG supplies from the US reached all-time highs in August, prices remain under control. Even the Israeli strike on Qatar, a key European gas supplier, had only minimal effect on European gas prices.
Euro area inflation on target
According to the final estimate, inflation in the euro area remained at 2.0% in August. This means that, for the third month in a row, it was exactly in line with the ECB's target (see figure 2). However, core inflation (inflation excluding food and energy) remained at 2.3% for the fourth consecutive month. While the cooling of services inflation in recent months has been slow (from 3.2% in May to 3.1% in August), the rate of price increases for non-energy goods picked up slightly (from 0.6% in May to 0.8% in August). Food prices in August were 3.2% higher than a year earlier. It is therefore the 2% year-on-year fall in energy prices that has kept headline inflation down to 2%.
Energy prices are expected to continue to exert a downward effect on inflation in the coming months, before supporting inflation from the second half of 2026 onwards. We expect food price inflation to stabilise at around 3%. A further cooling of core inflation is therefore needed to achieve a sustainable stabilisation of inflation at around 2%. The recent stabilisation of core inflation at 2.3% may fuel some doubts about the likelihood of this happening. Nevertheless, a number of leading indicators point to this being in the offing. The annual rate of increase in both import prices and producer prices for consumer goods has declined in recent months. Wage agreements also point to a further decline in the rate of wage increases. Together with accelerating growth in labour productivity, this should reduce the pressure of labour costs on inflation.
We therefore expect core inflation to cool further to around 2% in the second half of the year. Depending on energy price developments, whose volatility tends to disrupt the expected inflation path, headline inflation may temporarily fall slightly below 2% in the course of 2026. We maintain our average inflation forecast at 1.8% for 2026. For 2025, we have raised our forecast by 0.1 percentage point to 2.1%.
US inflation increased again in August
US inflation continued its ascent in August, increasing from 2.7% to 2.9%. The increase was largely caused by big price increases in non-core components. Energy prices rose by 0.7% month-on-month due to a big jump in gasoline prices. Food prices rose by 0.5% month-on-month. This increase was mostly caused by a big increase in meat prices (which have been rising worldwide according to the FAO) and in fruit and vegetables prices. Many products in the latter category (such as tomatoes and bananas) are highly import-dependent and were probably pushed up by higher tariffs. Other imported foods such as coffee and tea saw big price increases.
Core inflation also remained firm, as it was unchanged at an elevated 3.1%. On a monthly basis, core CPI rose by an elevated 0.35%, as both shelter and core goods prices accelerated. Shelter prices increased by 0.4% on a monthly basis. Though this was partly caused by a large rebound in hotel prices, owners’ equivalent rent prices also accelerated. The latter is noteworthy as declining house prices and lower market rents are pointing to a deceleration in this category.
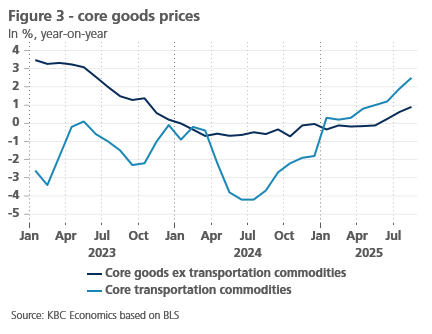
Core goods also accelerated, though it is difficult to tell whether this increase is tariff-related. Most of the increase was caused by an increase in vehicle prices, whose prices had remained subdued in prior months. Aside from transportation commodities, the core goods price increase was rather modest last month (see figure 3). We might see some further acceleration in goods prices in the coming months as tariffs are gradually filtering through. Core goods producer prices have also been firm in the last two months, suggesting increased goods inflation ahead.
Notwithstanding a large rebound in airfare prices, core services (ex. shelter) rose by a modest 0.2%, though the 3-month moving average is still accelerating. That said, decreasing wage pressures bode well for service prices in the months ahead.
All in all, given the upside surprise in food and shelter prices, we upgrade our 2025 US inflation forecast from 2.7% to 2.8%, while maintaining our 2.6% 2026 forecast.
Weaker growth in the euro area
Real GDP growth in the euro area in the second quarter of 2025 reached 0.1% quarter-on-quarter. This is a significant slowdown compared to growth in the first quarter (0.6%). In Q1, growth received a powerful boost from exports to the US in anticipation of higher import tariffs. The downside was that exports of goods and services fell by 0.5% in the second quarter, while imports remained broadly unchanged. This resulted in a strongly negative contribution of net exports. This was not offset by final domestic demand. Growth in private consumption remained extremely weak at 0.1%, while investment in fixed assets actually fell by 1.8%. Only public consumption recorded fairly solid growth (0.5%). Ultimately, strong inventory build-up prevented real GDP growth from turning negative (see figure 4).
Looking at individual countries, the downward revision of the German GDP estimate was particularly striking. Growth was revised downwards from 0.0% to -0.3%. Growth for Italy was also revised downwards, albeit to a lesser extent (from 0.0% to -0.1%). In both countries, the contribution of net exports to growth was particularly negative, while in Germany, investments also declined in Q2. Spanish GDP growth, on the other hand, was revised sharply upwards from 0.4% to 0.7%. Spain is therefore continuing its strong growth momentum, fueled by both household consumption and the recovery of previously sluggish investment demand. Household consumption there is supported by strong employment growth, supported in turn by the relatively smooth integration of the inflow of relatively highly-educated, Spanish-speaking immigrants from Latin America, coupled with new immigration-friendly policies. French GDP growth was also revised upwards: from 0.1% in the first quarter to 0.3% in the second quarter.
In the second quarter, employment in the euro area grew by 0.1% relative to the previous quarter. This growth was mainly due to Spain (0.7%) and a few smaller countries, including Belgium (0.2%). Employment stagnated in Germany and France, while it declined slightly in Italy (-0.1%). Nevertheless, against the backdrop of an ageing population, overall employment growth contributed to the unemployment rate in the euro area falling again to a historic low of 6.2% in July.
The resilience of the labour market remains an important foundation for the expected strengthening of growth as confidence recovers and fiscal stimuli from the German budget are rolled out. The recent approval of the 2025 budget by the German parliament paves the way for this. However, it will probably take until 2026 before these stimuli take full effect. In the meantime, trade tensions with the US, geopolitical uncertainty and structural economic challenges will continue to weigh on growth. Our unchanged growth forecast of 1.2% for real GDP in the euro area in 2025 mainly reflects the strong growth at the beginning of the year and masks, as it were, the zero growth we expect for the third quarter. Despite the expected gradual strengthening of growth from the fourth quarter of 2025 and throughout 2026, the expected average growth rate for real GDP in 2026 will be “only” 0.9% – lower than for 2025, despite the more robust growth momentum expected.
US economy is showing resilience
The US economy is withstanding the pressure from higher tariffs for now. Q2 GDP has been revised upwards to 0.95% quarter-on-quarter (see figure 5). There was a large upward revision to non-residential investments. Within this category, the large increase in software investment (6% quarter-on-quarter) was notable, as it could be an indication of more rapid uptake of AI software services. Personal consumption expenditures were also significantly revised upwards. The upward revisions were partly compensated by downward revisions of government spending and net exports.
Recent data indicate that GDP growth might remain elevated in Q3. This time, growth will be in large part driven by a rebound in consumer spending. Retail sales have been very solid recently, increasing by 0.6% in both July and August. Consumer confidence indicators remain very weak, however, indicating weaker consumer spending in later quarters. In contrast, business confidence indicators have also improved markedly in August, especially in the manufacturing sector. Industrial production data confirm that manufacturing output has been gradually recovering since April.
The major cause for concern comes from the labour market. Total non-farm payrolls increased by only 22k in August. This low figure is not a one-off. During the last 4 months non-farm payrolls only increased by 107k in total, lower than the historical average monthly increases. Though last month’s weak figure was partly caused by a reduction in government jobs, private payroll growth was also weak. The slow job growth is partly a result of the major negative labor supply shock caused by the government’s strict migration policies. According to the BLS, foreign-born labour declined by 810k year-on-year in August.
When labor supply tightens this dramatically, one would expect the number of unemployed to decline and job openings to rise. However, this is not happening. Due to a rise in the number of unemployed, the unemployment rate increased for the second month in a row, reaching 4.3% in August. Job openings are also on a declining trend. They reached 7.2 million in July, down from 7.7 million in May. This indicates that demand for employment is also very weak.
Though this weakness in the labor market is not yet having a significant on GDP figures, we expect that to happen from Q4 onwards. We now still expect 1.8% growth in 2025. However, we forecast growth to slow down materially to 1.5% in 2026.
China’s growth momentum is weakening
Following resilient real GDP growth of 5.2% year-on-year in Q2 2025, recent activity indicators suggest a slight moderation of growth in the third quarter. Momentum in retail sales remains somewhat sluggish, though the figure for August improved to 0.17% month-on-month following a 0.13% contraction in July. Industrial production, meanwhile, remained relatively stable at 0.38% and 0.37% month-on-month in both July and August. Together, these figures point to GDP growth in the third quarter tracking close to 5.0% year-on-year, which would be consistent with still reaching the government’s growth target of 5.0% for 2025 as a whole. Risks, however, are tilted to the downside given important challenges still facing the Chinese economy.
Price dynamics, for example, still point to important deflationary pressures. Core inflation edged up to 0.9% year-on-year in August, but headline inflation fell to -0.4% year-on-year while producer price dynamics remained weak at -2.9% year-on-year. With producer prices declining consistently in year-on-year terms for the past 35 months and weighing on business profits, the authorities have rolled out so-called ‘anti-involution’ measures to address excessive competition that leads to inefficient investment, overcapacity and price wars. These rebalancing measures are already starting to have an impact on the economy, with fixed asset Investment growth dropping sharply from 2.8% year-to-date year-on-year in June to only 0.5% year-to-date year-on-year in August. Meanwhile, credit growth (measured by Total Social Financing), which has been boosted this year by a large increase in government debt issuance, fell back to 8.8% year-on-year in August. While rebalancing to address excess capacity and deflationary price pressures is important, especially as heightened tariffs and trade tensions may weigh on China’s (so far resilient) export performance going forward, anti-involution measures should be complemented by measures to boost domestic demand as a main driver of growth. With the real estate sector still correcting and consumer confidence still at dismally low levels, domestic demand is likely to remain modestly sluggish in the coming quarters. We therefore keep our real GDP growth outlook of 5.0% in 2025 with a slowdown to 4.4% in 2026 unchanged. For headline inflation, we expect an annual average figure of 0% in 2025 with a modest rebound to 1.0% in 2026.
Divergence of monetary policy
At its policy meeting on 11 September, the ECB, as expected, unanimously kept its policy rate, the deposit rate, unchanged at 2%. It currently sees its policy rate at a "good place". We assume that this also effectively remains the bottom of this interest rate cycle. ECB president Lagarde, however, has not yet explicitly confirmed this. She did indicate that the end of the disinflationary process in the eurozone had been reached. In other words, future ECB decisions will remain data-dependent, and will be taken on a meeting-by-meeting basis based on the data available at the time. The central bank reiterated that it does not want to commit to a specific future interest rate path.
The policy decision drew on the update of the ECB economists' outlook. On inflation, ECB staff expects headline inflation to average 2.1% in 2025 (versus 2.0% in June), 1.7% in 2026 (versus 1.6%) and 1.9% in 2027 (versus 2.0%). The path for core inflation (excluding energy and food) remained virtually unchanged. For core inflation, they expect an average of 2.4% in 2025 (unchanged), 1.9% in 2026 (unchanged) and 1.8% in 2027 (versus 1.9%). All in all, this therefore means that inflation is on a sustainable path towards the 2% target, according to the ECB economists.
As for growth, on balance, ECB economists expect resilient growth in the euro area. This is expected to reach an annual average of 1.2% in 2025 (versus 0.9% in June). Expected growth for 2026 is 1.0% (versus 1.1%). The growth forecast for 2027 remains unchanged at 1.3%.
Indeed, based on this scenario, an additional rate cut by the ECB was no longer necessary. ECB president Lagarde indicated that the ECB sees itself in a "good place" with a policy rate of 2%, and that she "wanted to keep it that way". She was referring to the fact that the ECB wants to remain flexible in terms of its future interest rate policy. Since the interest rate decision was in line with market expectations, the market reaction for German bond yields and the euro-dollar exchange rate was rather limited.
Fed resumes its easing path with 'risk management' cut
The bottoming out of the ECB deposit rate contrasts with Fed policy. On 17 September, the Fed resumed its easing cycle, which had been in pause mode since the end of 2024, with a 25-basis-point rate cut. Fed chairman Powell indicated that this may not be a one-off policy action, but rather the beginning of a cycle to eventually bring policy rates back to neutral. In their September update of the so-called dot plots, the FOMC members confirmed their median estimate of neutral interest rates at around 3%. Thus, the current level of the policy rate is still moderately restrictive in the Fed's view, even after the latest rate cut.
The motivation for resuming the easing cycle, despite stubbornly high and even slightly rising core inflation, was the increased downside risks to the US labour market. Fed chairman Powell called it a "risk management cut”. Indeed, it looks increasingly likely that the inflation boost from import tariffs will be temporary (at least according to market expectations), and that longer-term inflation expectations remain anchored around the Fed's 2% target. This is reflected in the dot plots by an increase in expected inflation in 2026, with a decline to near the inflation target in 2027. Weaker monthly job growth and a slowly rising unemployment rate then tilted the Fed's risk trade-off in favour of a limited move of 25 basis points in the direction of neutral. Relative to June's 'dot plots', this accelerates the Fed's downward path of its policy rate to neutral until 2027, but we assume it will occur even sooner. Indeed, according to our forecasts, the most likely scenario is that the Fed has effectively started an easing cycle in steps of 25 basis points for each of the following policy meetings, which will bring the policy rate to its expected bottom of 3.125% by the end of Q1 2026.
Overall, the September dot plots show that the Fed envisages a very soft landing for the US business cycle. For the 2025-27 period, it even raised its growth outlook, while the expected unemployment rate for the end of 2026 and 2027 were revised slightly downwards compared to the June survey.
(Too) strong a euro exchange rate may affect ECB policy
Indirectly, the policy divergence between the Fed and the ECB could also affect the euro exchange rate, which we see appreciating further against the dollar. The resulting disinflationary effect is something the ECB will have to take into account in its future interest rate decisions. However, in our view, this effect alone will not be large enough to prompt the ECB to resume its easing cycle.
Intra-EMU spreads: ECB sees no need to activate its TPI
Recently, upward pressure temporarily increased on EMU sovereign spreads against German government bonds. In particular, the political situation in France, intrinsically linked to the state of French public finances, caught the attention of financial markets. ECB president Lagarde, however, as usual, did not comment on specific developments in individual EMU member states. She did note that according to the ECB, European bond markets are currently operating in an orderly and smooth manner, and market liquidity is good. That comment implies that, until further notice, the ECB sees no problems with the transmission of its monetary policy throughout the eurozone. Consequently, there can be no question of any activation of the Transmission Protection Instrument.
We also keep our view on intra-EMU spreads unchanged. A favourable outlier here is Bulgaria, which is benefiting more strongly than expected from capital inflows in the run-up to EMU membership and the transition to the more liquid euro-denominated Bulgarian government bond market. Consequently, we expect the downward trend in the Bulgarian 10-year spread against Germany to continue faster than expected, falling below 70 basis points by the end of 2026.
Both the Fed and ECB continue their quantitative tightening
Fed chairman Powell sees no contradiction between the Fed's quantitative tightening and its looser interest rate policy. He said the size of the monthly non-reinvestment of assets at maturity is too small to have a meaningful macroeconomic impact on interest rates. Consequently, quantitative tightening will continue 'in the background' until excess liquidity in the financial system is sufficiently reduced from what the Fed describes as 'abundant' to 'ample'.
In the euro area too, market liquidity is gradually being further reduced by quantitative tightening on autopilot, since ECB assets at maturity in its APP and PEPP portfolio are not reinvested. ECB President Lagarde stressed at her most recent press conference in this regard that this deleveraging timeline had been communicated to markets clearly and well in advance and that the impact on bond yields (and thus monetary conditions) is therefore limited, in her view.
US bond yields price cyclical weakening and interest rate decline
Mainly as a result of weaker US labour market data, US 10-year yields priced in a resumption of Fed rate cuts. Consequently, they fell to slightly above 4% in mid-September. The German 10-year rate followed that movement to a limited extent, but without fundamentally interrupting its upward trend.
On balance, our bond yield scenario remains largely unchanged. The German ten-year yield will broadly stabilise around 2.65% for the remainder of this year, and thereafter gradually normalise further upwards to around 2.75% by the end of 2026. Since we are relatively optimistic for the US business cycle, with only an economic stagnation limited to the fourth quarter of 2025, the US 10-year rate will also gradually pick up and reach a fundamental fair value rate of around 4.50% again during 2026.
All historical quotes, statistics and charts are up-to-date, up to 22 September 2025, unless otherwise stated. Positions and forecasts are those of 22 September 2025.