

Economic Perspectives September 2021

Click here to open PDF.
- The global economic recovery remains in full swing, though its pace is set to moderate in the second half of the year as the major economies move past (sequential) peak growth. Overall, we maintain a positive economic outlook, despite new uncertainties around the path to normalisation created by the rapid spread of the Delta variant. In addition, the global economy is facing increasing headwinds from supply chain disruptions. We nonetheless continue to hold the view that these headwinds are mostly transitory and will eventually abate without derailing the economic recovery in advanced economies.
- Euro area economic growth rebounded strongly in the second quarter, driven by an incremental reopening of the economies. Although we look for a moderation in growth in the quarters ahead, the recovery should maintain a solid pace, underpinned by the still strong magnitude of pent-up demand. The recent pullback of some high frequency indicators and the persistent supply-side bottlenecks have prompted us to slightly downgrade our third-quarter GDP forecast. On balance, we have nonetheless lifted our GDP growth forecast from 4.2% to 5.0% in 2021 owing to stronger-than-expected growth in Q2. We maintain our outlook for 4.5% real GDP growth in 2022.
- In the US, economic growth remained buoyant in the second quarter, pushing the economy back above the pre-pandemic level of Q4 2019. With the immediate boost from the reopening behind us, our economic outlook assumes still strong but more moderate sequential growth rates in the remainder of the year. The third-quarter data, however, suggest that we may see a sharper deceleration than earlier envisaged, particularly on the private consumption side. That said, there appears to be an increasing drag from the Delta variant, highlighted by the weak August jobs report. Taking on board recent data, we have downgraded our 2021 growth forecast from 6.5% to 6.0%. In 2022, we expect real GDP growth of 3.9%.
- Inflationary pressures have accelerated considerably over the summer months. In the euro area, headline inflation strengthened to 3.0% yoy on higher energy prices and a mix of technical effects. In the US, there were some possible early signs of a slowdown in price pressures as inflation softened marginally to 5.3% yoy in August, breaking an eight-month run of rising or steady inflation. Although inflation is likely to remain elevated in the remainder of 2021 and somewhat stickier also throughout 2022, we maintain the view that inflation is currently largely driven by transitory factors. Still, there remains a significant degree of uncertainty around the inflation profile going forward, and, while we do not anticipate runaway inflation, the risks to inflation in the coming quarters are tilted to the upside.
- Both the ECB and the FED maintained the ultra-accommodative policy stance at their latest policy meetings. Against the background of still favourable financing conditions, the ECB decided to moderately reduce the pace of net asset purchases under the PEPP in the fourth quarter. We expect the ECB will continue to conduct very easy monetary policy, implying no increase in policy rates within the next two years. In the US, the Fed is moving towards the formal announcement of tapering its asset purchases programme. We assume the Fed will start with a winding down of its asset purchases by the end of 2021, but interest rate lift-off is not expected before the beginning of 2023.
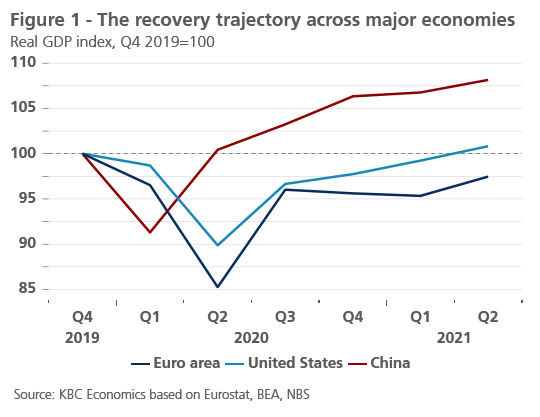
The global economic recovery remains in full swing, as shown by the latest releases of second-quarter GDP data. Major economies are nonetheless at different stages of the recovery trajectory, reflecting divergent pandemic and vaccination developments, as well as variations in policy support (figure 1). To begin with, the US recorded another robust growth performance in the second quarter, driven by early progress with vaccination and a massive fiscal impulse. After two quarters of contraction, the euro area rebounded at a surprisingly strong pace amid progress in controlling the pandemic and a gradual reopening of the economies. Finally, China’s economic recovery is already in its advanced stage as the growth momentum peaked in late 2020 and economic activity is now slowing on a sequential basis.
Growth peaked in the US and the euro area
Looking forward, we expect the pace of the recovery to remain strong but to moderate somewhat in the second half of the year. That is to say, both the US and the euro area move past peak growth as the reopening effects dissipate, implying still above-potential but slower sequential growth rates. Meanwhile, China’s growth is expected to normalise further on the back of some regulatory tightening, exacerbated by the recent drag from the Delta variant. In general, emerging markets are set to see particularly uneven recovery paths from the pandemic. Some of the less developed economies will be the weak links in the global economy, as lagging vaccinations and limited policy support leave them firmly in the grips of the virus (also see KBC Emerging Markets Quarterly Digest: Q3 2021).
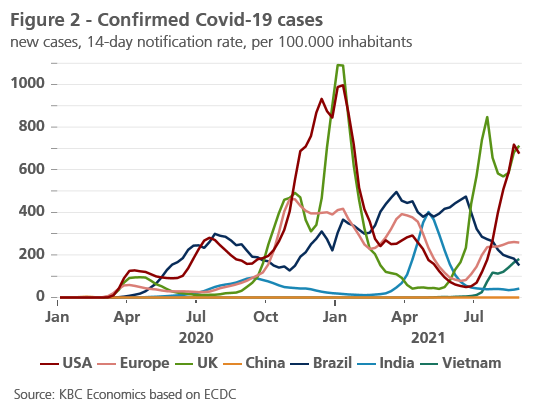
Overall, we maintain a positive economic outlook, assuming that the expansion has further to run despite being past peak growth in most major economies. At the same time, we acknowledge that the rapid spread of the Delta variant of Covid-19 has become the key concern for the global economy, creating new uncertainties around the path to normalisation. The highly transmissible Delta strain has become the dominant variant globally as it spreads quickly not only in emerging markets but also in some advanced regions with an already high level of immunisation. As a result, the recent turn upward in global infections signals that a third pandemic wave has begun (figure 2).
Higher vaccination rates reduce the need for lockdowns
On a positive note, the recent data from countries with high vaccination coverage indicate that the link between new cases and hospitalisations/deaths has weakened materially (figure 3). Importantly, this has allowed policymakers to avoid strict lockdown measures while maintaining the capacity of the healthcare system. As vaccine rollout progresses further across advanced economies, we expect policymakers to respond relatively modestly to rising infections. In the euro area, a somewhat more cautious approach is likely, but we do not expect a major setback in the reopening of the economies. US policymakers are set to show even more tolerance despite the geographical variations in vaccination coverage which largely explains why, on the aggregate US level, the disconnection between the infection rate and the hospitalisation rate is clearly less prevalent.
Despite lingering virus-related risks, we remain confident that the Delta variant will not derail the economic recovery in advanced economies. So far, mobility indicators have held up well, although the spread of the Delta variant appears to be an important catalyst for some pullback in business and consumer sentiment in the US, and to a lesser extent in the euro area (though following exceptionally strong gains earlier). While recognising that the surge in new cases may lead to some voluntary social distancing and curb activity in contact-intensive services, we view the economic risks arising from the Delta variant as manageable, provided soaring infections rates do not spur the emergence of a new strain that becomes (more) resistant to existing vaccines.

Supply-side headwinds to the recovery
In addition to the rapid spread of the Delta variant, the global economy is facing increasing headwinds from supply chain disruptions (also see KBC Economic Opinion of 9 September). Against the background of strong demand conditions, many manufacturers are unable to increase output fast enough due to pandemic-induced production cutbacks, input shortages (e.g., essential raw materials and most prominently semiconductors), and surging shipping costs. All this appears to be holding back industrial output and weighing on growth in major economies – particularly those with a strong industrial backbone – as reflected by the Q2 GDP data. Furthermore, supply-side bottlenecks are also having a material impact on consumer prices, fuelling near-term inflationary pressures.
We continue to hold the view that most of the supply-side bottlenecks are transitory – as well as related upward price pressures – and will abate as supply conditions normalise. This is already seen in commodities such as lumber with prices now back to pre-pandemic levels. Admittedly, such a degree of self-correction may take longer in other sectors; for example, in the semiconductor industry where supply is relatively slow to adjust, it will likely take several quarters for the supply tightness to fully normalise. In addition, as economies continue to reopen, spending is gradually shifting away from consumer goods and towards services, helping further improve the supply-demand mismatch.
While there are signs that supply chain disruptions have peaked in several sectors, we expect supply constraints will likely last longer than initially envisaged due to the spread of the Delta variant in Asia, where lockdown measures have been reintroduced or tightened in recent months. Against the background of the low vaccination coverage, and with some Asian countries pursuing zero-Covid policies, new outbreaks have led to temporary factory and port closures. Each setback in the reopening, therefore, raises the risk of negative spillovers to other regions of the world economy, potentially leading to longer – if not more intensified – supply chain disruptions.
A strong rebound in the euro area
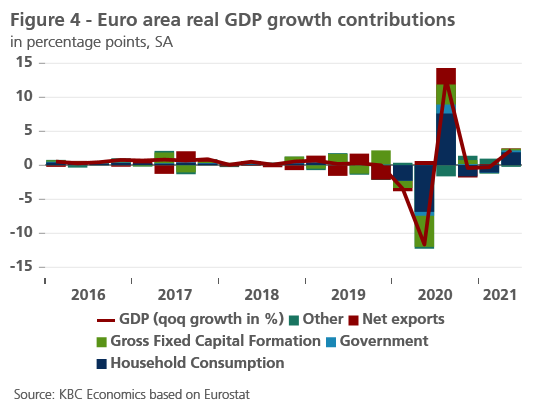
The euro area started this year in the grip of the recession, but economic growth rebounded strongly in the second quarter. According to the final estimate, the euro area economy expanded by 2.2% qoq, significantly exceeding consensus (and our) expectations (figure 4). As most euro area countries went through an incremental reopening in Q2 2021, the economic rebound was driven by stronger-than-expected consumer demand, most markedly across services. While the Q2 GDP print suggests that the euro area is now firmly on the path to full recovery, its output remains some 3% below the pre-crisis level.
At the country level, Spain and Italy saw particularly boomy growth in the second quarter, both recording significant upside surprises of 2.8% qoq, and 2.7% qoq, respectively. However, Spain remains the main recovery laggard in the euro area with output still down almost 7% compared to the pre-pandemic level. In France, real GDP grew by 1.1% qoq, while Germany’s growth came out at 1.6% qoq. That said, Germany is the only major euro area economy where the Q2 GDP outturn disappointed (albeit moderately), reflecting the adverse impact of supply chain disruptions on key sectors of German industry. Importantly, Europe’s largest economy is also heading to the polls in late September (see Box 1: Unique German federal elections).
The euro area has now likely moved past its peak growth and we look for a moderation in growth in the quarters ahead. The recovery should nonetheless maintain a solid pace, underpinned by still strong magnitude of pent-up demand, which is consistent with the recent high frequency indicators.
On the industrial side, production increased by 1.5% mom in July following a soft patch in the second quarter. In August, the manufacturing PMI index in the euro area hoovered at a historically elevated level but pointed to softening momentum (61.4 from 62.8 in July). Despite full order books, industrial output continues to be hampered by unprecedented supply-side bottlenecks, and while there are tentative signs of easing (as seen in the peaking of supplier delivery times), they are unlikely to be resolved soon.
Against this background, most of the heavy lifting in terms of sequential growth in H2 2021 will come from the strong performance of the service sector. In July, retail sales, however, disappointed with a 2.3% mom drop as the reopening effect weakens. In addition, the lingering concerns about the Delta variant appear to weigh on consumer confidence in the euro area, though the latest readings remain historically elevated. Similarly, the August services PMI index suggests continued robust expansion, yet at a somewhat weaker pace (59.0 from 59.8 in July).
Overall, this all bodes well for the economic outlook in the euro area, but the recent headwinds prompted us to slightly downgrade our Q3 2021 GDP forecast. On balance, we have nonetheless lifted our GDP growth forecast from 4.2% to 5.0% in 2021 owing to stronger-than-anticipated growth in Q2. Our updated growth profile implies that the pre-pandemic level of euro area output will be reached in Q4 2021. Thereafter, sequential growth is set to decelerate further, yet still remain above its long-term average with the help of the NGEU funds (see Box 2: Fit for 55: a concrete climate proposal). As a result, we expect euro area GDP growth at 4.5% in 2022.
Box 1: Unique German federal elections
On 26 September 2021, the federal general election for the next German Bundestag (Lower Chamber) will be held. This election will be unique in post-war German political history for several reasons.
For the first time, the incumbent Chancellor, Merkel, does not seek re-election in a regularly scheduled election (although in the past, some chancellors resigned during their term). This implies that none of the candidates enjoy the usual ‘Chancellor’s popularity bonus’. This adds to the unusual degree of uncertainty.
Second, these are the first elections with three plausible candidates for the Chancellorship, Mr Laschet for the Christian Democrats, Ms Baerbock for the Greens and Mr Scholz for the socialist SPD. This is a reflection of the ongoing fragmentation of the political landscape into a group of small or medium-sized political parties. Almost certainly, a coalition of three parties is needed to obtain the required overall majority in parliament (Figure B2.1). Hence, this is the first election with a large number of possible and realistic government coalitions as an outcome, in contrast with previous elections. Those were contested by two more-or-less clear-cut political ‘camps’ (centre left and centre right), often with an explicit pre-election coalition commitment. The upcoming government formation will, on the other hand, be fully open-ended.
Finally, as a result of the need for a three-party coalition, the new coalition will not be known on election night. The multitude of possible coalitions means that the negotiations are likely to last long, possibly well into 2022.
Main economic programmes in a nutshell
In the 2021 election, the main topic appears to be the continuity, experience, and competence of the respective candidates, and only to a lesser extent the differences in the various party programmes. The Greens’ policy priority is to address climate change by higher carbon pricing, reduction of European emission certificates and fiscal incentives to reallocate private investments. With respect to fiscal policy, the Greens propose an annual public investment budget of about 1.5% of GDP, financed by new public debt after a reform of the (constitutionally enshrined) debt brake and an end to the ‘Schwarze Null’ budget policy. The CDU/CSU essentially proposes continuity of current policies, including fiscal policy. The SPD has a favourable view on European fiscal integration, but like the CDU/CSU, wants to preserve the ‘Schwarze Null’ and the debt brake. However, the SPD has far-reaching proposals with respect to a European dimension for fiscal policy. These include further plans for an EU wide unemployment re-insurance and follow-up programmes to the current Next Generation EU programme (NGEU). Other SPD proposals include increasing minimum wages, higher top income tax rates, a re-introduction of the property tax and a cap on housing rents.
What coalitions will be possible?
The current opinion polls imply that, in order to become chancellor, candidates will not only need to win the election, but also the subsequent negotiations. If the current polls, which have been quite volatile since the beginning of 2021, materialise, no less than 6 plausible coalitions are possible. The only political certainty is that no party is willing to cooperate with the extreme-right AfD. According to the current polls, the next government will most likely be a centrist coalition, either led by the SPD or the CDU/CSU. Numerically, the following 6 coalitions are likely to be possible.
A continuation of the current ‘Grand Coalition’ led by the SPD is possible if Die Linke does not reach the threshold of 5% of the national vote, leading to a reallocation of their parliamentary seats. Alternatively, the ‘Grand Coalition’ could be supplemented by either the Greens or the liberal FDP.
Two more coalition options consist of the Greens and the FDP together, led by either the SPD or the CDU/CSU. Both options will almost certainly be feasible, illustrating the fact that the choice of chancellor may well be made by the junior coalition partner, regardless of who will be the biggest partner. The challenge for these two types of coalitions would be to find a compromise between the diverging fiscal agendas of the Greens and the FDP.
The final possible coalition option is an outright left-wing government formed by the SPD, the Greens and Die Linke. This coalition is however unlikely, since it would only have a slim majority in parliament. Hence this coalition would be unstable, which would be problematic given the sceptical policy stance of Die Linke towards cooperation within Nato and the EU.
To conclude, given the many possible combinations of coalition partners, it is impossible to make a reasonable forecast of the next government’s economic policies, except that it is most likely to be a centrist government, providing continuity, and probably led by the SPD or the CDU/CSU.
Market implications
The negotiations after election day will probably take unusually long, possibly well into 2022. Uncertainty will be high since different coalition options will probably be explored. This should however not come as a surprise to bond markets in the light of the current polls. Therefore, markets have probably already discounted this period of uncertainty. The immediate market reaction on election day will therefore probably be negligeable. However, in the unlikely case of the left-wing coalition (SPD, Greens and Die Linke), with a structurally more accommodative fiscal policy stance, German bond yields may come under some upward pressure.

Robust growth in the US
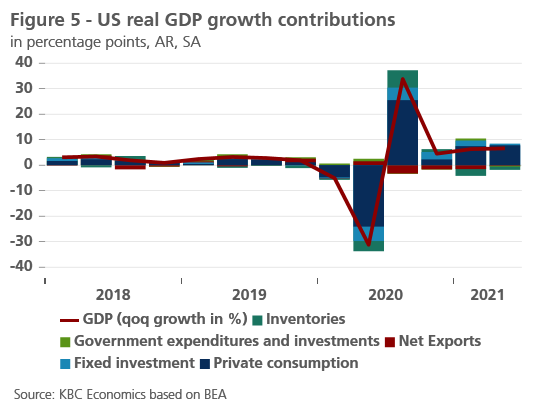
The US has recorded another quarter of robust economic performance which pushed the economy back above the pre-pandemic level of Q4 2019. Real GDP growth accelerated to an annualised rate of 6.6% in the second quarter, coming out below market expectations (figure 5). Looking at the details, private consumption was the main driver of growth with gains across goods and services amid ongoing reopening. In contrast, inventories were a large drag on growth, likely reflecting production shortfall due to the supply-side bottlenecks. Similarly, residential investment contracted sharply as rising building material costs and labour market shortages held back construction.
Box 2 – Fit for 55: a concrete climate
proposal
The release of the European Commission’s ‘Fit for 55’ climate package coincided with a renewed global focus on the climate crisis. Though the COVID-19 pandemic has naturally taken front stage for most of 2020 and 2021, severe weather worldwide over the summer months was a stark reminder of the monumental climate challenge still facing the world. EU policymakers have taken the lead in this challenge, introducing their proposed policy pathway to reach carbon neutrality by 2050, with an intermediate goal of reducing greenhouse gas emissions in 2030 by 55% relative to 1990 levels1.
The proposed policy package, which now needs to be negotiated and adopted, could have significant implications for several sectors of the economy as well as for many households. Most of the policies are aimed at reducing carbon emissions, including through higher carbon pricing, higher targets for renewable energy, increasing EU carbon sinks, and new regulations for transportation (ranging from emissions standards for cars to fuel requirements for the maritime and aviation sectors).
Specifically, one of the main pillars of the package includes important reforms to the EU Emissions Trading System (ETS) such as a further one-off reduction of the emissions cap and an increase in the annual reduction of that cap (from 2.2% to 4.2%) so that by 2030, emissions will be 61% lower than in 2005. Other reforms include phasing out free allowances for the aviation sector by 2027, phasing the maritime shipping sector into the ETS over three years, and creating a separate ETS starting in 2026 for road transport and buildings.
In order to prevent carbon leakage, where production is moved abroad to avoid higher domestic costs, the European Commission also proposes introducing a Carbon Border Adjustment Mechanism (CBAM). The CBAM would initially apply to specific products (cement, iron and steel, aluminium, fertilisers, and electricity) and would require importers to purchase certificates covering the carbon price that would have been paid had the goods been produced under the EU ETS (adjusting for any carbon pricing applied outside the EU or free allowances given within the ETS). The proposed CBAM would be phased in over a transitional period, becoming fully operational in 2026.
All of these changes imply higher carbon prices going forward (for more information, see KBC Economics Research Report: The Future of Carbon Pricing). While the new ETS (for buildings and road transport) would regulate upstream suppliers, higher carbon pricing for those sectors would likely also increase costs downstream for households and smaller businesses. In acknowledgement of this, the European Commission proposes a new Social Climate Fund that would allow Member States to support investments in energy efficiency, new heating and cooling systems and low-emission mobility, with a specific focus on supporting the most vulnerable households, micro-enterprises and transport users. This fund would be financed primarily by revenues coming from the new ETS.
Redistribution of such revenue has been shown to be a key factor in assessing the net welfare impact of climate policies such as higher taxes.2. While the overall GDP impact of higher carbon prices is often estimated to be marginal, the direct inflationary impact on households will likely depend on several factors, including the successful funding and distribution of the Social Climate Fund, improvements in energy efficiency and other technologies, and overall investment in the climate transition.
1 EU economy and society to meet climate ambitions (europa.eu)
Going forward, we expect the pace of US growth to remain strong, driven by private consumption. With the immediate boost from the reopening behind us, our economic outlook assumes a slowdown in sequential growth rates in the remainder of the year. The latest third-quarter data, however, suggest that we may see a sharper deceleration than earlier envisaged, particularly on the private consumption side.
In July, retail sales were substantially weaker than expected, recording a 1.8% drop amid fading stimulus effects and the moderation in disposable income. In addition, there appears to be an increasing drag from the arrival of the Delta variant which is reflected in a broad decline across consumer sentiment readings. The August University of Michigan's consumer sentiment index, for example, marked the lowest reading since the onset of the pandemic. On a similar note, although business activity in the services sector remains well established in expansionary territory, it has eased sharply over the last couple of months with the services PMI index down from the May peak of 70.4 to 55.1 logged in August.
At the same time, industrial production rose by 0.8% mom in July, driven mainly by durable goods manufacturing. The good news is that industrial output has now finally surpassed the pre-pandemic level and manufacturers are making some headway in ramping up production despite ongoing supply frictions. The August ISM manufacturing report indeed suggests that factories are gaining traction in catching up with demand amid rising output and a shift to stockbuilding. On the flip side, supply chain disruptions (albeit tentatively easing) remain a major limiting factor, likely extending well into next year.
On the labour market, the August jobs report saw a sharp deceleration in employment growth with non-farm payrolls rising by 235,000, nearly half a million below market expectations. The disappointment in jobs growth was located in the leisure and hospitality sectors, reflecting the resurgence of the virus that reduced demand for these activities and/or made workers more reluctant to return to the labour force. Altogether, employment remains 5.3 million below pre-pandemic levels, still pointing to significant pandemic-related slack. The unemployment rate did ease from 5.4% in July to 5.2% last month, although some of the improvement in unemployment reflects notably lower participation in the labour force than was the case pre-pandemic. While the labour market outlook remains uncertain, we see a reason for near-term optimism as the expiration of extended unemployment benefits and an easing virus drag may boost job growth in the coming months.
All in all, taking on board recent data, we have revised our Q3 GDP forecast moderately downward. Coupled with weaker-than-expected Q2 GDP growth, this has led us to downgrade our 2021 growth forecast from 6.5% to 6.0%. Next year, we expect real GDP growth of 3.9% (marginally up from last month) with growth momentum moderating further from exceptionally high levels. While we believe that fiscal policy will remain accommodative (yet not to the same extent as in early 2021), the fiscal outlook remains one of the biggest uncertainties with respect to next year's growth projections.
Strong inflationary pressures
Inflationary pressures have accelerated considerably over the summer months. Headline inflation has reached more than a decade high in both the euro area and the US, significantly above the central banks’ target (figure 6). Since early 2021, the rise in inflation has been mainly driven by higher energy prices and base effects from weak or falling prices in 2020 that have yet to fully run their course. Another inflation boost is coming from the reopening of economies, in particular, the sectors severely hit by lockdowns where prices are normalising from depressed levels. Finally, unprecedented supply-chain disruptions have led to a surge in pipeline price pressures and robust core goods inflation across advanced economies.

While we note that inflation is likely to remain elevated in the remainder of 2021 and somewhat stickier also throughout 2022, we maintain the view that that inflation is currently driven mostly by transitory factors. That is to say, we expect price pressures to moderate eventually as the energy base effects turn more favourable (with an expected stabilisation in oil prices), the disruptive effects of the pandemic ease (i.e. once ‘opening up’ is completed), and supply bottlenecks start to abate. Importantly, the recent surge in inflation has not dislodged inflation expectations, which we view as another argument in favour of the temporary nature of the currently elevated inflation prints.
However, we acknowledge a significant degree of uncertainty around the inflation profile going forward, and, while we do not anticipate runaway inflation, the risks to inflation in the coming quarters are clearly tilted to the upside. The pandemic developments remain critical with this respect as recently seen in the rapid spread of the Delta variant in Asia. That said, any major setback in the reopening is likely to lead to longer – if not more intensified – supply chain disruptions and related higher cost-push inflation.
In the euro area, headline inflation surprised to the upside and rose to 3.0% yoy in August from 2.2% yoy a month ago, driven by a further increase in energy prices. Core inflation strengthened from 0.7% yoy to 1.6% yoy on a mix of technical effects such as delayed summer sales period in France and Italy, as well as the German VAT reduction. We expect euro area headline inflation to remain firm in the remainder of the year, supported by demand and supply-side factors, and accompanied by supportive technical effects (e.g., the effect of HICP basket weight changes), before gradually easing from early 2022. Overall, we have raised our inflation outlook to 2.2% in 2021 (+0.2 pp) and 1.7% in 2022 (+0.2 pp).
In the US, headline and core inflation have been elevated for some time now. That being said, in August there was softening in headline inflation to 5.3% yoy in August from 5.4% yoy in July breaking an eight-month run of rising or steady inflation. Importantly, the monthly dynamics have also slowed, with core inflation increasing by just 0.1% mom in August—its smallest increase since February 2021. The easing in inflation in August was notably assisted by the partial reversal of price hikes due to ‘opening up effects’. Nevertheless, given the recent upside surprises, we have upgraded the US inflation outlook, now expecting annual inflation to accelerate to 4.3% in 2021 (from 3.8% previously) before easing to 2.4% in 2022 (from 2.2% previously).
A ‘look-through’ position of central banks
Despite the recent strengthening in inflationary pressures, central banks on both sides of the Atlantic maintain ultra-accommodative monetary policies, reflecting the judgement that such pressures will prove transitory. At the September policy meeting, the ECB decided to moderately reduce the pace of net asset purchases under the PEPP in Q4 2021. This decision comes against the background of still favourable financing conditions and upgrades in the central bank’s growth and inflation projections. In addition, ECB President Lagarde insisted that the reduction in PEPP purchases does not amount to the beginning of tapering and should be seen as a recalibration of a tool designed to flexibly counteract the pandemic emergency. President Lagarde also announced that an important discussion about the future of the ECB's QE policy toolkit will come at the December meeting.
We expect the ECB will not extend PEPP purchases beyond March 2022. At the same time, our assumption is that (part of) any remaining PEPP portfolio will be ‘transferred’ to the Asset Purchase Programme (APP) to achieve a more gradual decline in bond purchases. Overall, we hold the view that the ECB is set to conduct very easy monetary policy throughout our forecast horizon, meaning that the potential end date for the net purchases under the APP, as well as the start of the normalisation of policy rates is not expected before 2023.
In the US, the Fed also left its ultra-accommodative monetary policy stance unchanged at its July meeting. The July FOMC minutes nonetheless confirmed that the tapering discussion is now fully underway, and many of the participants consider it appropriate to begin the phasing-out of the asset purchases programme in the coming months, with differences in thinking as to the precise timing. Since the Fed has made the start of tapering conditional on having achieved ‘substantial further progress’ on the labour market, the weak August jobs report may somewhat dampen the enthusiasm from several of the more hawkish Fed policymakers for an immediate start. On the other hand, we believe that the jobs report was not weak enough to derail a tapering announcement by the Fed in September.
Against this backdrop, we continue to hold the view that the Fed will start with a winding down of its asset purchases in Q4 2021. The Fed will likely first reduce the mortgage-backed securities purchases (currently at USD 40 billion a month) before starting to taper its Treasury purchases (currently at USD 80 billion a month) in order to help manage risks of overheating in the US housing sector. At the same time, we assume that the Fed will wait for full tapering of the asset purchases before preparing rate hikes, implying that the interest rate lift-off is not expected before the beginning of 2023.
Alle historische koersen/prijzen, statistieken en grafieken zijn up-to-date, tot en met 10 september 2021, tenzij anders vermeld. De verstrekte posities en prognoses zijn die van 13 september 2021.