

Economic Perspectives October 2025
Read the full publication below or click here to open the PDF.
- Ample supply and easing tensions in the Middle East are putting downward pressure on energy prices. Oil prices declined by 3% last month to 66 USD per barrel. The decline is largely supply-driven as OPEC+ has again increased its production quota and non-OPEC+ supply remains at elevated levels. The geopolitical risk premium has also diminished, thanks to the Gaza ceasefire agreement. Natural gas prices remained broadly unchanged at 31 EUR per MWh. High US LNG supply is putting downward pressure on gas prices, but this is compensated by the relatively high gas demand as EU countries are still refilling gas reserves.
- Euro area inflation accelerated from 2.0% to 2.2% year-on-year in September. The increase was, as expected, primarily due to less negative energy inflation, as base effects start kicking in. Food inflation moderated slightly. Core inflation remained unchanged at 2.3% as core goods inflation remained unchanged and services inflation increased slightly. In the coming months, lower oil prices, along with lower wage pressures, might weigh on inflation figures. We maintain our 2.1% and 1.8% forecasts for 2025 and 2026, respectively.
- In the US, in line with CPI inflation, PCE inflation accelerated again in August from 2.6% to 2.7% year-on-year. Here as well, the increase was primarily caused by less negative energy inflation, though higher food inflation also played a role. Core PCE remained unchanged as core goods and core services inflation stabilized. As the September CPI release is delayed by the US shutdown and the August PCE report was in line with expectations, we keep our inflation forecast unchanged at 2.8% in 2025 and 2.6% in 2026.
- The euro area economy is on a very gradual path to recovery. Producer confidence indicators have gradually improved, though they remain at low levels. The labour market also remains surprisingly resilient as the unemployment rate remains low. However, the German economy is not yet out of the doldrums, as industrial production remains sluggish. The French government crisis is also weighing on French and European confidence indicators. We maintain our 1.2% and 0.9% growth outlooks for this year and next year, respectively.
- The US economy is continuing to show surprising resilience in the face of high tariffs and increased migration restrictions. Q2 GDP saw major upward revisions and high consumer spending and strong investment is likely to keep growth elevated in Q3. That said, challenges are mounting as the savings rate looks too low, the government is in shutdown and the labour market is weakening steadily. Furthermore, a large part of H1 investment growth is caused by an AI-driven boom, which might contribute less in coming quarters. We thus adjust our 2025 growth forecast from 1.8% to 1.9%, while maintaining our 1.5% 2026 forecast.
- The economic outlook for China is little changed compared to last month as the economy continues to muddle through. Though the 5% GDP growth target for 2025 remains in reach, risks are tilted to the downside, with growth expected to slow to 4.4% in 2026.
- Central banks are on different trajectories. The Fed restarted its rate cutting cycle in September given labour market concerns. We expect another four rate cuts, with the policy rate ending at 3.125% in March. Meanwhile, the ECB is likely to maintain its deposit rate at 2% for the foreseeable future as inflation is close to target in the euro area. The bond markets have been challenged by political instability in France. French spreads are likely to remain elevated as political uncertainty is likely to remain present going forward. The French turmoil also put pressure on the euro. We expect this downward pressure to be temporary as the euro remains fundamentally undervalued versus the US dollar.
Donald Trump’s trade war shifted into slower gear last month. Though Trump announced increased tariffs on non-generic pharmaceuticals, kitchen cabinets, bathroom vanities, furniture and trucks, their implementation has been mostly delayed. Furthermore, even if they would be fully implemented, they would only increase the US effective tariff rate minimally (from 17.4% to 17.9%). However, the most recent 100%-tariff threat on Chinese imports poses new risks to global trade. For now, however; we consider this tariff threat more a strategic move ahead of eventual US-Chinese (re)negotiations than a genuine re-escalation of the trade war.
The trade war’s detrimental effects are slowly becoming visible. In the US, the labour market is weakening, prompting the Fed to resume its rate cutting cycle (despite accelerating PCE inflation). In the euro area, the trade war is slowing the on-going (very gradual) recovery. The government crisis in France is another cause for concern there. China’s economy is also sluggish, as the private sector remains cautious and is in deleveraging mode. Its 5% economic growth target is still in reach for this year, however.
Energy prices under further pressure
Oil prices continued their descent as Brent oil prices declined by 3% last month to 66 USD per barrel. Oil prices are now 11% lower than a year ago. The descent in oil prices is mostly supply-driven. Earlier this month, OPEC+ announced another 137k barrels per day production. Since April, OPEC+ raised its production quota by 2.67 million barrels per day. Furthermore, non-OPEC+ supply remains at elevated levels, leaving the market oversupplied in aggregate.
Lower geopolitical tensions in the Middle East have also contributed to lower oil prices. On 29 September, Donald Trump and Benjamin Netanyahu set out a 20-point plan for peace in Gaza. On 8 October, Israel and Hamas signed off on the first phase of the plan, which consists of a ceasefire, the release of remaining Israeli hostages, a prisoner exchange, a partial withdrawal of the Israeli military and a surge in humanitarian aid. This could set the stage for a more durable end to the war in Gaza (Phase 2 of the plan), though many obstacles remain. Nonetheless, this ceasefire agreement is an important first step and significantly lowers the risk of a wider conflict in the Middle East.
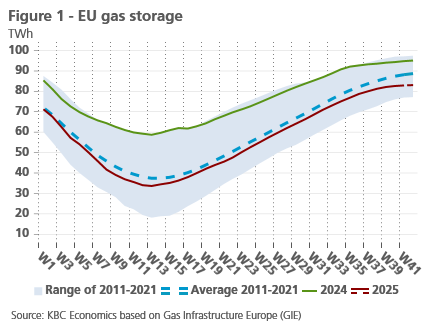
Lower tensions in the Middle East also relieves pressure on natural gas prices. European natural gas prices remained broadly unchanged last month, finishing at 31 EUR per MWh. The market remains well supplied as American LNG is imported at record levels. Gas reserves remain somewhat below historical averages, however (see figure 1).
Disinflation in the euro area (almost) over
In the euro area, after three months of being on the 2% target, inflation rose slightly again in September to 2.2%. This was due to less negative energy price inflation (-0.4% compared to -2.0% the previous month). Food price inflation fell slightly to 3.0%, while core inflation (inflation excluding energy and food prices) stood at 2.3% for the fifth month in a row.
Viewed over a longer period, the period of disinflation or cooling inflation appears to be over. Since mid-2024, inflation has fluctuated between 1.8% and 2.5% (see figure 2). Since June 2024, it has averaged 2.2%, which is exactly the most recent figure.
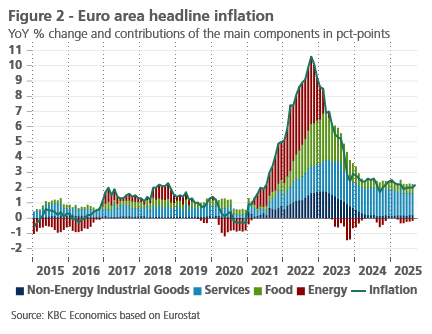
However, with 2.2% headline and 2.3% core inflation, the inflation rate is still slightly above the European Central Bank's (ECB) medium-term target. A look back at the contribution of the main components to inflation shows that the contribution of services in particular is still significantly higher than in the three years immediately preceding the pandemic and the subsequent energy price shock. The contribution of non-energy goods and food is also slightly higher than it was then, but to a lesser extent. Given their lower weight in the consumer price index, this is less important, especially since inflation in 2017-2019 remained stubbornly below the ECB's target: 1.5% on average and even only 1.0% for core inflation. Slightly higher inflation than at that time therefore seems desirable, at least from the perspective of the ECB's target. However, the current pace of services inflation – which has by far the largest weight (45.6%) in the consumer price index – is not compatible with that target.
Yet, especially for services, disinflation is probably not over yet. Wage agreements point to a further slowdown in wage growth, which is a key driver of services inflation. Together with stronger labour productivity growth, this should ease labour cost pressures on inflation and on corporate profit margins.
We therefore expect core inflation to cool further to around 2% by the second half of 2026. Depending on energy price developments, whose volatility, as in the past (see figure 2), tends to disrupt inflation trends, headline inflation may thereby temporarily undershoot the 2% target in the course of 2026. We maintain our forecast for average inflation at 2.1% for 2025 and 1.8% for 2026.
US PCE inflation accelerates in August
As, for now, the US government remains in shutdown, the release of the September CPI report has been postponed. The last major inflation-related release was the August PCE data. In line with the August CPI release, PCE inflation accelerated from 2.6% to 2.7%. On a monthly basis, PCE inflation increased by 0.3%. The increase is mostly due to an acceleration in non-core components as both food and energy saw large month-on-month price increases.
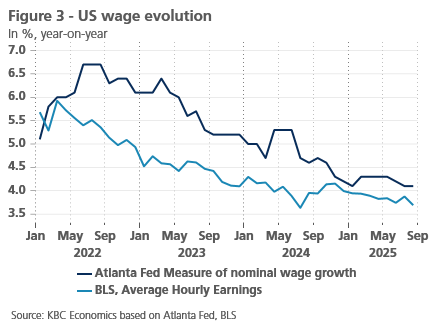
Core PCE inflation remained unchanged at 2.9%. Core goods inflation remained unchanged at 1.1%, thus showing limited evidence of tariff passthrough. Core services inflation also stabilised. We might see some softening in this category in the months ahead, given declining wage pressures (see figure 3). Given that PCE inflation was in line with expectations, we keep our inflation forecasts unchanged at 2.8% this year and 2.6% next year.
Waiting for clear signs of growth recovery in the euro area
The composite index of purchasing managers' confidence (PMI) in the euro area improved further in September to 51.2. It has been above 50 since January 2025. This is the threshold that differentiates between economic growth and contraction. However, it is not very far above that threshold. Moreover, the improvement in September was only noticeable in the service sectors. In manufacturing, the indicator fell just below the threshold again (49.8), and in construction it weakened to 46, well below the threshold. The European Commission's surveys on business confidence also paint a mixed picture: from a slight weakening of confidence in the service sectors to, at best, a stabilisation at a low level in industry and construction. Consumer confidence has also remained largely stagnant in recent months, at a level that can only be associated with sluggishness.
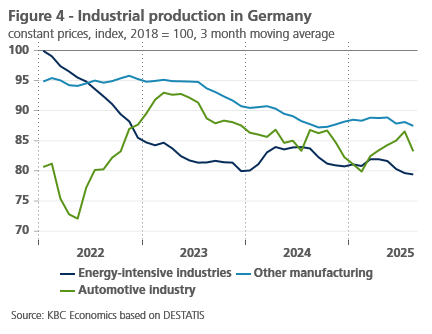
We are thus still waiting for clear signs of a (strong) economic recovery. Against this backdrop, the significant deterioration in sentiment among both businesses and consumers in France is noteworthy. The political malaise risks taking a toll on the country’s economy. Meanwhile, German industrial indicators remain disappointing as production continues to trend downward. In energy-intensive sectors, it recently fell to more than 20% below the 2018 average, while the recovery in car production in the first half of 2025 currently appears to be stalling (see figure 4). It is also discouraging that, after the improvement in the first half of the year, German business expectations for the next six months are once again gloomy, not only in the manufacturing industry, but in virtually all sectors with the exception of construction.
A number of reasons still point to a gradual strengthening of economic growth in the euro area, however. At 6.3% in August, the unemployment rate was only 0.1 percentage points above its historic low. The resilience of the labour market is also visible in the growth in both the number of jobs and hours worked in Q2. Together with additional, limited, real wage increases, this boosts disposable household income and creates potential for consumption growth. The consumption boost could receive additional impetus from a decline in the household savings rate, which is currently still particularly high in most euro area countries. Such a decline could help offset the expected negative impact on disposable household income of the consolidation of public finances in many countries this year. On that matter, recent ECB estimates suggest that fiscal policy in the euro area will be slightly expansionary for the euro area as a whole in 2026, thanks to NextGenerationEU transfers, especially in southern countries, and strong investment impulses from the German budget. Together with the easing of monetary policy since June 2024, budgetary policy is thus accommodating the efforts to tackle structural economic problems. It also offers some counterweight to the headwinds that are likely to continue to blow from the external environment due to geopolitical tensions and trade barriers.
Despite the uncertainty, we therefore maintain our expectation of a gradual strengthening of economic growth in the euro area as from the last quarter of 2025 and especially in the course of 2026. The expected average real GDP growth rate in 2026 will nevertheless be lower than in 2025 (0.9% vs. 1.2%). The latter figure mainly reflects the strong growth at the beginning of 2025 and masks the slowdown we have seen since then.
US economy overperforms in Q2 and Q3
The US economy is showing surprising resilience in the face of higher US protectionism. Q2 GDP was revised upwards from 0.75% quarter-on-quarter in the initial release to 0.95% in the latest release. This increase was mostly the result of a big upwards revision of the personal consumptions expenditures (PCE) contributions (from 0.25% to 0.42%). For Q3, consumption is likely to make an even stronger contribution. Real PCE increased by 0.4% month-on-month in July and August.
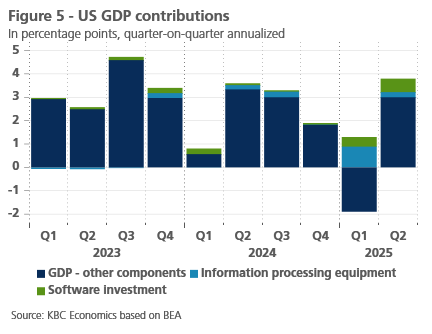
The strong Q2 and Q3 figures seem to indicate that the protectionist US policies are only having a limited impact on US growth. Yet a closer look at the data suggests that the high growth figures are partially driven by a strong AI boom. Indeed, if we exclude AI-related components (i.e. information processing equipment and software investment) H1 GDP growth would drop from 1.6% to 0.55% in annualised terms (see figure 5).
These elevated AI-related contributions might wane somewhat in the coming quarters. Furthermore, consumption could also weaken in Q4. Indeed, as real PCE growth outpaced real disposable income growth, the savings rate dropped from 5.7% in May to 4.6% in September, a level that seems hard to sustain. Consumer confidence also declined again in September. The ongoing shutdown and announced layoffs might also temporarily lower consumption by federal employees, though the effect on GDP has historically been quite muted. Consumption aside, there has been significant deterioration in business confidence indicators last month, especially in the services industry.
The most concerning aspect of the economy is the deterioration in the labour market. Though the official employment report has not been published because of the shutdown, the ADP report (a private report) pointed to weakness in the job market. According to this report, private payrolls declined by 32k in September on top of a (downwardly revised) 3k decline in August. Though this labour market weakness hasn’t had much effect on GDP growth yet, that could change in the coming quarters. All in all, we slightly upgrade growth this year from 1.8% to 1.9%, while maintaining our 1.5% growth forecast for next year.
China’s economy muddles through
The economic outlook for China is little changed compared to last month given a lack of decisive data that move the needle one way or the other. The economy continues to muddle through, with a good chance of GDP growth reaching the government’s 5% target for 2025, though risks remain to the downside. In August, momentum in industrial production and retail trade stabilised somewhat at 0.37% month-over-month and 0.17% month-over-month, respectively. However, in year-over-year terms, both series dipped lower in August (5.2% and 3.4%). Other hard data also point to sluggish growth. Credit growth (total social financing) remains overwhelmingly supported by government bond issuance while fixed asset investment, which fell to 0.5% year-to-date year-over-year in August, is kept positive only by state-owned enterprises, together suggesting that the private sector is still cautious and deleveraging.
One brighter signal for the Chinese economy of late has been an improvement in business sentiment, particularly the S&P PMIs for manufacturing and services (51.2 and 52.9, respectively in September, where anything above 50 represents expansion). Meanwhile, external trade holds up well despite the higher tariffs imposed by the US, with total exports growing 8.3% year-over-year in September. Though exports to the US have declined markedly (-27% year-over-year), the decline has been offset by a substantial increase in exports to other regions.
Trade tensions remain an important risk, however, with significant uncertainty surrounding an expected meeting between President Xi and President Trump later this month. China’s more stringent export controls recently imposed on rare earth minerals, and a threat by Trump to increase tariffs on Chinese exports to 100%, are, at least in part, strategies to gain leverage for negotiations ahead of the meeting, but they do raise the risk of the US-China trade conflict once again spiralling into an avalanche of tit-for-tat measures.
Chinese leaders will also meet internally to prepare the next five-year plan for China, though details on the country’s long-term strategy will likely not be released until March 2026. For now, we maintain our forecast of 5.0% real GDP growth in 2025 and 4.4% growth in 2026. Inflation remains bogged down by deflationary impulses and is expected to average 0.0% in 2025 and 1.0% in 2026.
Fed resumes rate cuts
As expected, the Fed resumed its easing path in September, cutting its policy rate by 25 basis points to 4.125%. That is still a moderately restrictive level. This ‘risk management’ rate cut was prompted by increasing downside risks to the labour market in light of recently weaker monthly net job creation and the (moderate) rise in the unemployment rate to 4.3% in August. This development takes place against the backdrop of an inflation rate that is still about one percentage point above the 2% target, but probably only temporarily so.
We continue to assume that the Fed has started a cycle of interest rate cuts of 25 basis points each at each of the next four policy meetings. Hence the policy rate will settle at 3.125% in March 2026; a level which the Fed considered neutral in its most recent September ‘dot plot’. The fact that policy rates are unlikely to fall below neutral is consistent with our expectation that the US business cycle and labour market will have a very 'soft landing'.
The ECB's deposit rate has already bottomed out
Unlike the Fed, the ECB policy rate is already "in a good place", according to ECB president Lagarde. While underlying core inflation is still slightly above the 2% inflation target at 2.3%, it will continue to converge towards the inflation target in the coming quarters barring additional economic shocks. We therefore expect the deposit rate at 2% to have reached its bottom in this interest rate cycle and to remain unchanged at that level for quite some time.
Due to the divergence of interest rate policy between the Fed and the ECB, the interest rate differential will move in favour of the euro against the dollar. Consequently, we expect a gradual further appreciation of the euro. Moreover, this expectation is supported in the longer term by our assessment that the dollar is still fundamentally overvalued at its current exchange rate.
Bond yields in an upward trend
Against the backdrop of the soft expected landing of the US economy, we no longer assume that US 10-year yields will see another drop in the short term. Moreover, the expected Fed rate cuts have been fully priced in by the bond markets by now. For US 10- year bond yields, this scenario implies a gradual and moderate rise to around 4.20% by the end of 2025 and to 4.50% by the end of 2026. German 10-year yields will also continue their gradual upward trend, mainly driven by the further decompression of the term premium. By the end of 2025, German 10-year rates are likely to be around 2.75%, rising slightly further to 2.80% during 2026.
France in focus of European bond markets
A notable development in European bond markets has been the rise in France's 10-year government bond spread against Germany. That spread rose to the spread level of Italy and was even briefly above it. This was due to the country’s entrenched political impasse resulting in the resignation of the new prime minister Lecornu in early October as he failed to form a new government and pass a 2026 budget through parliament. The underlying cause of this political paralysis is a deadlock in parliament where none of the three major political blocs have a workable majority. That structural problem will not disappear in the near future. Possible new parliamentary elections will not necessarily provide a solution but could rather create additional political uncertainty. Moreover, we are gradually approaching the presidential elections in spring 2027, with a highly uncertain outcome.
As a result of this environment of persistently high political risk, we expect the current French 10-year spread of around 85 basis points to remain at that relatively high level until after the presidential election. An intervention by the ECB via an activation of its Transmission Protection Instrument (TPI) is not in the cards. Indeed, according to ECB president Lagarde, European bond markets remain sufficiently liquid, function properly and the transmission mechanism of ECB monetary policy is not compromised. In other words, the conditions for a TPI activation have not been met at this stage.
Apart from the specific French situation, we confirm our general view on the evolution of intra-EMU interest rate spreads. This implies a further moderate spread decline due to the expected economic recovery in Europe, the further rise of the German benchmark yield and, as the ultimate safety net, the ECB's TPI. This convergence scenario was recently explicitly confirmed in the upgrade of the Portuguese sovereign credit rating by Fitch (to A) and S&P (to A+), as a result of the favourable business cycle outlook and the policy efforts made with respect to public finances.
All historical prices, statistics and charts are up to date as of 13 October 2025, unless otherwise stated. The positions and forecasts provided are those of 13 October 2025.