

Economic Perspectives October 2020

Read the full publication below or click here to open the PDF.
- Recent high frequency indicators suggest that the global economy saw a continuing rebound from the pandemic lows over the summer months. The more positive tone of hard economic data unfortunately goes hand in hand with less convincing sentiment indicators of late, signalling that the economic momentum is losing steam, in particular as the second wave of Covid-19 pandemic is spreading rapidly. The underlying theme of our outlook is, therefore, as follows: a somewhat stronger third quarter, but a less upbeat fourth quarter. Overall, we maintain a cautious outlook given the significant uncertainty caused by the trajectory of Covid-19 with the risks tilted to the downside on balance.
- In the euro area, the recovery that started at the end of the second quarter progressed further during the third quarter, as is clearly visible in retail sales growth and industrial output growth. However, the near-term growth profile is weak on the back of the virus’s resurgence. Consequently, we updated our growth forecasts for the euro area as well as for individual European economies with, generally speaking, slightly higher growth for 2020 and slightly lower growth for 2021.
- Stricter containment measures have been adopted in many countries, in particular in France and Spain where a growing number of new cases is likely to cause a rising drag on the economy. Germany, on the other hand, has been more successful with virus control, adding to the existing cross-country divergence within the euro area. Other Western and Southern European countries take a position in the middle. The Central and Eastern European region is at the epicentre of the second wave of Covid-19 too, prompting more restrictive measures, and ultimately putting the recovery under pressure.
- Meanwhile, Brexit negotiations are heading to a critical point. We maintain our longstanding view that a limited trade deal can be concluded by the end of this year. Even if such mini-deal is far from perfect, avoiding the cliff scenario of a no-deal Brexit would be the best outcome in order to avoid a further slowdown in the recovery pace.
- A stronger-than-expected rebound is also expected for the US, which leads us to upgrade our outlook for annual real GDP growth in 2020 from -5.5% to -4.5%. However, the recovery is losing steam heading into year-end with the expiration of government support measures and additional fiscal stimulus unlikely before the November presidential elections. In addition to coronavirus developments, this represents a major source of uncertainty, in particular stemming from the possibility of a contested election result. This could have negative implications for both the US economy, as well as for financial markets worldwide.
- China remains on a remarkable post-Covid-19 recovery path helped by developments on both the manufacturing and services sides of the economy. Given the relative strength of high frequency data of late and the fact that the pandemic there remains mostly under control, we have revised up Chinese GDP growth to 2.0% in 2020 and 8.2% in 2021.
- Our oil price outlook was revised downward on demand weakness and rebalancing of the market taking longer to unwind the supply glut than initially expected. Against this backdrop, as well as due to the continued disinflationary impact from the pandemic and the expected further weakening of the USD, we have reduced projected euro area inflation in 2020 to 0.3% and to 1.1% yoy in 2021. In the US, disinflationary pressures are notably less pronounced as a large part of the inflation dynamics is made up by the ‘covid-insensitive‘ categories. As a result, the US inflation outlook for 2020 and 2021 is unchanged at 1.1% and 1.9% yoy, respectively.
Over the summer months, the global economy saw a continuing recovery from the lows of the first half of the year when the Covid-19 pandemic emerged. Data releases across the major advanced economies were relatively upbeat with some upside surprises, implying a somewhat stronger bounce back from the economic damage caused by the spring lockdowns than expected in our last edition. These positive developments reflect first and foremost gains from opening up economies, supported by massive policy actions, both on the fiscal and monetary front. Therefore, it should come as a no surprise that the upcoming third-quarter real GDP figures will show impressive growth dynamics (on the quarter-on-quarter basis). Both the euro area and the US are set to follow the general growth pattern of China, a global frontrunner in terms of the post-lockdown recovery.
At the same time, upcoming Q3 real GDP readings should be treated with caution. Indeed, the figures will provide merely a glance in the rearview mirror. As such, a strong rebound was essentially mechanical, reflecting the one-off boost from economies opening up, meaning that the pace is not sustainable going forward. Additionally, notwithstanding the strong bounce-back, major advanced economies have so far seen only a partial recovery in many sectors, ranging from services to manufacturing, where the activity remains well below the pre-virus level. After the low-hanging fruit was picked, full normalisation of economic activity thus appears more difficult. Furthermore, the forward-looking sentiment indicators already signal that underlying momentum is losing steam going into the final quarter of the year. In particular the recovery in services activities appears to be challenging.
A second wave of Covid-19 spreading rapidly
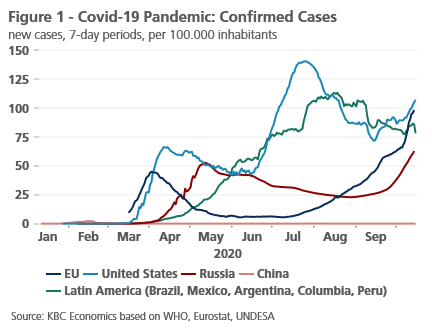
For this reason, we now project a bumpier road ahead with a pace of growth visibly weaker in the last quarter on both sides of the Atlantic. Among the most prominent factors behind these headwinds is the situation on the epidemiological front. Worldwide, the number of confirmed Covid-19 cases has now passed 37 million and a death toll of more than 1 million. With the exception of China, the second wave of the virus has been spreading fast across the globe, not least in Europe which has seen a rapid resurgence of the virus (figure 1). In many European countries the number of new daily cases has surged above the level recorded in March and April, bearing in mind that comparison is distorted due to the more robust testing capacities now available. In contrast, the death rates remain generally lower than during the first wave of coronavirus.
Even though a second wave is now unfolding rapidly in Europe, we do not see the same policy response as during the first wave. Governments appear reluctant to re-introduce full-blown national lockdowns because of the damaging socio-economic impact. Instead, most are opting for localised lockdowns and targeted restrictive measures to tackle the spread of the virus. In essence, the authorities are again facing a difficult balancing act with implicit trade-offs; on the one hand, protecting public health, on the other hand, limiting the adverse impact on the economy and personal welfare, and by extension, political backlash. In our baseline scenario, we maintain the assumption that the full lockdowns will be avoided. However, given the upcoming winter season in the northern hemisphere when people spend more time indoors, which increases the chances of the transmission, we cannot rule out this possibility.
But even if the spring-like lockdowns are avoided, we see a negative impact on the activity, especially in the ‘social-consumption’ sectors such as hospitality, entertainment or tourism. A surging number of new cases have already prompted more restrictive measures (e.g. earlier closing times or an outright closing of restaurants and bars, banning large gatherings and events, closing schools) across Europe, including major economies like France, Spain and the UK. Meanwhile, the likes of Germany and Italy have been coping with the second wave of the virus comparatively better so far, though even there new infections are again on the rise. In that regard, we continue to signal that the ability to tackle the virus is set to remain an important source of cross-country divergence, adding to the differences in economic structures or fiscal responses.
Overall, our economic outlook remains cautious given the substantial uncertainty caused by the trajectory of the pandemic. To flag the similarly uncertain strength and path of the economic recovery, we maintain three scenarios, i.e. the baseline (a slow but steady recovery), the pessimistic (a protracted and slower recovery potentially disrupted by setbacks from the virus) and finally the optimistic (a swift recovery with minimal structural damage to the economy). Apart from corona-related risks, there is a full plate of additional downside risks, namely the US November Presidential elections, a no-deal Brexit, the geopolitical clash between the US and China or the most recent conflict in Nagorno-Karabakh, involving regional powers such as Turkey and Russia.
Euro area recovery in progress, but the near-term outlook is less upbeat
In the euro area, the economic recovery progressed further in the third quarter, following a record fall in the previous three months. Available hard data suggest a stronger rebound than initially envisaged with a more upbeat picture in the retail sector. After a sluggish July print of -1.8% month-on-month, August witnessed a surprising uptick by 4.4% mom. One part of the explanation for this surge lies in the change of the timing of summer sales in some countries (e.g. France and Belgium); the other reflects a pent-up demand from further easing of containment measures over the summer. This is indeed good news as it suggests that a non-negligible part of corona-induced increased savings was forced by lockdowns and other restrictions. Nevertheless, the recent substantial rise in savings rates signals that people also tend to increase their precautionary savings in anticipation of expected job losses or more stringent fiscal policies (see Box 1: European unemployment rates in corona times). This may weigh on future consumption growth and hence jeopardize the recovery pace.
Box 1 – European unemployment rates in corona times

We should be cautious in interpreting Eurostat’s harmonised unemployment figures, as they are often subject to (sometimes large) revisions. In the most recent release of the data, the rate has been revised substantially for Belgium (down by 0.5 percentage points) and Bulgaria (upward by 1.7 percentage points). Eurostat’s unemployment rate is based on its quarterly Labour Force Survey (LFS). When the quarterly survey results are not yet available, the monthly series released by Eurostat are the result of a forecasting model. The current Covid-19 context in particular makes that model less reliable.
Moreover, differences in the policy response to the economic fallout from Covid-19 affects the cross-country comparability of unemployment statistics. This in particular applies to the share of people that have been absent from work due to temporary or partial unemployment. Persons on temporary layoff or subject to wage subsidies are not classified as unemployed in Eurostat’s definition, which is based on the ILO guidelines (i.e. a person is considered as being unemployed when he or she is without work, available to start work and has been actively seeking work). Countries that have actively taken measures to contain employment losses, like Belgium and France, may well see a delayed increase in Eurostat’s unemployment rate once these measures are no longer in force or less widespread. The recent emergence of a second virus wave may otherwise make governments decide to extend the temporary unemployment schemes.
Oxford Economics’ Stringency Index points at differences across countries in the strictness of measures to combat the virus. This also may help to explain the cross-country differences in the rise in the unemployment rate since February. The stronger these measures, the more likely people ended up in unemployment. Moreover, due to the lockdowns, a lot of individuals were not able to actively search for work or were not available to work due to the containment measures or due to family responsibilities as schools and care services were closed. Following the ILO guidelines, they were classified as (temporarily) inactive (i.e. out of the labour force), not as being unemployed.

Meanwhile, euro area industrial output recovery kept a solid pace in August, though climbing back from a very low base and still lagging behind the retail sector. After all, the industrial sector was struggling hard from an adverse mix of a deteriorating external environment (like the US-China trade war and the Brexit chaos) and the structural difficulties in the automotive industry, even before the outbreak of the pandemic. In terms of the level, the euro area industrial output has only reached slightly above 90% of the pre-pandemic level.
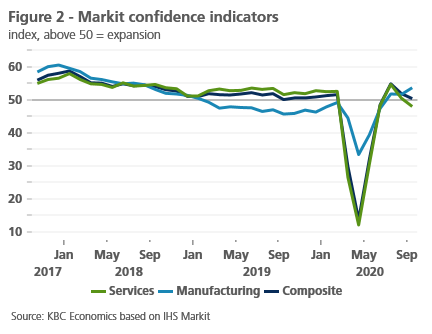
Despite the clear recovery trend in the third quarter of 2020, the September forward-looking sentiment indicators suggest that the final months of this year will be more challenging. The euro area composite PMI dropped to 50.1 in September compared to 51.9 a month earlier, signalling only marginal growth in activity. There is an important divergence to be noted, though. While the manufacturing sector picked up to a 31-month high, the services sector plunged sharply below the 50-threshold marking contraction territory (figure 2).
A weak near-term growth profile is particularly notable in Spain and France, as both economies have been hit hard by a flaring number of infections in recent weeks and have implemented stricter restrictions. That is to say, the pattern of growth deceleration seems consistent with a rising drag from the second wave of the pandemic. This in turn will further add to heterogeneity of post-lockdown recovery across Europe. In this respect, we maintain our view that Germany is set to outperform the rest of the euro area due to successful virus control, while Spain is set to remain a major underperformer not only due to the adverse epidemiological developments, but also due to the structural vulnerabilities (i.e. high exposure to tourism, a high share of SMEs and temporary employment). This gap could widen further if the virus continues to spread quickly and more restrictive measures are implemented.
All in all, while the fundamental picture in the euro area remains unchanged, an improved Q3 growth outlook, and a downgraded Q4 growth lead, on balance, to slightly less negative real GDP growth of -8.0% in 2020, upwardly revised from -8.3% last month. The negative overhang from this year mechanically translates into somewhat lower but still solid annual growth of 4.9% in 2021, marked by ongoing fiscal support both from national as well as EU-level policy initiatives, though the precise size and timing remain difficult to capture for the moment.
The outlook for ECB ultra-accommodative policy unchanged
On the monetary side, our outlook for the ECB policy remains unchanged. Weaker growth dynamics over the upcoming months, together with a backdrop of negative inflation readings at present and expectations of only a gradual pick-up in prices further support our view that the current very accommodating monetary policy stance will be kept through 2021. This should go hand in hand with an expansionary fiscal policy which is set to remain instrumental in underpinning a post-virus recovery. After all, the ECB has urged for fiscal stimulus to not be withdrawn prematurely. The ultra-easy ECB monetary policy also has important implications for government bond yields; in this regard, we maintain our view that there is limited scope for upward movement in government bond yields towards the end of 2021 with intra-EMU spread likely to be kept at current low levels thanks to the ECB’s market interventions.
While the ECB is expected to do more of the same in the near term, there might be a window of opportunity for a fundamental change in its policy strategy. Against the background of consistently undershooting its inflation target, and pressure from a significant shift in the Fed’s policy framework to ‘average inflation targeting’ implying that policy rates will remain lower for longer, the review of the ECB’s policy strategy is now underway (also see KBC Economic Opinion of 9 October). Whether the ECB will lean towards a Fed-like average inflation targeting or find its own response is yet to be seen. With the review delayed by the outbreak of the Covid-19 pandemic, the preliminary conclusions are not expected before the second half of 2021.
Brexit talks at a critical point
Outside the euro area, the UK economy also continues to recover albeit unevenly, but the future path is surrounded by significant uncertainty and clouded by a number of downside risks. First, newly reported cases of Covid-19 have been following the alarming trend across continental Europe and even outpacing it in many respects. This has triggered the introduction of stricter containment measures, but authorities are ultimately hoping to flatten the curve without imposing harsh national lockdown. Second, the Brexit negotiations are now heading to a critical point, however, the outcome remains unclear with different scenarios on the table (also see KBC Economic Opinion of 8 October).
Much work still needs to be done to overcome remaining political obstacles to a deal. Certainly, some flexibility and even creative measures to manage a complicated balancing of political and economic goals is instrumental to avoid an outcome neither wants. At the same time, significant concessions will be needed by both sides. Some of these will be symbolic such as politically sensitive but economically less important areas. Others will be more fundamental. The view that access to the single market carries with it significant obligations is central to EU thinking.
While we think the path may be bumpy in coming weeks and the final outcome may be less than perfect, we maintain our longstanding view that a Brexit trade deal can be concluded. At the same time, we believe that this will create scope for a different but positive future relationship between the European Union and the United Kingdom.
US economy rebounded, but a contested election is a major risk
Similarly to the developments in the euro area, the economic recovery in the United States was also somewhat more robust over the summer months than expected. The more upbeat tone of the data is mainly visible in consumer spending, well-supported by improved labour market conditions and government transfers in the form of expanded unemployment insurance benefits. Retail sales have thus already returned to the level prior to the pandemic and seen solid year-on-year gains since June (figure 3). These have mostly reflected strong demand for goods at the expense of a more muted recovery in services as households have shifted away from ‘social consumption’ categories such as restaurants or entertainment, where social distancing measures are difficult to maintain.
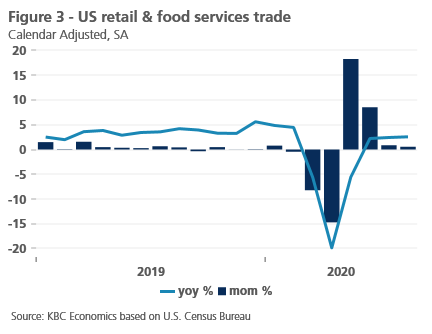
Nonetheless, the slowing pace of the month-on-month rise in retail sales recorded in August signals that the overall picture may become less rosy heading into year-end. Furthermore, consumer sentiment remains subdued, partly owing to the fact that additional government income support has already expired in several states and additional fiscal stimulus remains unlikely before the November election. This has placed increased strain on strapped households that will be more cautious with their spending. In other words, while the economy has been resilient in the past months to both a consistently elevated level of coronavirus cases as well as the withdrawal of key income and business support, we assume that the economy will begin to feel these negative effects. As a result, our upward revision to Q3 is followed by a downward revision to Q4 growth, leading, in net terms, to improved annual real GDP growth in 2020 of -4.5%, up from -5.5%. In addition, we have downgraded our growth outlook for 2021 from 4.5% to 4.0%.
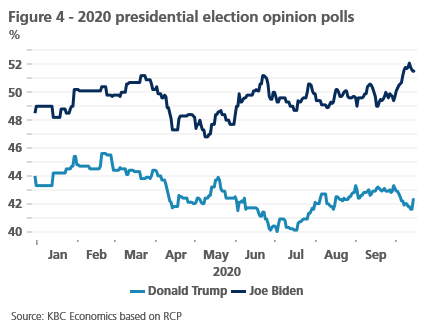
What happens next on the US fiscal front awaits uncertain election prospects. Apart from the ongoing pandemic, the November 3 presidential election is a major downside risk, potentially causing additional headwinds for the economy (also see KBC Economic Opinion of 13 October). At the time of writing, most national polls indicate that former Vice President Biden is ahead with a solid lead (figure 4). Still, our view is that the outcome of the election remains too close to call. Importantly, the substantial uncertainty surrounding the election does not stem from different policies of Democratic and Republican presidential candidates, but from the non-negligible chance that the results are too close and fiercely contested without a clear outcome. It is, therefore, possible that the results are not known for weeks after November 3, all the more so if the defeated side should not concede and lawsuits during the vote-counting process emerge. The worst-case scenario must then take into account the possibility of social unrest in the aftermath of the election.
An outcome entailing a contested election result would have negative implications for the US economy, triggering heightened uncertainty weighing heavily on business confidence and investment. Furthermore, even a clear election outcome does not guarantee renewed fiscal support for households and businesses since a two-month ‘lame-duck’ period might forestall any meaningful fiscal stimulus passing. Should Biden win or should there be a Democratic sweep, Republicans may not want to pass fiscal stimulus to prevent the incoming administration from getting an economic boost. A Trump victory would likely mean a continued Congressional gridlock, hence a new round of fiscal stimulus may be also difficult to pass. Finally, the possible tensions in the aftermath of election day could create lead to nervous reactions in financial markets worldwide.
China continues its strong recovery
China, meanwhile, remains on a remarkable post-Covid-19 recovery path. Sentiment indicators on both the manufacturing and services sides of the economy remain well above the 50-level that signals expansion. Industrial production has fully rebounded from February lows and, having grown 5.6% yoy in August, shows few signs of slowing. Retail trade has been slower to recover but still returned to positive year-over-year growth of 0.5% in August. More recent trade data confirm the positive picture. Exports grew at a still strong 8.7% yoy in September following growth of 10.4% yoy and 11.6% yoy in July and August. The strong export picture for China through the third quarter likely reflects the reopening of global economies and strong demand for both medical equipment (PPE) and tech products. Imports also picked up pace in September, growing 11.6% yoy, but it is likely too soon to say that this reflects a broader rebound in domestic demand in China. Indeed, the major risk to the Chinese recovery remains the fact that domestic demand and consumption has lagged. This partly reflects long standing structural issues in the Chinese economy (such as a weak social safety net and demographics), but also reflects the Chinese authorities’ focus on infrastructure and investment to boost growth during slowdowns (also see KBC Economic Opinion of 29 September). However, given the relative strength of high frequency data of late and the fact that the pandemic there remains mostly under control, we have revised up Chinese GDP growth to 2.0% in 2020 and 8.2% in 2021. Elsewhere in emerging markets, however, the picture is more diverse, with some economies recovering quickly and others seeing a more sluggish rebound from pandemic lows (see Box 2: Despite synchronised bounce back, emerging markets face differing trajectories).
Box 2 – Despite synchronised bounce back, emerging markets face differing trajectories
Economic indicators suggest, on the whole, that like the economies in Europe and the US, emerging market economies generally recovered in the third quarter following sharp contractions in the second quarter due to the spread of the coronavirus pandemic and related lockdowns. Despite this more-or-less synchronised recovery period, however, there are clear differences among emerging markets, both in terms of the severity of the pandemic and in terms of economic activity. Furthermore, while some regional tendencies are apparent, even within regions there are clear distinctions.
First, from the perspective of the pandemic itself, in general, we see that a number of Asian (in particular East Asian and Southeast Asian) emerging markets continue to keep the pandemic well under control compared to others. In China, Thailand, Vietnam and Taiwan, daily case rates remain relatively low (below 0.01 cases per 100,00 people). In other Asian economies, in particular India and Indonesia, but also to some extent Malaysia and South Korea, case rates per capita are higher. Meanwhile, in both Latin America and EMEA, daily case rates are generally still on the rise or countries are in the middle of ‘second waves’, with the exception of Chile, Brazil and South Africa, where daily case rates have started to stabilize.
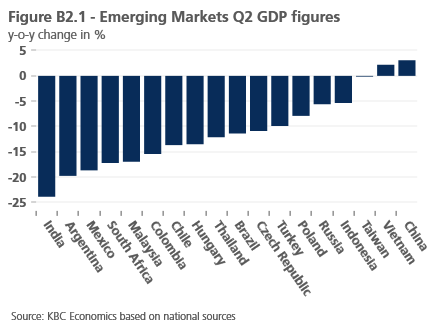
In terms of economic developments, the magnitude of the contraction experienced in Q2 varied widely. Economies that experienced relatively steep Q2 contractions include India (-23.9% yoy), Argentina (-19.8% yoy), Mexico (-18.7% yoy), South Africa (17.2% yoy) and Malaysia (16.9% yoy). The reasons for the severe contractions vary, but for several of these economies, such as India, Argentina and South Africa, their respective economies were already struggling pre-Covid and then suffered especially strict lockdowns in the spring. On the other side, Russia and Indonesia contracted only 5.6% yoy and 5.4% yoy, respectively, while Taiwan contracted a scant 0.15% yoy and Vietnam even grew 1.8% yoy (though its growth rate was still down significantly from the 7% yoy growth rate registered at the end of 2019) (see figure B2.1). For Taiwan and Vietnam, the relatively decent economic performance likely reflects a strong starting position for both economies, good containment of the virus, and the fact that exports held up relatively well, despite the global recession in the second quarter.
High frequency indicators for the third quarter suggest that for most countries, a recovery is underway. However, the strength of that recovery likely varies from one economy to the next. On the retail side, for example, Taiwan, Brazil, Turkey and Chile (among others) have returned to pre-pandemic levels (with year-over-year sales of 8.9%, 7.8%, 7.6% and 2.8%, respectively, in August). Year-over-year retail sales in Malaysia (-2.5%), Indonesia (-7.3%), and South Africa (-8.8%), on the other hand, are still lagging. On the industrial production side, major economies in Asia appear to have recovered to pre pandemic levels, with the exception of India. In Latin America, industrial production has recovered from April lows, but remains in negative year-over-year territory for Brazil, Mexico, Colombia and Argentina. For EMEA economies, industrial production is mixed, having rebounded solidly for Turkey (10.2% yoy) and Poland (1.8% yoy), while remaining in negative territory for the Czech Republic (-5.6% yoy), Russia (-6.9% yoy) and South Africa (-10.2% yoy).
Lower oil prices add to disinflationary pressures
While the global oil market continues to be under pressure from the Covid-19 pandemic, Brent crude remains well supported above the $40 a barrel threshold. This reflects benign supply-side developments, namely the 7.7 million barrels per day of OPEC+ output cuts which helped to shift the market balance to a meaningful deficit in the second half of 2020. Still, such heavy support is not guaranteed going forward. The Saudi-and-Russia led alliance’s original plan is to trim production cuts by 2 million barrels a day from January 2021, but this now seems too much for the market to handle. This is especially true when considering the additional up to 1 million barrels a day that could possibly return to the market in the coming months from Libya, where the ceasefire enabled the restart of production.
While developments on the supply side are important, the major driver behind our updated outlook for oil prices is the demand side. Over the past weeks, we have seen more visible signs of underlying weaknesses in oil consumption as the second wave of Covid-19 started to unfold rapidly. Therefore, we now project a more gradual path towards the full rebalancing of the oil market, which implies lower oil prices through the end of this year and in 2021. Our unchanged long-term Brent crude oil price estimated at $55 a barrel is expected to be reached no sooner than in 2022.
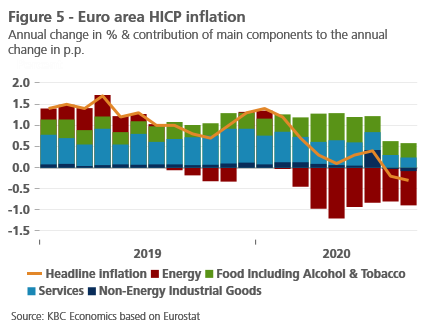
Our outlook for lower oil prices over the forecasted horizon has important implications for inflation dynamics in the euro area. In September, headline inflation eased further to -0.3% from -0.2% yoy recorded a month earlier, while ‘core’ inflation dropped to an historic low of 0.2% (figure 5). Although the inflation prints in the past months have been somewhat distorted by one-off changes in the sales period over the summer months or the VAT cut in Germany, a disinflationary impact from the pandemic is now evident, particularly in services prices. Against this backdrop, as well as due to stronger euro and lower oil prices ahead, we now assume even more subdued inflation dynamics with projected euro area inflation cut to 0.3% this year and 1.1% yoy in 2021.
Meanwhile, in the United States, disinflationary pressures are notably less pronounced, underpinning the continued divergence from the euro area. Headline inflation accelerated to 1.3% in August compared to 1.0% yoy in July. A strong print reflects, on the one hand, the fact that a large part of the US inflation dynamics is made up by ‘covid-insensitive’ categories that have been largely unchanged from a pre-pandemic period in terms of contribution. On the other hand, ‘covid-sensitive’ categories have been subtracting less in recent months along with the reopenings in sectors that were hit hard in the outbreak of the pandemic. As a result, we maintain our outlook for headline inflation at 1.1% yoy in 2020, followed by a meaningful uptick to 1.9% yoy in 2021.
All historical quotes/prices, statistics and charts are up-to-date, up to and including 12 October 2020, unless otherwise stated. The positions and forecasts provided are those of 12 October 2020.