

Economic Perspectives November 2025
Read the full publication below or click here to open the PDF.
- Notwithstanding increased US and EU sanctions on the Russian energy sector, oil prices declined by 2% last month to 64 USD per barrel. As OPEC+ increased its oil production quotas substantially this year and non-OPEC+ supply continues to grow rapidly, the oil market remains oversupplied. Sanctions on Russian LNG imports also had little effect on European natural gas prices which remained unchanged at 31 EUR per MWh. Futures markets still expect prices to drop in the coming years, as global LNG export capacity will grow significantly in the coming years.
- Euro area inflation is hovering around the ECB target as it eased from 2.2% to 2.1%. The marginal decline can be largely attributed to non-core components as both food and energy inflation eased. Core inflation remained stable at 2.4%, as the decrease in goods inflation was compensated by increasing services inflation. The latter is likely to be temporary as wage growth is slowing. As the latest figure was in line with expectations, we maintain our 2.1% and 1.8% inflation forecasts for 2025 and 2026, respectively.
- US inflation remains well above target as CPI inflation increased from 2.9% to 3.0% in September. The increase was mostly driven by higher gasoline prices. In contrast to headline inflation, core inflation eased from 3.1% to 3.0%. This was largely due to a softening in owner-equivalent rent inflation. Services inflation (ex. shelter) was also relatively soft. Goods inflation is still elevated as tariffs are gradually being passed through to consumer prices. We lowered our forecast for US inflation in 2025 to 2.7% but kept the forecast for 2026 unchanged at 2.6%.
- Euro area GDP growth surpassed expectations in Q3, as it grew by 0.2% quarter-on-quarter. There was strong divergence among member states. Portugal, Spain, France and the Netherlands posted strong growth figures, while the German and Italian economies didn’t grow last quarter. Business and consumer sentiment indicators also improved notably. We thus upgrade our 2025 forecast from 1.2% to 1.4% and our 2026 forecast from 0.9% to 1.0%.
- Notwithstanding the US shutdown, the US economy showed some signs of resilience last month. Labour market data were more positive as private job growth moved back to positive territory and claims data were broadly stable. Business confidence indicators also jumped up (in particular for the services sector). Consumer confidence dipped however, suggesting softer consumer spending in Q4. Given this positive data and the recent US-China agreement, we maintain our 1.9% forecast for 2025, while upgrading our 2026 forecast from 1.5% to 1.7%.
- Third quarter GDP figures confirm that the Chinese economy has lost some momentum following a resilient first half of the year. We therefore cautiously downgrade 2025 GDP growth from 5.0% to 4.9% while keeping the 2026 outlook unchanged at 4.4%. The trade agreement reached with the US, however, is a welcome development that reduces trade uncertainty in the near term (and partially reduces the overall US tariff rate on Chinese imports).
- The ECB and the Fed struck different tones at their respective October policy meetings. The ECB left rates unchanged as the euro area remains in a good place, with inflation hovering around its 2% target. We expect the current 2% deposit rate to be maintained at least until the end of next year. In contrast, the Fed again cut the policy rate in October. Though Fed Chair Powell cast doubt over the December rate cut, we still expect this rate cut to happen and pencil in two more rate cuts in the beginning of 2026, bringing the policy rate to a neutral level. The risk of a slower policy normalisation has increased markedly, however.
Global trade tensions eased last month as China and the US made a new trade deal. To come to an agreement, the US retracted its threat of a 100% tariff increase and of export controls on subsidiaries of blacklisted Chinese firms. It also halved the fentanyl-related tariffs (from 20% to 10%). Meanwhile, China agreed to postpone restrictions on rare earth exports by a year and to resume US soybean imports. Both sides also agreed to lower port fees. Though many bilateral trade issues remain unresolved, and trade tensions could re-escalate quickly, the agreement is still good news for global trade as it lowers trade uncertainty at least for a year.
On top of the welcome trade news, global economic data have also been broadly positive. Euro area GDP grew by a larger-than-expected 0.2%, thanks to outperformance of a.o. France and Spain. Euro area business and consumer confidence indicators also improved noticeably. In the US, despite the shutdown, the available economic data showed some resilience in the US economy. Labour market data improved somewhat, and business confidence indicators (especially for services) bounced up. Data on the Chinese economy were more mixed. Though exports remain resilient, investments are weak, and consumption remains sluggish. This could bring Chinese growth slightly below the 5% target.
Energy prices remain low
Oil prices continued their descent last month. They decreased 2% compared to October, reaching 64 USD by the end of the month. The decrease occurred despite tightening sanctions on Russia. The US blacklisted the two largest Russian oil producers, Rosneft and Lukoil, thus cutting them off from US dollar clearing. Both companies account for around half of Russian crude production. On top of US sanctions, the EU adopted its 19th package of sanctions on Russia. These targeted a.o. Russia’s shadow fleet, adding 117 new vessels to its blacklist.
Though oil prices jumped almost 5% on the day of the sanctions announcement, prices remain lower than end of September. The market is still well oversupplied, as non-OPEC+ supply continues to grow rapidly and OPEC+ has markedly raised its production quotas this year. OPEC+ agreed to increase output quotas by 137k in December but also announced a pause in production increases in Q1 2026 given oversupply concerns.
Aside from oil sanctions, the EU also targeted Russian LNG imports. It will ban LNG imports on short-term contracts by April next year and will also ban LNG imports on long-term contracts by 1 January 2027. The announcement had little impact on natural gas prices, which remained unchanged last month at 31 EUR per MWh. Futures also were little moved, and markets still expect prices to decline in the coming years (to around 25 EUR per MWh by 2029). This is primarily due to large new LNG capacity additions, which will boost global supply. According to the IEA LNG Capacity Tracker, which monitors final investment decisions (FID) for new LNG export projects, more than 300 billion cubic meters of new export capacity (around 7% of current total natural gas supply) is projected to come online between 2025 and 2030 (see figure 1). The biggest additions will be in the US, Canada and Qatar.

Euro area inflation slightly lower again
Inflation in the euro area fell slightly from 2.2% in September to 2.1% in October. The decline was caused by a sharper fall in energy prices (down 1.0% compared with a 0.4% decline in September) and lower food price inflation (2.5% compared with 3.0% in September). Core inflation stood at 2.4%, which is the same as the slightly upwardly revised figure for September. It is noteworthy that the rate of price increases (year-on-year) for non-energy goods slowed from 0.8% to 0.6%, while that for services rose from 3.2% to 3.4%.
The divergence between goods (excluding energy) and services inflation therefore remains persistent. While month-on-month price dynamics for goods are currently even slightly below the long-term average, those for services are still significantly above it (see figure 2).
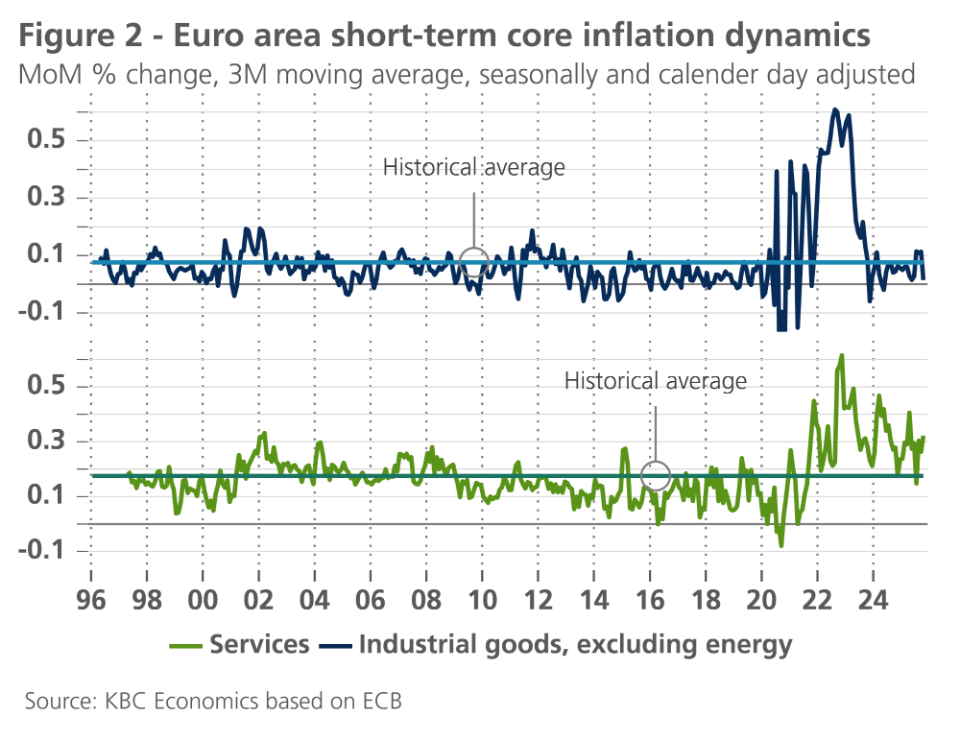
As we wrote last month, disinflation in the euro area is unlikely to be fully over yet, particularly in the services sector. Wage agreements point to a further slowdown in wage growth, which is a key determinant of services inflation. Together with accelerating labour productivity growth, this should ease labour cost pressures on inflation and profit margins. We therefore expect core inflation to cool further to around 2% by the second half of 2026. Depending on energy price developments, whose volatility tends to disrupt inflation trends, headline inflation may temporarily fall slightly below 2% in the course of 2026. We maintain our forecast for average inflation at 2.1% for 2025 and 1.8% for 2026.
US headline and core inflation at 3%
US inflation accelerated for the fifth month in a row. It reached 3.0% in September, up from 2.9% in August. The increase was primarily driven by higher energy prices. These increased by 1.5% month-on-month, due to a big jump in gasoline prices. These increases are likely to reverse, given recent drops in global oil prices. Apart from energy, other components were on the softer side. Food prices increased by only 0.2% thanks a.o. to a major drop in fruit and vegetable prices.
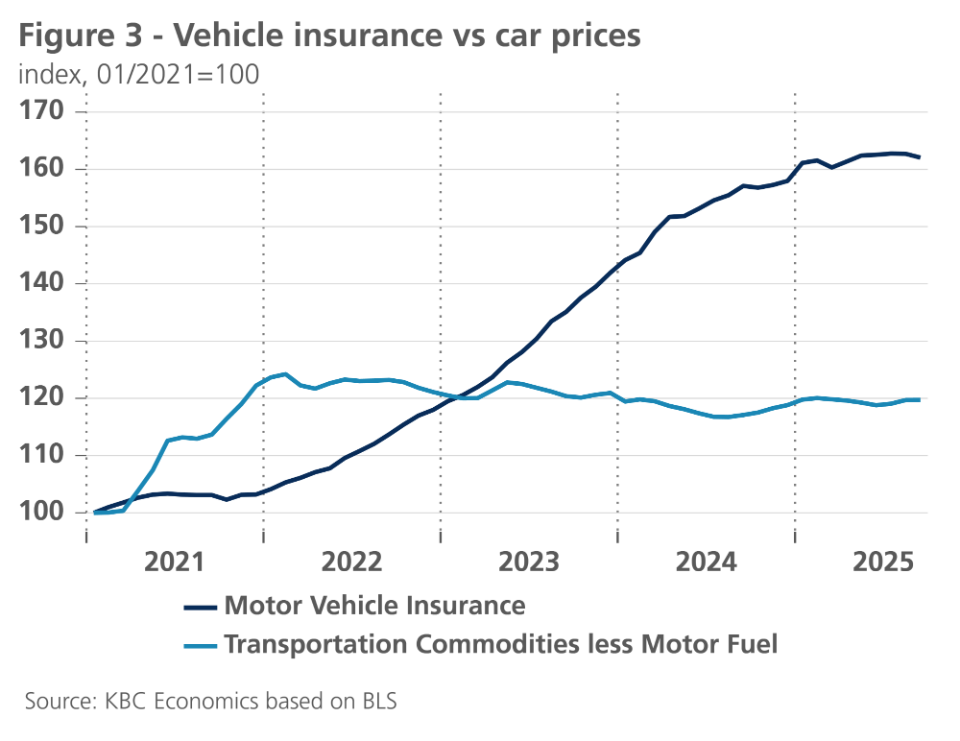
Core components also softened, pushing down core inflation from 3.1% to 3.0%. Shelter inflation decelerated notably, as shelter prices increased by only 0.2% month-on-month, despite a big jump in hotel prices. This was largely due to a major deceleration in the sticky owner-equivalent rent category. Forward-looking indicators point to further softness ahead for shelter inflation. Excluding shelter, services prices increased by 0.3% month-on-month. Airline fares pushed up services prices. In contrast, there was a notable decline in vehicle insurance prices. Despite modest increases in the value of the insured asset (i.e. car prices), insurance prices have skyrocketed in the last 4 years (see figure 3). Vehicle insurance inflation has slowed recently, however, and could continue to weigh on services prices.
The most watched inflation component was core goods inflation, where evidence is mounting of tariffs filtering through. Despite a drop in used car and truck prices, core goods prices increased by 0.2% last month. There were notable increase in import-heavy categories such as apparel and recreation commodities. In the last three months, core goods rose by 0.7%, well above historical run-rates. We lowered our forecast for US inflation in 2025 to 2.7% but kept the forecast for 2026 unchanged at 2.6%.
Euro area growth surprises on the upside
According to preliminary flash estimates of real GDP, growth in the euro area was 0.2% in the third quarter (compared to the previous quarter). This is significantly better than our expectation of stagnation. Among the larger countries, the surprises came from Spain (0.6%) and France (0.5%), while the Netherlands (0.4%) and Belgium (0.3%) also delivered positive surprises. The strongest growth was recorded in Portugal (0.8%).
A sharp diagnosis of growth dynamics always remains somewhat speculative when the first estimates for the euro area are published. It is clear that the Iberian Peninsula remains a cradle of growth. In Spain, household consumption and, after an initially slow start, investment continue to fuel economic activity. Structural economic reforms and strong immigration, particularly from Spanish-speaking South Americans, who are quickly finding their way into the labour market, are driving robust employment growth and supporting positive economic momentum. In France, on the other hand, both consumption and investment growth remained particularly weak for the time being, as expected against the backdrop of political malaise. The unexpectedly strong growth figure was due to the sharp increase (2.2%) in exports of goods and services. The aviation, chemical and pharmaceutical sectors contributed particularly to this. Export growth was accompanied by a reduction in inventories that had built up in previous quarters and now negatively contribute to growth. In the food and beverage sectors, exports suffered, as expected, from import tariffs in the US. The strong French growth figure was also flattered by the restart of refineries after maintenance work in the first half of the year.
As expected, the German and Italian economies stalled in the third quarter. Comments from the German Federal Statistical Office (Destatis) signal a decline in exports, while investment in capital goods developed positively. In Italy, net exports are said to have made a positive contribution to growth, which was, however, offset by inventory reduction.
For a clearer picture of the overall business climate in the euro area, we will have to wait for the detailed figures on value added by expenditure and production. The better-than-expected GDP growth figure is probably positively skewed by a number of rather random factors and does not yet signal an earlier-than-expected fundamental strengthening of domestic demand. Retail sales, for example, were only 0.2% (in volume) higher in the third quarter than in the previous quarter, while industrial production in the three months to August was 1.0% lower than in the previous three-month period.
On the other hand, both the European Commission's surveys and the purchasing managers' index (PMI) point to a clear improvement in business confidence. This is also reflected in the Ifo surveys of German industry, particularly when looking at the outlook for the next six months (see figure 4). This is possibly triggered by the hope that the German budgetary stimuli are finally entering their implementation phase. Nonetheless, it is striking that political decision-making in Germany is proving more difficult than was hoped immediately after the elections. However, progress with the policy measures is urgently needed, as the earlier tentative signs of a cooling of the German labour market appear to be intensifying. Moreover, despite the improvement in overall expectations, the German industry remains extremely concerned about its competitiveness in international markets (see figure 4). This underlines that structural competitive handicaps are far from being overcome.

So not all risks to economic growth have been eliminated. Nevertheless, the new trade agreement between China and the US and the ceasefire in the Middle East have brought the downside and upside risks to growth into slightly better balance. We therefore maintain our expectation of a gradual strengthening of domestic demand in the euro area from the last quarter of 2025 and especially in the course of 2026. Stronger household consumption should be the driving force behind this, together with the substantial investment stimulus from the German budget and the final NextGenerationEU transfers, which will support investment momentum, particularly in the Southern-European countries. The tentative improvement in consumer confidence suggests that the consumption engine will only gradually shift into higher gear. However, if households reduce their currently very high savings more drastically than expected, there is a potential for growth to strengthen more than projected here.
We have raised our expectations for average real GDP growth in the euro area from 1.2% to 1.4% for 2025 and from 0.9% to 1.0% in 2026. This increase is due to stronger growth in the third quarter, which increases the total carry-over effect from 2025 to 2026. Nevertheless, year-on-year growth is expected to be slightly stronger in 2026 than in 2025 (1.2% versus 1.1%).
US economy is showing some resilience
Due to the US shutdown, new US data releases have been limited. Indeed, key economic data releases such as GDP or employment reports have been delayed. The data that have come out have mostly surprised to the upside, however. This is the case for the labour market data overall. According to the ADP report, 42k jobs were added in October. Though this figure is well below historical averages, it is above the negative job growth seen in the prior two months. Claims data also point to some resilience in the labor data. These data were largely unchanged versus prior months (with initial claims broadly unchanged and continuing claims drifting slightly upwards). This suggests the number of unemployed is not significantly increasing at present. However, the recent increase in announced job cuts and the continued decline in daily job openings could push up the unemployment rate in later quarters.
Business confidence indicators also jumped up overall (see figure 5). This was particularly the case in the important services sector, which contributes almost 80% to US GDP. Both the S&P Global and the ISM Services PMIs ticked significantly upwards in October. The ISM services data was especially encouraging as the underlying details were also very positive. Especially the big jump in the new orders component is a positive sign. In contrast to businesses, consumers were more downbeat in October as consumer confidence dipped downwards. A decline in light vehicle sales in October also points to a notable slowdown in consumer spending growth in Q4.

The recent trade agreement between China and the US could also further boost overall sentiment, thus slightly boosting investment and consumption. While we maintain our 1.9% forecast for this year, we upgrade our forecast for next year from 1.5% to 1.7%.
China’s growth slows in Q3
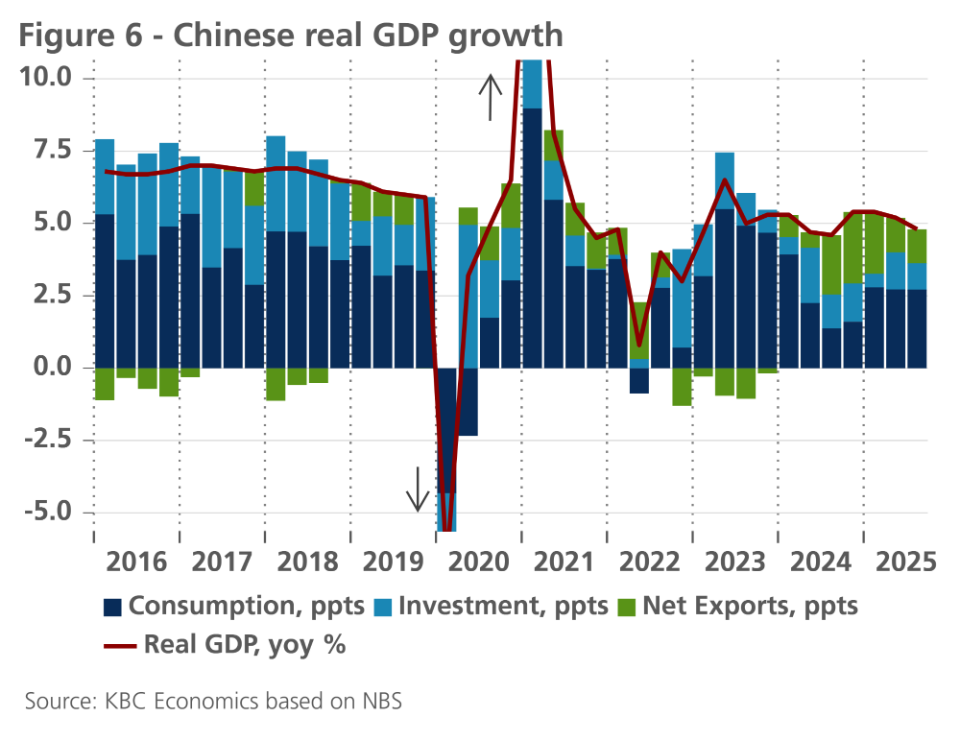
Third quarter GDP figures confirm that the Chinese economy has lost some momentum following a resilient first half of the year. Real GDP grew 4.8% in year-over-year terms, a step down from the 5.4% and 5.2% growth recorded in Q1 and Q2 2025, respectively. A breakdown of the contributions to GDP growth suggests that much of slowdown came from a decline in investment, while consumption’s contribution remained stable at somewhat sluggish levels and net exports remained solid despite some slowdown compared to late-2024 and early-2025 (see figure 6).
The continued dichotomy between internal and external demand was also evident in September retail sales, which declined 0.2% over the month, and industrial production, which accelerated to 0.64% growth in September from 0.37% the month prior, partially reflecting resilient exports. Over the third quarter as a whole, exports grew 7.0% year-on-year, despite the sharp slowdown in exports to the US (-27% year-on-year) as exports to other regions compensated. October trade data, however, showed some first signs of a broader weakness in external demand, as exports fell -0.80% year-on-year.
The year-long trade truce reached between China and the US in October is therefore a positive development, with the Trump administration agreeing to reduce fentanyl-related tariffs by 10 percentage points to 10%. So-called reciprocal tariffs remain at 10% rather than being increased as threatened (this reciprocal tariff rate had temporarily reached a peak of 125% in April but was brought down to 10% in mid-May and kept at that level as negotiations played out). In return, China agreed to suspend export restrictions on rare earth minerals and purchase more US commodities (e.g. soybeans). This agreement avoids (again) a worst-case outcome for the trade relationship and reduces some uncertainty, at least in the near-term. While the agreement could lead to a bottoming out or even a modest improvement in Chinese exports to the US, there are two important elements worth noting. First, tariffs on many Chinese goods remain higher than 20% (10% reciprocal tariffs plus 10% fentanyl tariffs) due to section 301 tariffs (adding up to 25%) introduced in Trump’s first term and modified during the Biden administration. These section 301 tariffs (along with the sectoral section 232 tariffs on a.o. steel and aluminum) were not removed in the latest agreement, though an extension of some exclusions already in place for specific goods was granted. Second, despite reciprocal tariffs being reduced from 125% to 10% in May, exports have only partially recovered from the May low (-35% year-on-year) and were still down 25% in October relative to a year earlier. This suggests some level of decoupling may persist regardless of specific tariff levels.
We therefore keep our outlook for real GDP growth on a quarterly basis unchanged going forward but reduce our annual average forecast for 2025 from 5.0% to 4.9% due to the slightly weaker Q3 figure. For headline inflation, we reduce our annual average outlook to -0.1% in 2025 and 0.7% in 2026, but note that core inflation is steadily rising, reaching 1.2% year-over-year in October, its highest level since February 2024. This is a welcome sign for the Chinese economy given increasingly entrenched deflationary pressures over the past few years.
ECB confirms bottom of interest rate cycle for now
The late October interest rate decisions of both the Fed and the ECB produced few surprises. The ECB kept its deposit rate unchanged at 2%. It still sees its policy stance in a "good place". Indeed, headline inflation was 2.1% in October, a negligible deviation from the 2% medium-term target. However, underlying core inflation is still at 2.4%, mainly due to relatively high service price inflation. If no new inflationary shocks occur, the path of core inflation is likely to converge further downwards towards the inflation target, partly due to moderate expected wage agreements.
Moreover, the disinflationary trend in the euro area is also supported by two other factors: lower energy prices compared to a year earlier and the strong appreciation of the euro since the beginning of this year, both bilaterally against the dollar and in trade-weighted terms. The strong euro is dampening import price inflation, thereby depressing goods price inflation, among other things (in contrast to the relatively high inflation in the services sector mentioned above). Additionally, the expected postponement of the ETS2 implementation is likely to lead to lower inflation in 2027.
We confirm our scenario that the ECB is at the bottom of its interest rate cycle with its current 2% deposit rate. Headline inflation is in line with its target, and a number of downside growth risks have recently abated, according to the central bank. With this, the ECB referred to a relative calm in the trade conflicts between the US on the one hand and the eurozone and China on the other, and the ceasefire in Gaza. Moreover, the European labour market looks resilient with a low unemployment rate. Together with a savings rate that is still well above its historical average due to precautionary savings, and thus has room to fall, this could further support private consumption growth in the coming quarters.
Fed keeps its hands free
The Fed continued its easing cycle in late October, which it had resumed in September. As a result, the policy rate was cut to 3.875%. This was in line with our expectations and those of the market. A slight surprise, however, was the Fed's communication, which made it clear that another rate cut in December is ‘not a foregone conclusion’. This was reflected in part during the latest Fed policy meeting, when one policymaker even voted to leave policy rates unchanged in October. After that meeting, communication was rather hawkish. In our scenario, those communications do not so much point to a significant likelihood of another interest rate pause in December. Rather, it may be the Fed's intention to steer market expectations away from an almost certain rate cut in December and thus give itself room to maneuver so that it can react without any restraint in December to the data that are available at that moment. Optionality seems to be the current keyword for the Fed against the backdrop of missing data.
Besides the interest rate cut, the Fed also announced that it will end its quantitative tightening (QT) programme from early December. It believes the amount of excess liquidity has decreased sufficiently (from 'abundant' to 'ample') to keep the size of its balance sheet unchanged until further notice. The unquantified concept of 'ample' refers to a state in which the demand for liquidity by the financial sector is 'amply' met. The end of QT was probably also prompted by the fact that some market interest rates suggested that the money market was becoming somewhat tighter than previously estimated. Specifically, for instance, the SOFR rate, at which banks can borrow money among themselves on a daily basis and against collateral, was temporarily above the target zone in which the Fed wants to keep its policy rate (see figure 7).

Quantitative policy is the second policy instrument in which the Fed and the ECB are currently diverging, in addition to the different positions in the policy rate cycles. Indeed, the ECB's QT policy continues and has the clear objective of continuing until the PEPP and APP policy portfolios are fully run down.
Bond yields remain in slight upward trend
Our fundamental scenario for US and German government interest rates remains unchanged. We did note that both interest rates rose slightly following the unexpectedly hawkish Fed communication. We slightly revised downwards our long-term interest rate forecast for the end of 2025, but the further expected upward bond yield path remained virtually unchanged.
Spreads under control
We continue to expect intra-EMU government bond yield spreads to continue their downward trends. The expected cyclical economic recovery in the coming quarters, the still ample amount of excess liquidity in the euro area, and the ECB's TPI in the background, play a role in this. However, political risks combined with a difficult 2026 budget layout could temporarily spoil the game. This problem presents itself especially in France, so we continue to assume that the French interest rate differential with Germany will remain at relatively high levels until after the 2027 presidential elections.
All historical prices, statistics and charts are up to date as of 10 November 2025, unless otherwise stated. The positions and forecasts provided are those of 10 November 2025.