

Economic Perspectives May 2026
Read the full publication below or click here to open the PDF.
- The war in Iran is driving up global commodity prices. As of Monday 18 May, oil and natural gas prices reached 110 USD per barrel and 50 EUR per MWh respectively. Our base case still assumes a near-term resolution to the conflict, in line with futures markets. However, the conflict is lasting longer than we initially anticipated. Furthermore, a longer lasting conflict could cause increasing strains in energy markets, resulting in much higher commodity prices than in our base case scenario. This is currently the most important risk to our scenario.
- Euro area inflation accelerated again last month, increasing from 2.6% to 3.0%. The inflation increase was again caused by another jump in energy prices. Food inflation remained unchanged. In contrast, core inflation decreased from 2.3% to 2.2%. This decrease was the result of another drop in services inflation. Core goods inflation increased again. Rapidly rising import prices and producer prices point to further inflation ahead. We upgrade both our 2026 and 2027 forecasts by 0.1 percentage point to 2.8% and 2.0% respectively.
- US inflation increased from 3.3% to 3.8%. Another big jump in energy prices was the prime culprit. Food prices also rose sharply. Core inflation accelerated as well (from 2.6% to 2.7%), driven by a big (one-off) increase in shelter prices. Core goods prices were unchanged and there was a modest increase in core services prices (ex. shelter). Given the increased shelter prices and high energy prices, we upgrade both our 2026 and 2027 forecasts by 0.3 percentage points to 3.6% and 2.7% respectively.
- Euro area GDP grew by 0.1% last quarter (0.2% excluding Ireland). There was wide disparity among member states. Spain continued to perform very well and the German and Italian economy also grew strongly. Meanwhile, the French economy stagnated. Confidence indicators point to further weakness ahead as the energy crisis is set to weigh on growth (especially in services and construction). We maintain our growth forecast of 0.7% for this year, while slightly downgrading our 2027 forecast to 1.2%.
- US GDP grew by 0.5% last quarter. Non-residential investment made the strongest contribution, thanks to solid contribution of software and information processing equipment. Government spending, inventories and consumption also made positive contributions, while net exports and residential investment made negative contributions. The labour market is resilient, however, as 115k jobs were added in April. We maintain our growth forecast of 2.0% for 2026 and 1.9% for 2027.
- The outlook for the Chinese economy remains largely unchanged compared to last month with annual GDP growth expected at 4.7% in 2026 and 4.1% in 2027. Recent business sentiment data support the view that the economy is somewhat insulated from the Middle East conflict in the short term. However, risks remain to the downside, and a longer closure of the Strait of Hormuz could lead to more acute supply disruptions that weigh on China’s manufacturing sector going forward.
- As expected, both the Fed and the ECB kept rates unchanged in April. We still expect both central banks to largely look through the current energy shock. We expect the ECB to keep rates unchanged in 2026 and 2027. This forecast is largely contingent on the assumption that a reopening of the Strait of Hormuz would be agreed to in the near term. We also expect the Fed to keep rates unchanged this year. We expect the Fed to cut rates twice in 2027, bringing the Fed funds rate to a neutral level.
Iran war pushes up global commodity prices
The war in Iran continues to cause enormous volatility in energy markets. Though a ceasefire is in place and remains largely intact, passage through the Strait of Hormuz remains minimal. Both Iran and US have both made proposals for a temporary peace deal, but no agreement has been made at the time of writing. We still expect Iran and the US to reach an agreement to reopen the Strait of Hormuz in the near term. A gradual normalisation of flows is also priced in by futures markets, with oil prices expected to drop from 110 USD per barrel (as of Monday 18 May) to 93 USD by end-2026 and 80 USD by end-2027. Our base case still assumes that an agreement will be found in the near term. However, uncertainty around the conflict’s duration is high and a longer-lasting conflict with more permanent scarring effects on energy markets is a major risk to our scenario.
The war has already lasted longer than we initially anticipated and strains are starting to show in energy markets. The International Energy Agency (IEA) reports that global supply declined by 12.8 million barrels per day because of the war. Output from affected Gulf countries is 14.4 million barrels per day lower than before the war. Other countries such as the United States, Venezuela and Kazakhstan provided some compensation. Demand is also affected. The IEA (whose base scenario is similar to ours) forecasts to contract by 420k barrels per day year-on-year in 2026. This is 1.3 million barrels per day lower than its pre-war forecast. Lower LPG, naphta and jet fuel consumption account for most of the decline. Inventory build-offs are for now closing the gap between supply and demand. Global observed oil inventories declined by more than 240 million barrels in March and April combined. If the war were to drag on, inventories will run low and increased demand destruction will be needed to balance supply and demand (likely through higher prices).
Gas prices are also under pressure due to the conflict and the cut-off of LNG supplies from Qatar. As of Monday 18 May, gas prices reached 50 EUR per MWh, increasing 77% year-to-date. As prices are elevated, European governments are filling up reserves at a slower pace than usual. Filled at 36.7%, EU gas reserves are filled well below historical averages.
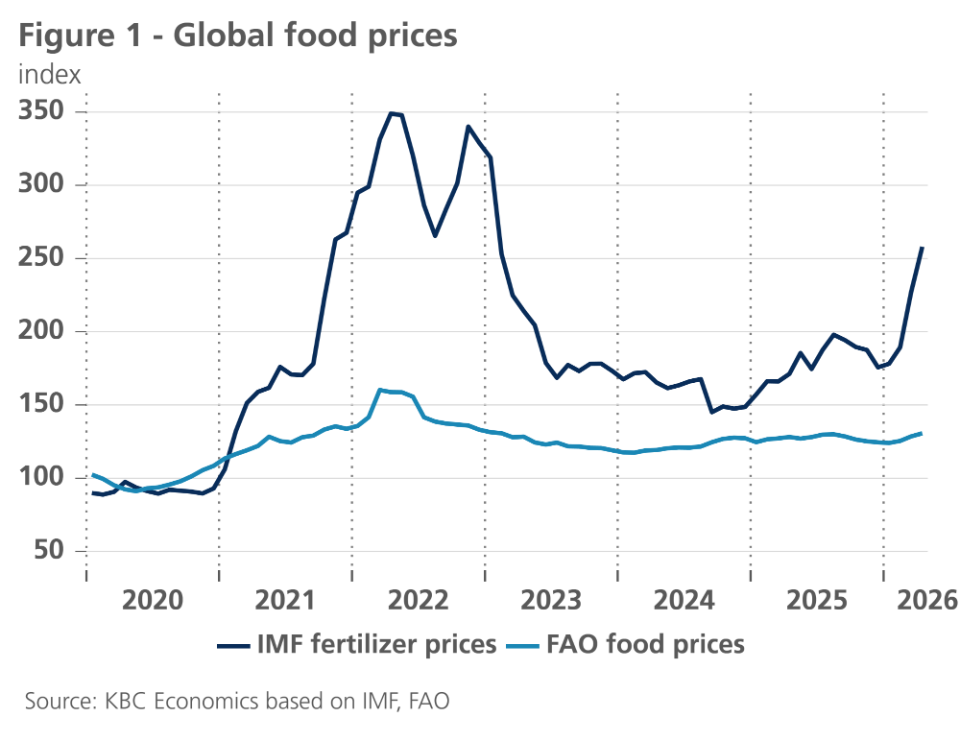
Food prices are also pushed upward by the war. Food prices increased by 2.1% last month and are now up by 5% year-to-date. The conflict in the Middle East plays a big role here. According to the IMF, global fertilizer prices are up 47% year-to-date (see figure 1). Cereal prices increased 0.8% last month partly as a result of higher energy and fertilizer prices driving up costs. Vegetable oil prices also rose sharply again, driven by increased biofuel demand. Meat prices also rose due to high global demand. In contrast, sugar and dairy prices declined last month, thanks to ample supply.
Inflation in the euro area rises
According to Eurostat’s preliminary estimate, inflation in the euro area rose by 0.4 percentage points to 3.0% in April. This was mainly due to energy price inflation more than doubling from 5.1% in March to 10.8% in April. This figure was even higher than expected. Food price inflation remained unchanged at 2.4%, whilst core inflation fell from 2.3% in March to 2.2% in April. The latter was due to a further cooling of services inflation to 3.0%, the lowest level since March 2022. By contrast, the rate of price increases for non-energy goods accelerated from 0.5% to 0.8%, the highest level since April 2024.
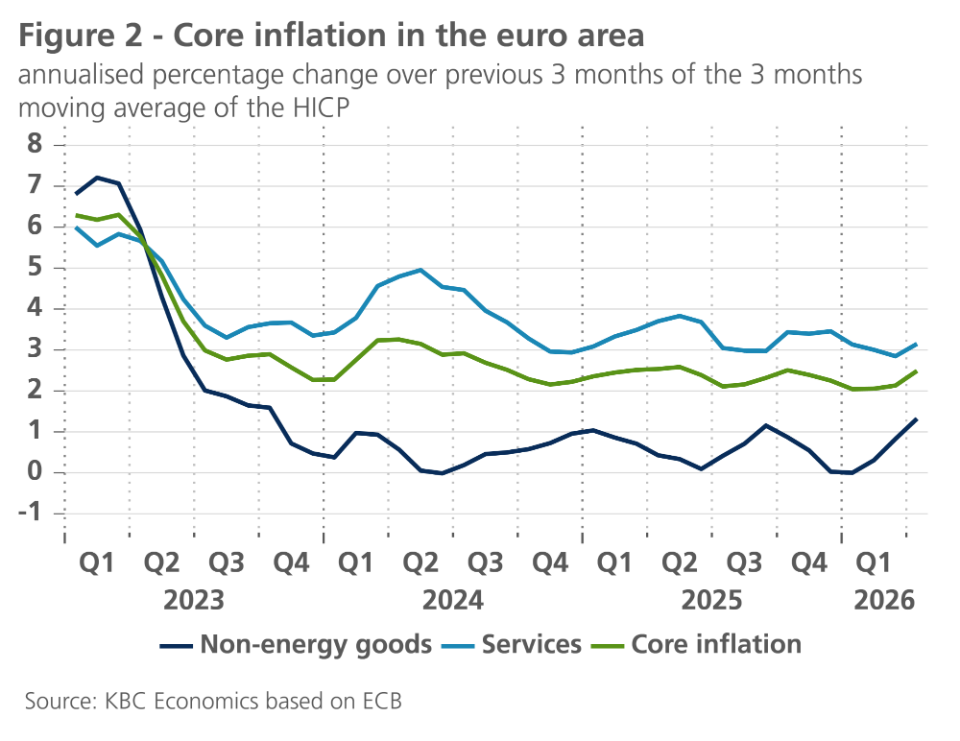
The sharp rise in energy price inflation is the unequivocal and (more pronounced than) expected direct consequence of the sharp increase in energy prices on the international market. The assessment of the dynamics of core inflation is, for the time being, less clear-cut, but nonetheless important with a view to identifying the indirect effects of the rise in energy prices. The acceleration is strongest for non-energy goods, as is also evident from the percentage comparison of the three-month moving average of the index with that of three months earlier (see figure 2). However, the acceleration had already begun in February, when there was no sign yet of the surge in energy prices. A fresh surge in April, on the other hand, could well be the result of indirect energy price effects. More information in the near future will clarify whether this is noise or a signal of fundamentally rising core inflation. The sharp rise in expected selling prices in business surveys suggests that the latter may be the case.
For the time being, we have not made any further adjustments to our outlook for the future monthly trend in inflation. After all, we had already factored in a limited increase in indirect price effects. The slight increase (compared with last month’s forecast) in the expected average inflation for 2026 (2.8% instead of 2.7%) and 2027 (2.0% instead of 1.9%) is solely due to the higher-than-expected inflation figure for April. The outlook continues to assume that the indirect effects of the energy price surge will remain limited overall, that second-round effects via wage adjustments will be virtually non-existent, and that energy price inflation will exert a clear downward effect on inflation in 2027. However, higher inflation over a longer period remains the main risk, particularly if the blockade of the Strait of Hormuz were to last longer than expected.
US inflation rises again
US inflation made another major jump in April, from 3.3% to 3.8%. The prime culprit was again the energy component. Energy prices rose by 3.8% month-on-month due to large increases in gasoline, fuel oil and electricity prices. Food prices also made an important jump of 0.5% month-on-month. This increase was mainly in the food-at-home component.
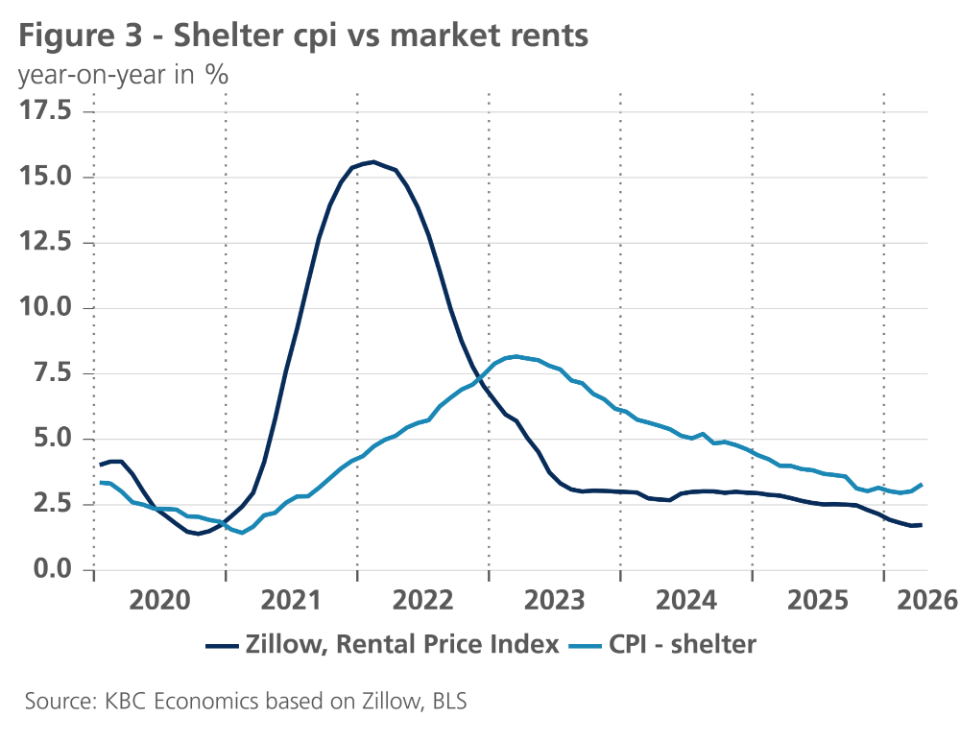
The high inflation was not only driven by non-core components, however. Core inflation also accelerated from 2.6% to 2.7%. On a monthly basis, core inflation rose by 0.4%. The prime driver of core inflation was shelter, whose prices rose by 0.6% last month. This is likely a one-off, as the price increase was mostly caused by a technicality. Looking ahead, we expect continued softness in this important category, as suggested by market rent prices (see figure 3).
In contrast to shelter, other categories were softer. Core goods prices were unchanged. Categories such as household furnishings, vehicles and medicinal drugs saw prices decline. In contrast, apparel prices continued to increase rapidly as did information technology commodities. Services (ex. shelter) increased by 0.3% month-on-month. Part of this increase was driven by another big increase in airline fares. Many other services components saw modest price increases. This is likely a result of weakening wage pressures, which in combination with high productivity increases keep unit labour costs in check. Unit labour cost increased by only 1.2% year-on-year in Q1.
Given elevated energy prices and the upside surprise in shelter inflation, we upgrade both our 2026 and 2027 forecasts by 0.3 percentage points to 3.6% and 2.7% respectively.
Euro area growth remains resilient
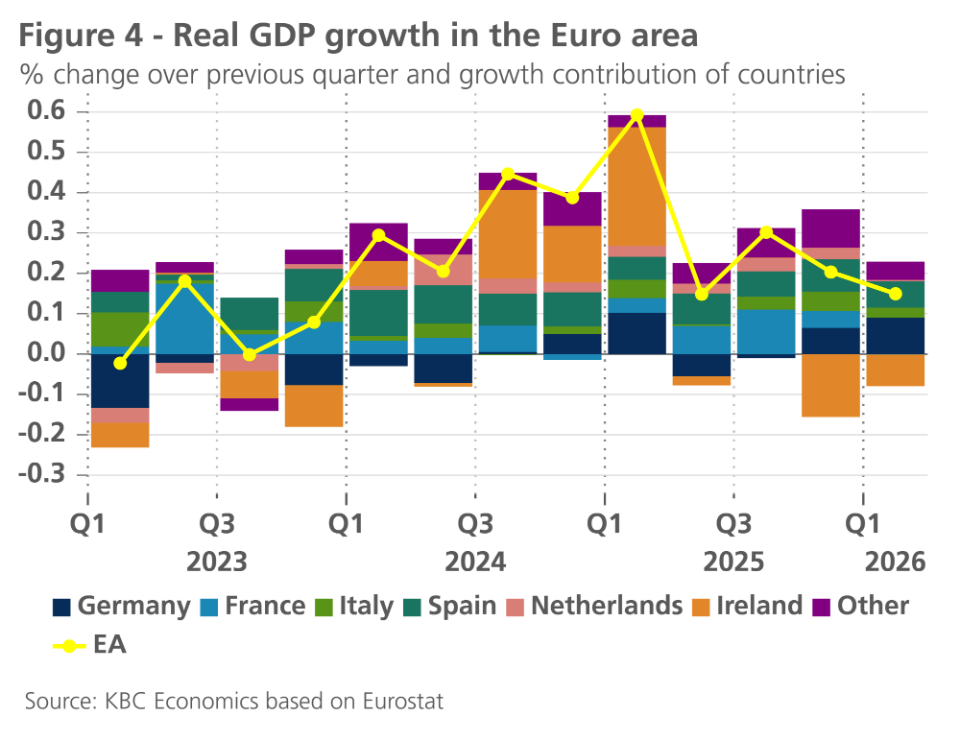
According to Eurostat’s flash estimate, real GDP growth in the euro area stood at 0.1% quarter-on-quarter. This figure was in line with our expectations, although it was largely driven by the new sharp contraction in the Irish economy (by 2%), which more than offset the stronger-than-expected growth in several core countries. Growth in the German, Italian and Spanish economies was indeed significantly higher than expected, at 0.3%, 0.2% and 0.6% respectively. France and the Netherlands, on the other hand, disappointed with (almost) zero growth.
In France, all components of final demand fell short. The exceptionally sharp decline in exports was linked to delays in aircraft deliveries, which were accompanied by a substantial build-up of inventories. In the Netherlands, too, exports of goods and services fell quite sharply (by 0.6%) and private consumption remained broadly flat. Gross fixed capital formation and government consumption showed a slightly more dynamic trend.
Despite the slight slowdown in growth, Spain remains the growth champion among the larger euro area countries, with private consumption and investment in fixed assets driving growth. For the second quarter in a row – and in contrast to a long series of previous quarters – the German economy is playing its part (see figure 4). Figures on the components of expenditure are not yet available, but according to comments by Destatis, the German statistical office, both private consumption and government consumption were higher than in the previous quarter, as were exports. In Italy, the better-than-expected growth is mainly attributable to net exports, according to comments by Istat, the Italian statistical office.
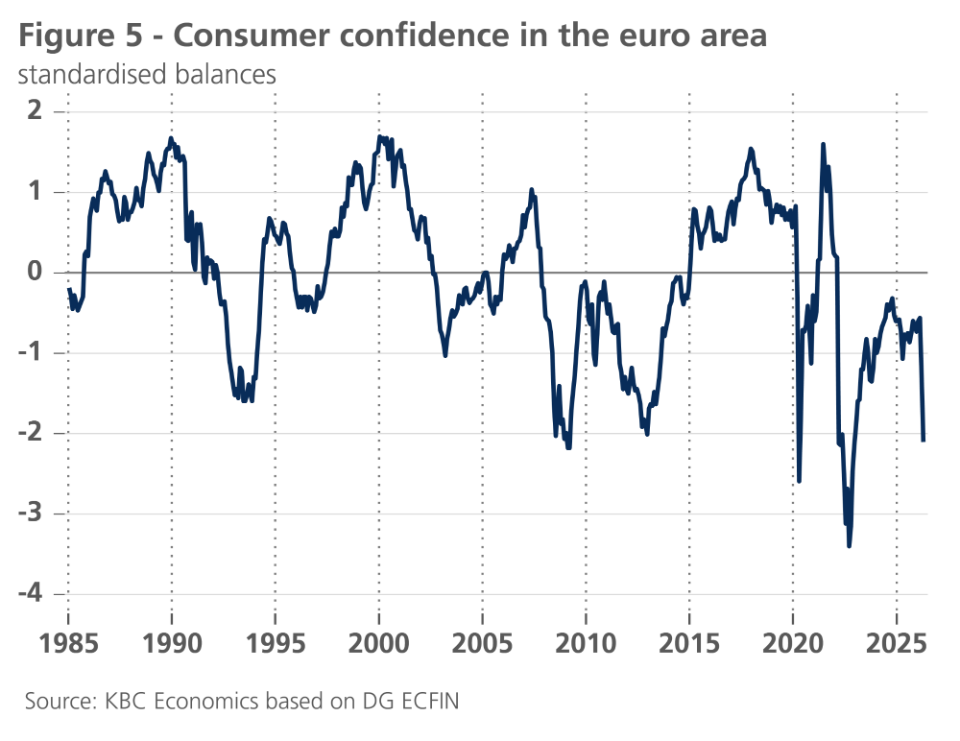
Meanwhile, the war in the Middle East is eroding confidence among both consumers and businesses. Particularly striking is the sharp decline in consumer confidence, which had not yet returned to its long-term average since the previous energy crisis. It is now at a level comparable to the lows seen during various previous crises (see figure 5). As regards business confidence, it is notable that the deterioration is currently more pronounced in the domestically oriented service sectors and construction than in the internationally oriented manufacturing industry. Nevertheless, some concern regarding supply is also becoming apparent in industry.
The employment outlook is deteriorating across all sectors, with the exception of construction, where it is stabilising at a relatively high level. This deterioration warrants close monitoring in order to assess the economy’s resilience. For the time being, there are no major causes for concern. After all, the unemployment rate fell again in March to its historic low of 6.2%, whilst the labour hoarding indicator – the extent to which businesses whose sales prospects are deteriorating intend to at least maintain their workforce and thus ‘hoard’ labour – is rising once more. Apparently, the perceived tightness of the labour market for suitable staff continues to deter businesses from resorting to redundancies too quickly. This is a key factor in maintaining confidence that the economy will remain resilient enough to absorb this shock as well.
As the effective, sustainable reopening of the Strait of Hormuz – which is crucial to maintaining economic growth – is taking slightly longer than was anticipated at the start of the war in late February, we have revised our growth forecast for the third quarter downwards slightly. (In March, we had lowered our forecasts for the second quarter and, to a lesser extent, for the third quarter as well.) The expected average real GDP growth for 2026 remains at 0.7% (without the downward revision to the third-quarter growth forecast, this would have been 0.8%), whilst that for 2027 has been lowered from 1.3% to 1.2%. Should the normalisation of shipping in the Strait of Hormuz drag on into or, a fortiori, beyond the summer months, growth would likely turn out even lower. The latter risk also applies should US President Trump reignite the trade war in July – something he appeared to be announcing in recent statements, but which we do not yet factor into our current base scenario. The provisional agreement on the ratification of the US trade deal that the EU Council and the EU parliament reached on 20 May has lowered the chances of a US-EU trade war escalation.
US economy supported by AI investments
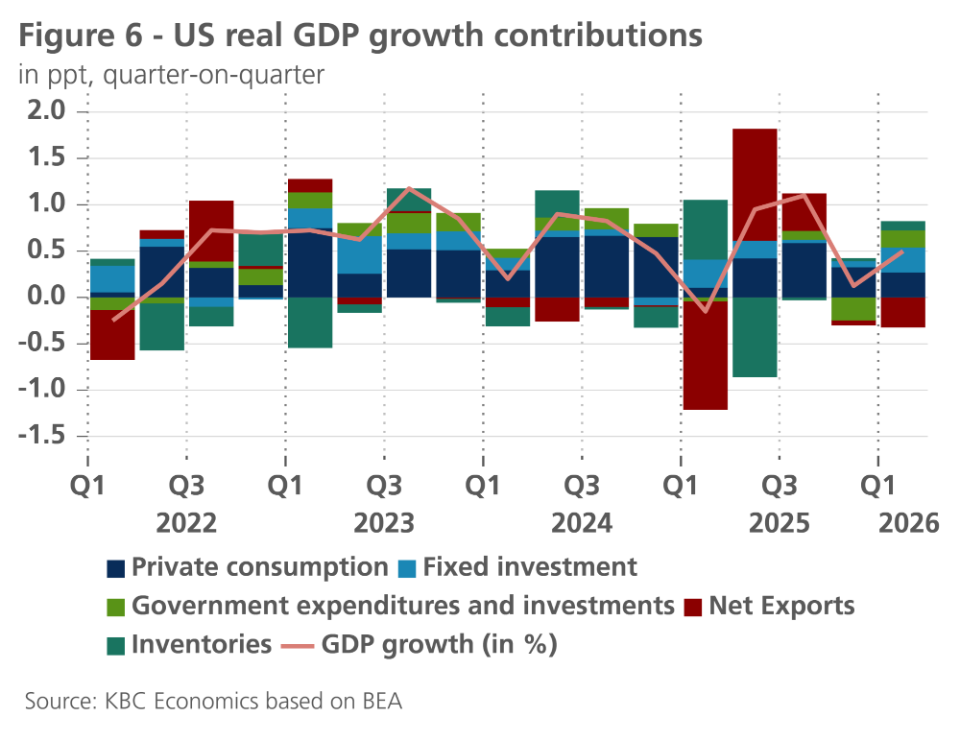
In line with our expectations, the US economy grew by 0.5% quarter-on-quarter in Q1 (see figure 6). Non-residential investments provided the strongest contribution to growth (0.35 percentage points). The ongoing AI investment boom is the likely driver of this strong contribution. Information processing equipment and software investment made a 0.35% contribution. This implies that non-IT non-residential investments made no contribution last quarter. Another important contributor was government spending (0.2 percentage points), which bounced back following last quarter’s shutdown. Inventories also contributed positively. Meanwhile net exports made a negative contribution as the trade balance widened in March. Residential investments also contributed negatively for the fifth quarter in a row. Consumption made a 0.27 percentage points contribution, the weakest contribution since Q1 2025. Only services consumption increased, while goods consumption stagnated.
The labour market is resilient, however. Following a 185k job increase in March, another solid 115k jobs were added in April. Private job growth was even larger, as government job growth continues to decline. Other details were a bit weaker, however. The unemployment rate rose from 4.26% to 4.34%, while the participation rate edged down. The number of people working part time for economic reasons edged up for the second month in a row. Job openings also decreased notably in March.
Looking ahead, risks for the US economy remain elevated. Not only does the outcome in the Iran war remain uncertain, the trade war also remains a major source of uncertainty. The Court of International Trade recently invalidated the 10% Section 122 tariffs. The Trump administration has appealed this decision. Furthermore, the Section 122 tariffs are set to expire by 24 July. By then, the Trump administration is likely to issue new tariffs on trade partners, using Section 301. Several investigations on trading partners are on-going. However, the outcome (in terms of tariff level) remains unclear. On the upside, AI remains a tailwind for the US economy, as Magnificent Seven companies forecasted record capex spending in their latest earning calls. Increased AI adoption could lead to productivity gains for the US economy. In a recent Atlanta Fed Survey, 74.1% of firms reported using Generative AI technology, up from 46.4% in November last year.
All in all, we maintain our growth forecast of 2.0% for this year and 1.9% for next year. The uncertainty surrounding this forecast is elevated, however with important risks to both the downside and the upside.
Exports keep boosting China’s economy
The outlook for the Chinese economy remains largely unchanged compared to last month. As expected, the economy has shown some degree of resilience to the disruptions caused by the closure of the Strait of Hormuz. April business sentiment surveys did not deteriorate materially. The S&P manufacturing and services PMIs improved marginally while the NBS manufacturing PMI stayed above 50, signalling expansion, at 50.3. NBS manufacturing sub-indicators, such as supplier delivery time, don’t point to significant supply chain disruptions impacting manufacturing yet, while new export orders continued to improve.
In another sign that exports continue to be a main driver of growth for China, export growth bounced back in year-on-year terms to 14.1% in April (from 2.5% in March). Meanwhile, solar cell exports surged in March in both volume and price terms (79.6% and 83.8% year-on-year, respectively), highlighting the strong demand for China’s clean energy tech amid the negative global energy supply shock. For now, we therefore leave the GDP growth outlook for China unchanged, at 4.7% average growth in 2026 and 4.1% in 2027. However, the longer the closure of the Strait of Hormuz persists, the higher the risk that energy and other product shortages will negatively impact China’s growth momentum.
Headline inflation, meanwhile, ticked up again to 1.2% year-on-year in April, led by a surge in energy prices for transportation purposes. Electricity prices for households remained more contained due to electricity regulations. Producer prices also moved further into positive territory in April to 2.8% year-on-year, pulling China out of its deflationary spiral. We have modestly increased the annual average inflation outlook for 2026 from 1.0% to 1.2% but left the 2027 figure unchanged, also at 1.2%.
Monetary policy under the spell of geopolitics
We expect the US central bank to remain on the sidelines for the rest of 2026 and early 2027. After that pause, the Fed is likely to cut its policy rate to the neutral level of around 3% during 2027. At the June policy meeting, the Fed will publish its new 'dot plots' which will also show whether the Fed will stick to this medium-term interest rate projection under the leadership of new Fed Chairman Walsh.
For the ECB, however, the outlook is much more uncertain. Our scenario is crucially based on the assumption that the flow of trade through the Strait of Hormuz restarts soon. In the short term, the most likely scenario for this is that the declaration of principle between the US and Iran, with subsequent negotiations lasting about 30 days, gets underway quickly. The longer this is delayed, the more likely the scenario of a longer-term economic impact of the war in Iran on the global economy becomes.
That situation puts the ECB in a dilemma. After all, there are both arguments for and against a rate hike at the next policy meeting on 11 June. We assume in our baseline scenario that the ECB will stay on the sidelines until further notice, to await the additional economic data to be released before the next policy meeting. However, we do explicitly link this expectation to the assumption that the transport of oil, gas and derivatives through the Strait of Hormuz will restart in the very short term. If that turns out not to be the case, at least a limited precautionary rate hike (‘risk management hike’) by the ECB seems likely. The uncertainty surrounding this is extreme, since this is a geopolitical decision by just a few actors, who have not always made predictable decisions in the past.
Arguments for the ECB to wait for further geopolitical developments include the good medium-term anchoring of inflation expectations around the ECB's 2% inflation target. Available data on the eurozone wage agreements also point in the same direction. In addition, an economic-financial tightening in the European economy is already underway, reflected in rising long-term interest rates and weakening credit growth in the euro area. This applies to both the supply side (tighter credit conditions, mainly due to uncertainty) and the demand side (due to the uncertain economic investment climate). This means that the risks to growth in the euro area are to the downside, which is also reflected in the recent development of confidence indicators. Moreover, the ECB's current policy rate, at 2% around the neutral level, allows the ECB to take a somewhat more wait-and-see stance compared to the energy price crisis in 2022. Finally, the so far cautious response of fiscal policy to the rise in energy prices also plays a role. If those measures are temporary, tailor-made and targeted, they do not give an additional reason for tighter monetary policy.
At the same time, we are not blind to the difficult trade-off the ECB has to make. With a possibly one-off hike in June, the ECB could signal to markets that it is taking the situation seriously. After all, despite important differences, the 2022 energy crisis is still fresh in everyone's memory. Moreover, in addition, with the new economic projections and alternative scenarios, the June policy meeting, if desired, would be an appropriate opportunity for such a precautionary interest rate hike. Finally, while there are no 'second-round effects' on inflation expectations yet, there are already indirect spillovers from higher oil and derivative prices to underlying core inflation.
Taking all these considerations into account, we consider the scenario of a wait-and-see ECB the most likely, albeit with an unseen degree of uncertainty.
Bond yields fluctuate around equilibrium levels
US and German 10-year government yields recently continued to fluctuate around their estimated 'fair value' of 4.50% and 3.00%, respectively. This fluctuation was mainly driven by volatile market expectations regarding Fed and ECB policy. Since we still assume that both central banks will take a wait-and-see approach until further notice, we expect the current level of both 10-year interest rates to fall back to the level we estimate as an equilibrium level in the near future.
Intra-EMU government spreads remarkably stable
Our view on intra-EMU bond yield differentials against Germany remains unchanged. Those spreads will continue to hover around current levels, with possible further slight downside potential. Country-specific, we still expect a temporary spread widening for France in early 2027 ahead of the presidential election. In the somewhat shorter term, spreads for countries such as Italy, which are heavily dependent on energy imports from the Middle East, will fluctuate along with news regarding the US-Iran negotiations.
The striking relative stability of spreads in the eurozone may be partly due to the fact that the market knows that the ECB is also closely monitoring spread developments. According to its current policy strategy, should spread developments threaten financial stability and thus the monetary transmission mechanism, the ECB can use all means, including quantitative easing if necessary, to remedy this. And for any disorderly and perceived as unwarranted market speculation, the ECB has the Transmission Protection Instrument (TPI) at its disposal. Reason enough for financial markets not to worry about European bond markets for now.
All historical prices, statistics, and charts are up to date as of May 18, 2026, unless otherwise noted. The positions and forecasts provided are as of May 18, 2026.