

Economic Perspectives March 2026
Read the full publication below or click here to open the PDF.
- The war in Iran and the resulting closure of the Strait of Hormuz has caused a major adverse energy supply shock. Oil and natural gas prices have risen by 63% and 91% year-to-date as a result. Markets appear to be pricing in a reopening of the Strait of Hormuz in the first half of the year with prices moderating thereafter. That said, even in such a scenario, a higher risk premium will be embedded in energy prices, leaving them above their prewar levels in the medium term. Furthermore, a longer conflict, with more damage to energy installations is a major risk to our economic outlook.
- Euro area inflation accelerated from 1.7% to 1.9% year-over-year in February. The acceleration was caused by an increase in core components as core inflation rose from 2.2% to 2.4%. Both goods and services inflation accelerated, though the latter could be slightly distorted by the Winter Olympics in Italy. Looking ahead, euro area inflation will sharply accelerate in 2026 given higher oil and natural gas prices, leading us to revise 2026 average inflation upwards from 1.8% to 2.7%. Base effects and lower energy prices will bring down inflation in 2027 to 1.9%.
- US inflation remained unchanged at 2.4% year-over-year in February. Non-core components (food and energy) showed strong increases. Core inflation also remained unchanged at 2.5%. Goods inflation showed a modest increase, as vehicle prices declined. Shelter inflation also moderated, while services (ex. shelter) increased at a stronger pace. Looking ahead, higher gasoline prices will push inflation upwards in the months ahead. We thus upgrade our average 2026 inflation forecast from 2.6% to 3.1%. Base effects and lower energy prices will bring down inflation in 2027 to 2.2%.
- Euro area Q4 GDP growth was revised downwards from 0.3% to 0.2% quarter-over-quarter because of a large downward revision of the Irish figure. Consumption made a decent contribution, as did gross capital formation. Net exports made a negative contribution. The labour market remains in good shape as the participation rate is increasing, while the unemployment rate reached a historical low. The energy shock will unfortunately have an important negative impact on growth, given Europe’s dependency on energy imports. We thus downgrade both 2026 and 2027 growth from 1.2% to 0.7% and from 1.4% to 1.3%, respectively.
- The US economy grew by only 0.2% quarter-on-quarter in Q4. This was primarily caused by a large drop in government spending as a result of the shutdown. Yet, consumption and investments also made weak contributions. Growth is set to recover in Q1, thanks to a recovery in government spending and net exports. The labour market remains weak, however, as there was a 92k decline in non-farm payrolls in February. The energy crisis is likely to have a mild net impact on US growth given that the US has become a net energy exporter. Given the weak Q4 figure, we downgrade our 2026 growth forecast from 2.4% to 2.1%, while maintaining our 1.9% forecast for 2027.
- The Chinese economy has important buffers to help it withstand the current energy price shock with minimal economic damage, at least in the medium term. A strong start to Q1 is expected to offset weaker growth dynamics in Q2, leaving the real GDP growth outlook for 2026 unchanged at 4.6%.
- The war in the Middle East puts central banks in a bind. Given the uncertain trajectory of the war, the ECB and the Fed are likely to remain in wait-and-see mode. The Fed is expected to keep the policy rate unchanged at its current mildly restrictive level throughout this year, as the growth effects of the current crisis on the US are limited, while US inflation is likely to shoot up. We still expect two rate cuts next year as inflation moderates. We expect the ECB to largely look through the current energy shock and keep rates unchanged this year. That said, if the current shock becomes more prolonged than expected, or energy inflation shows signs of passing through to core inflation, the ECB and the Fed would likely pursue more restrictive monetary policies.
Iran war causes energy prices to skyrocket
The war in the Middle East has caused a major shock to global energy markets. By Tuesday 24 March, Brent oil prices rose 63% year-to-date to 99 USD per barrel. Natural gas prices have also seen major spikes. They rose by 91% year-to-date to 54 EUR per MWh. Despite losing market share in global energy markets in recent decades, the Middle East remains critical to global energy markets. The Middle East provides around 30% of global oil production and 17% of global natural gas production. Iran itself supplies 4.5% of global oil production and 7% of global natural gas production. Most problematic for energy markets is the closure of the Strait of Hormuz, through which around 20% of global oil supplies and LNG supplies typically flow. Passage through the strait has declined to a near standstill (see figure 1).
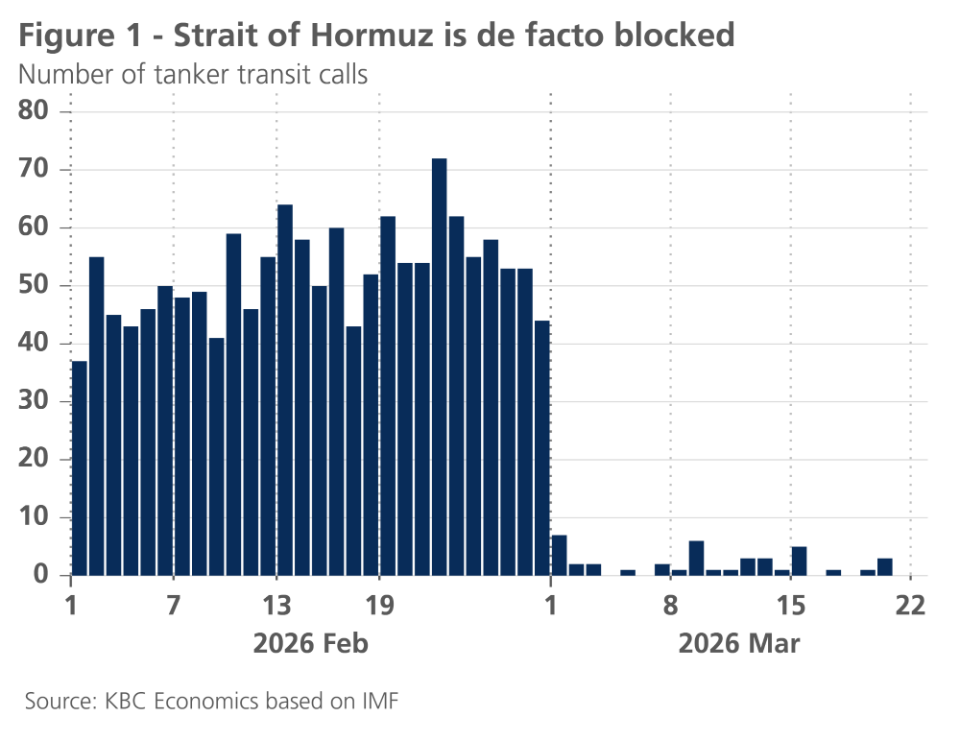
Capacity to redirect oil through pipelines is limited. Of the total 20 million barrels that typically flow through the Strait, only an estimated 5 million can be redirected. As Middle Eastern countries fill up their oil reservoirs, they are increasingly forced to cut production. In its flagship oil market report (published on 12 March), the International Energy Agency (IEA) estimated that Gulf countries had already cut production by 10 million barrels per day. Some measures have been taken to counteract the loss of Middle Eastern supply. IEA member countries agreed to release 400 million barrels of oil from their emergency reserves. Sanctions on Russia have also been eased as the US provided a 30-day waiver to India to buy Russian seaborne crude oil. High prices will also induce US shale producers a.o. to increase output. Nonetheless, there will still be a major supply shortfall in March (projected at 8 million barrels per day by the IEA). Demand will also decline in March (by 1 million barrels per day according to the IEA), due to high prices, flight cancellations and disruptions to LPG supply.
The situation in natural gas markets is just as problematic. Qatar, which typically accounts for around 19% of global LNG supply, has halted its production. Furthermore, natural gas facilities are increasingly being targeted. Israel recently struck Iran’s South Pars gas field, while Qatar’s Ras Laffan LNG export terminal has been struck by Iran. For Europe, the rise in energy prices comes at a particularly challenging moment. Gas reserves are at low levels and will need to be refilled at elevated prices.
Our current outlook rests on the assumption that flows through the Strait of Hormuz resume in the near term. That said, even when flows through the Strait resume, it will take several weeks for energy supply chains to normalise (given the time it takes to restart production and to ship tankers in and out of the Middle East). We also expect this war to have a long-term impact on energy markets. Several energy installations have been targeted and will take years to repair. Furthermore, even when the conflict ends, markets will embed a higher geopolitical risk premium into energy prices, as a possible closure of the Strait of Hormuz will be a sword of Damocles hanging over global energy markets. Our base scenario is thus in line with current energy futures curves.
Other commodities are also being hit by the current conflict. A large proportion of global fertilizer comes from the Middle East (22% of urea and 45% of sulfur). Prices of fertilizer have skyrocketed as a result, which will negatively affect food production (especially as the Northern hemisphere is in planting season). Aluminum prices also rose as 24% of the metal comes from the region. Helium prices (a byproduct of LNG) have also risen fast. Helium is a.o. used for cooling the supermagnets used to make semiconductor chips.
Euro area on an upward inflation trajectory
Compared with the previous month, inflation in the euro area rose by 0.2 percentage points to 1.9% year-over-year in February. The increase was mainly driven by a rise in core inflation from 2.2% in January to 2.4%. Food price inflation fell slightly from 2.6% to 2.5%, whilst energy price inflation rose from -4.0% in January to -3.1% in February. The higher core inflation came as a surprise. It was partly due to stronger services inflation in Italy, driven by the Winter Olympics. The end of a sales period in France also played a role.
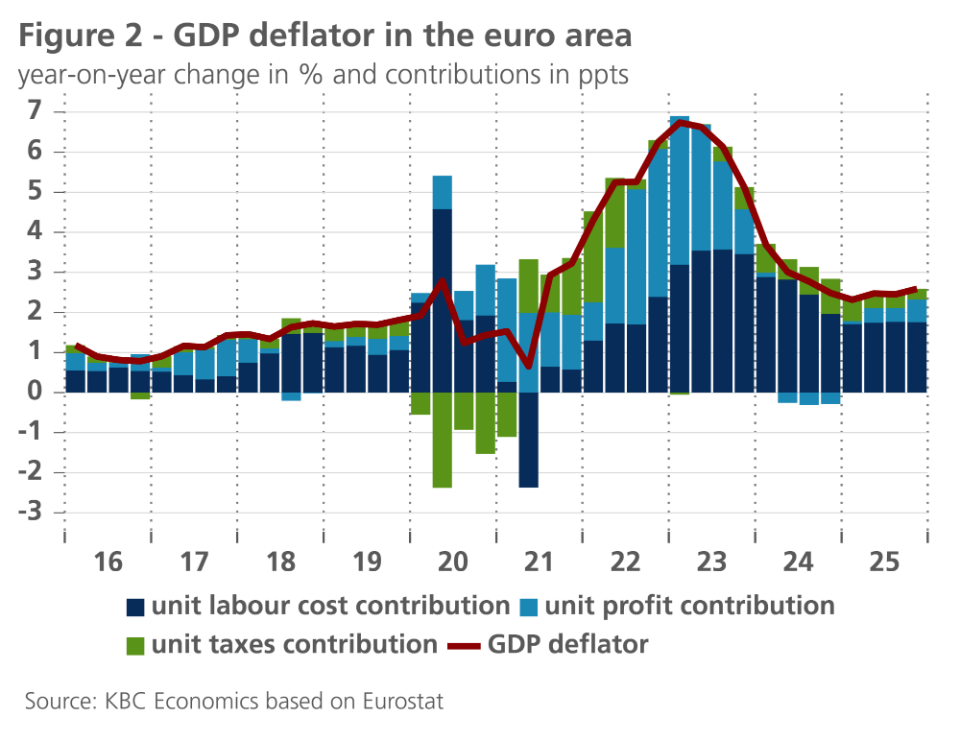
These are temporary factors which nevertheless contribute to the further easing of underlying inflationary pressures in the euro area proceeding rather slowly and with difficulty. This is also evident from the trend in the GDP deflator, whose annual rate of increase rose slightly in the fourth quarter of 2025 to 2.6%, compared with 2.5% in the two preceding quarters and 2.3% in the first quarter of 2025. The contribution from unit labour costs stabilised at 1.8 percentage points, but the contribution from (operating) profit increased by 0.2 percentage points (see figure 2).
Meanwhile, all eyes are of course focused on the new inflationary shock caused by the recent surge in energy prices. The inflationary impact of this depends primarily on the scale and duration of the price rises on international energy markets. The volatility of market expectations in this regard – itself a reflection of shifting expectations regarding the war in the Middle East – makes it difficult to assess.
In our outlook, we assume that average inflation in the euro area will rise to 2.7% in 2026, which is 0.9 percentage points higher than our estimate from last February. We maintain our forecast for average inflation in 2027 at 1.9%. In doing so, we take into account the direct impact of price rises in energy markets on consumer prices for energy products and a limited indirect impact on food prices. We have not yet factored in broader indirect effects on the prices of other goods and services. The more pronounced and prolonged the energy price surge on the commodity markets, the more likely these effects are to occur, although government measures may mitigate them to some extent. Second-round effects via higher wage increases also become more likely the longer the inflationary spurt lasts. All this underscores the extremely high level of uncertainty surrounding the inflation outlook.
High US gasoline prices set to increase US inflation
US inflation remained unchanged in February at 2.4% year-over-year. On a monthly basis, prices increased by 0.3% month-on-month. This elevated increase was largely driven by non-core components. Food prices increased by 0.4%, while energy prices increased by 0.6% last month, due to a big increase in fuel oil prices.
Core inflation also remained unchanged at 2.5%. On a monthly basis, the increase was a modest 0.2%. Core goods showed a modest 0.1% increase, as prices of transportation commodities and medicinal drugs declined. Apparel prices again jumped upwards, possibly as a result of high tariffs. Shelter prices increased by a modest 0.2% last month, despite an increase in hotel prices. Market rents continue to point to further softening in the shelter component. Core services prices (ex. shelter) increased by 0.3% last month. This modest figure is partly caused by lower insurance prices, an encouraging trend. As wage pressures are moderating and productivity is accelerating, services inflation could further moderate in the coming months.
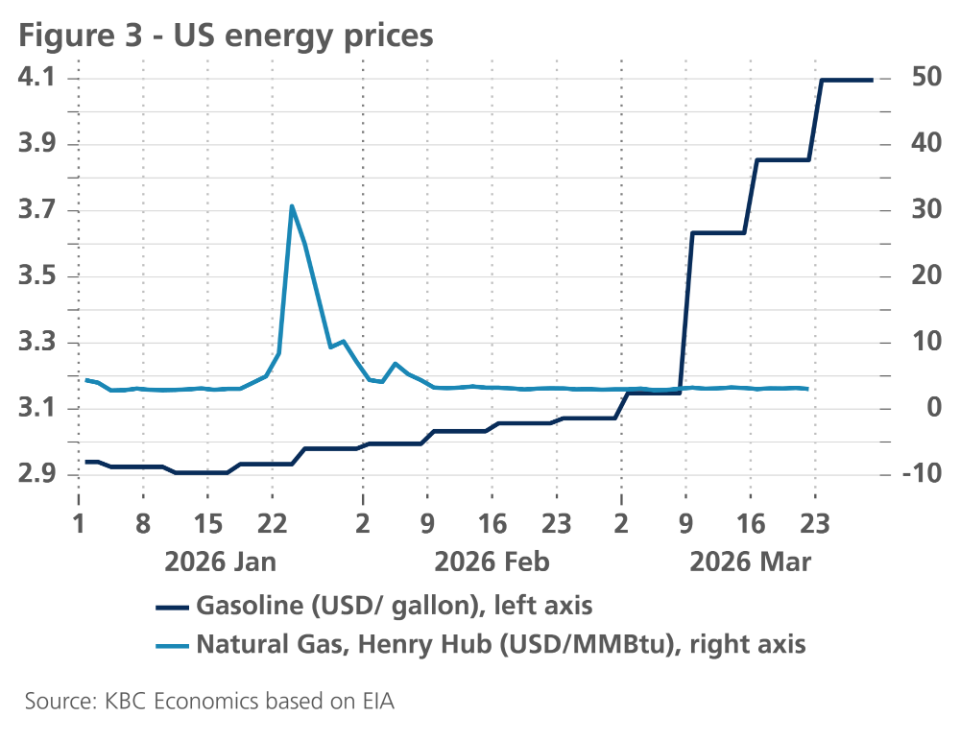
Looking ahead, the war in the Middle East will push inflation upwards in the short term. Gasoline prices have shot higher since the outbreak of the war (see figure 3). The US will be less affected by the rise in global natural gas prices, given its large domestic production. Henry Hub prices have remained under control since the outbreak of the conflict. Overall, given the rise in gasoline prices, we upgrade our 2026 average inflation forecast from 2.6% to 3.1%. Base effects and lower energy prices are expected to lower inflation in 2027. We thus downgrade our 2027 forecast from 2.4% to 2.2%.
Lower growth in the euro area
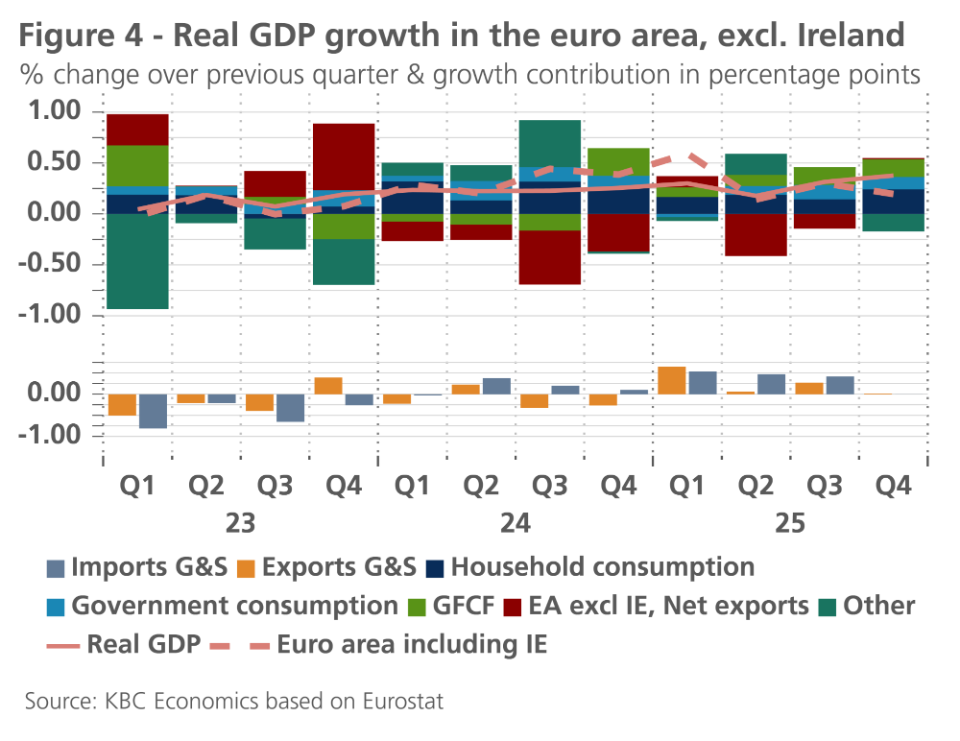
In the euro area, real GDP growth in the fourth quarter of 2025 (compared with the previous quarter) was revised downwards from 0.3% to 0.2%. This was due to the sharp contraction of the Irish economy by 3.8%, compared with a previously estimated contraction of 0.6%. There were no significant revisions in the major euro area countries. Excluding Ireland, growth stood at almost 0.4%, which would represent a slight acceleration compared with the third quarter (0.3%) and implies that the euro area economy performed close to its potential growth rate in the final months of 2025.
All components of final domestic demand contributed to growth. The largest contributor was household consumption, whose contribution doubled from 0.1 percentage points in the third quarter to 0.2 percentage points in the fourth quarter. The contribution from public consumption remained constant at 0.1 percentage points. The growth contribution of gross capital formation fell from 0.3 percentage points in the third quarter to 0.1 percentage points in the fourth. However, this decline was entirely attributable to the Irish economy, as excluding Ireland, the growth contribution of investment in both the third and fourth quarters was 0.2 percentage points (see figure 4). The Irish economy was also responsible for the negative contribution to growth from net exports, as excluding Ireland, the difference between exports of goods and services and imports of the same still made a very small positive contribution.
Because of the war in the Middle East, the end of 2025 already seems like an eternity ago. The improvement in confidence that, at the start of 2026, underpinned expectations of a gradual further strengthening of domestic demand over the course of the year has been completely undermined by the war. It is not only the shock to confidence and the high level of uncertainty that are causing a sharp deterioration in the economic outlook. As Europe is a net importer of oil and gas, higher energy prices mean a deterioration in the terms of trade, with a corresponding decline in competitiveness for businesses and a loss of purchasing power for households. The threat of energy shortages and the risk of further disruptions to supply chains could cause the economic damage to rise considerably. All of this necessitates a significant downward revision of growth forecasts. However, the considerable uncertainty surrounding the further course and duration of the war, and its actual consequences – not least in terms of destroyed energy production capacity in the Middle East – makes a precise assessment of these developments highly precarious.
We have revised down our growth forecast, particularly for the second quarter of 2026 and, to a lesser extent, for the remaining quarters of the year. Assuming that the war does not drag on for months and that the destruction remains somewhat under control, a recession will be avoided. We assume that, as during recent previous shocks, the economy will demonstrate sufficient resilience and expect growth in 2027 to be slightly stronger than previously forecast. This translates into a reduction of the expected average real GDP growth rate in the euro area from 1.2% to 0.7% for 2026. The expected slight strengthening of growth in the course of 2027 will be insufficient to offset the weaker carry-over effect from 2026. As a result, the expected average growth rate for 2027 is also lower: 1.3% versus 1.4%.
US growth underwhelms in Q4
The second estimate of Q4 GDP growth came in lower than expected. US GDP grew by only 0.2% quarter-on-quarter in Q4 (see figure 5). The low figure was primarily caused by a 0.3 percentage point negative contribution from government spending. This negative contribution was primarily caused by the record-long US shutdown and is likely to be partly compensated in Q1 2026. Aside from government spending, residential investment and net exports also made slight negative contributions. Inventories recovered from the negative contributions seen in Q2 and Q3. Non-residential fixed investment made a modest 0.1 percentage point contribution, as another strong contribution from largely AI-driven information processing equipment was compensated by negative contributions from structures and transportation equipment. A concerning element of the Q4 GDP report was the slowdown in consumption, which only made a 0.3 percentage point contribution.
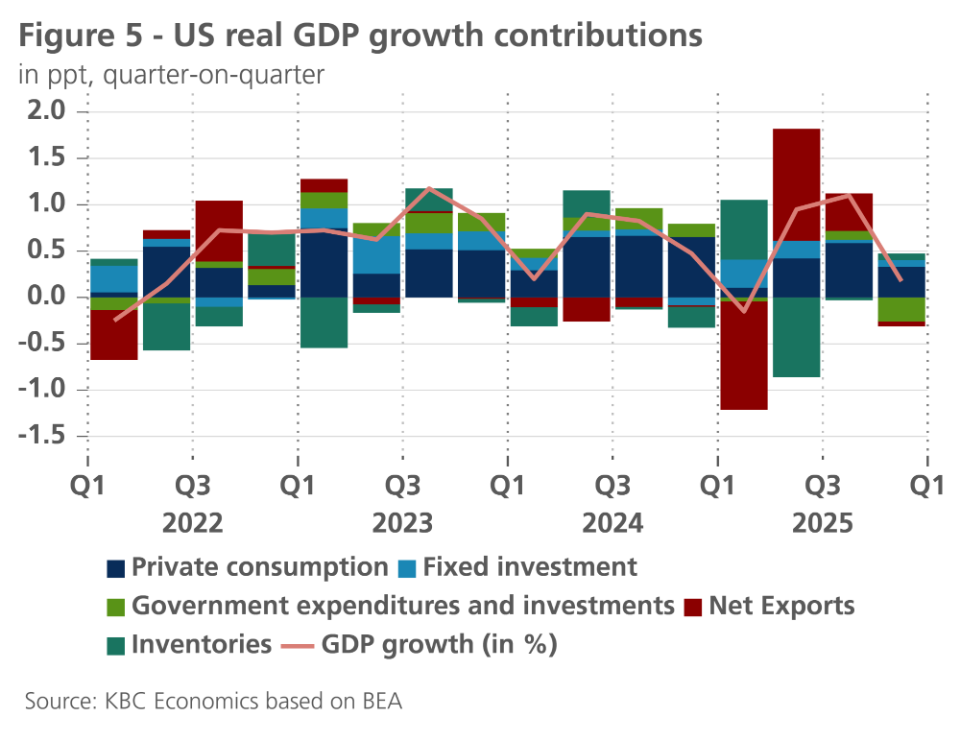
This modest contribution from consumption is set to be repeated in Q1. Personal consumption expenditures only increased by 0.1% in January as consumer confidence remains low. Stronger auto sales point to some improvement in February, however. Non-residential investments are likely to make another solid contribution, given continued elevated data center investments. A substantial, export-led narrowing of the trade deficit in January also points to a strong positive contribution from net exports.
The labour market remains in weak shape, however. Following a 126k increase in non-farm payrolls in January, job numbers declined by 92k in February. The decline was partly caused by colder weather and a (now-resolved) healthcare strike. The unemployment rate also ticked up to 4.4%, while the participation rate ticked down to 62%. The number of those employed part-time for economic reasons declined though. Furthermore, job openings remain fairly stable, indicating that the labour market is softening but is not exhibiting a rapid deterioration.
Looking ahead, the energy shock will put downward pressure on US growth, as higher gas prices will undercut purchasing power of consumers (particularly lower and middle income consumers) and increase costs for non-energy businesses. That said, as the US is a net exporter of energy since 2019, there will be a compensating effect from the energy sector and the net GDP impact is expected to be mild. Overall, we haven’t made any adjustments to quarterly dynamics from Q2 onwards. Our 2026 downgrade of average US real GDP growth (from 2.4% to 2.1%) thus only reflects a downgrade of the Q4 2025 figure. For 2027, we maintain our 1.9% forecast.
China has buffers to weather energy crisis
Many Asian economies are highly exposed to the energy price shock due to their reliance on imported oil and gas. China’s economy, however, has important buffers that will, in the medium term, limit the direct damage to the real economy. First, though China is the world’s largest oil importer, and much of that oil is sourced from the Middle East, China’s energy production is still significantly skewed towards coal (64%), with gas and oil together accounting for 12% of energy production. Meanwhile, diversification towards renewables means that together, solar and wind now account for 47% of total power generation capacity.
Nevertheless, China’s economy would still face important headwinds if hit with significant oil and gas shortages. However, a substantial build up of oil reserves in recent years (1.2 bn barrels estimated at the beginning of 2026), means that China can cover the import losses from the Middle East for roughly 3-4 months before energy shortages become a binding constraint on the economy. A longer lasting conflict with prolonged energy infrastructure scarring and a closure of the Strait of Hormuz into the second half of the year, therefore, would have more substantial impacts on Chinese growth.
For now, we see only a minimal downward impact on Q2 growth, offset in the average annual figure for 2026 by signs of a stronger Q1. Industrial production and retail trade both expanded 0.8% month-over-month in February. Meanwhile, the S&P manufacturing PMI (a business sentiment survey) improved from 50.3 to 52.1 (above 50 signals expansion) while the S&P services PMI surged from 52.3 to 56.7 in February. There may be some seasonal effects from the timing of the holiday season playing a role in the strength of the services sector and retail trade. However, investment also improved, recovering back to positive territory in year-to-date year-over-year terms for the first time in six months at 1.8%. On net, we therefore continue to expect annual average real GDP growth of 4.6% in 2026, in line with the government’s growth target of 4.5-5.0%.
Meanwhile, deflationary pressures in China continue to show signs of a slow abatement. Producer prices declined 0.9% year-over-year in February, the smallest decline since July 2024, possibly reflecting anti-involution efforts at work. Headline and core inflation also both ticked higher, to 1.8% and 1.3% year-over-year, respectively. The higher headline figure was driven by both higher food prices and higher recreation and culture-related prices. The latter likely reflects holiday effects. Together with higher global energy prices, we therefore incorporate a minor upgrade to 2026 and 2027 average inflation from 0.8% to 0.9% and from 1.1% to 1.2%, respectively.
Middle East conflict puts central banks in tough spot
Both the Fed and the ECB reviewed their monetary policy stances last week. Both central banks kept their policy rates unchanged, citing exceptionally high uncertainty in which to conduct monetary policy. The dominant factor in determining monetary policy at the moment is the impact of the current conflict in the Middle East on growth and especially inflation.
In assessing the macroeconomic impact of the energy price shock, there is an important difference between the US and the eurozone. The US is a net exporter of energy. Consequently, for the US as a whole, higher energy prices mean an improvement in the terms of trade. There is therefore a positive income effect for the economy as a whole, despite its uneven distribution between US energy consumers who see their real income fall and US energy producers who gain. This effect is also the main reason why the US dollar has strengthened noticeably against the euro since the start of the conflict.
In contrast, the eurozone is a net energy importer. Thus, increased energy prices represent a deterioration of the European terms of trade in international trade, with an unambiguous negative income effect on the European economy as a whole.
As a result of this difference, the response of the Fed and the ECB to the energy price shock is also not necessarily identical. Indeed, for the ECB, the shock is unambiguously a negative supply shock, while the Fed must additionally take into account the mentioned elements of a (positive) demand shock for the economy as a whole.
Difficult task for the ECB
The conflict in the Middle East poses a particular challenge for the ECB. Unlike demand shocks, supply shocks pose a special challenge for central banks. The ECB has to assess whether the shock will be temporary or longer-lasting. That assessment is almost impossible at the moment. If the shock is temporary and market, consumer, and producer inflation expectations remain anchored around 2% over the medium term, the ECB can more or less stay on the sidelines. In the case of a longer-lasting shock, and the risk of rising inflation expectations, the ECB would have to intervene more forcefully, even if rate hikes would weigh additionally on economic growth. Correctly identifying the nature of the supply shock is a particularly difficult task for a central bank, especially in the current environment of exceptionally high uncertainty.
To deal with this uncertainty, the ECB also presented two alternative scenarios after its policy meeting: an 'adverse' and a 'severe' scenario. The ECB defines the adverse scenario as an increase in energy prices greater than in the baseline scenario, but those prices again fall to the level of 4 March 2026 over the course of the forecast horizon (2028). In the 'severe' scenario, energy prices rise more sharply and remain above the 4 March 2026 level until after 2028. Thus, in addition to the magnitude, the longer duration of the shock (and spillover effects to core inflation) is added here.
The largest negative impact on growth in all three scenarios (including the baseline scenario) is in 2026. The expected impact on headline inflation is more differentiated. In both the baseline and adverse scenarios, inflation peaks in 2026 but falls rapidly towards the ECB's 2% target in 2027. In the adverse scenario, it even falls well below 2% in 2028 due to statistical base effects. In the severe scenario (with a longer-lasting shock), however, inflation does not peak until 2027, with a fall in 2028 to still well above 2%.
For ECB policy, we can draw some preliminary conclusions from this. By choosing its baseline scenario, the ECB indicates that, at the moment, it still mainly interprets the conflict as a temporary shock. Based on this assessment, the ECB could be cautious about changes to its policy rate for the time being.
In addition, the ECB analysis suggests that, to some extent, the same conclusion also applies to the adverse ECB scenario, with a firmer (but still temporary) energy price shock. In this scenario, however, a wait-and-see approach to policy rates is less obvious because core inflation in that scenario is still above the 2% threshold in 2027. Only in the 'severe' ECB scenario is the policy conclusion for the ECB unequivocally different, namely a pronounced interest rate increase. This is mainly due to the duration of the shock and some degree of spillovers into core inflation.
Since we are currently also of the view that the energy price shock will be largely temporary, with an impact concentrated in 2026, we currently assume that the ECB will keep its policy rate unchanged in 2026. However, the uncertainty surrounding this expectation is very high, and crucially depends on further political-military developments in the Middle East. Extreme uncertainty implies extreme data dependence.
Fed also likely to take a wait-and-see approach
After its policy meeting last week, the Fed too presented new projections, the so-called dot plots, that reflect the median estimate of Fed policymakers. Besides higher (!) economic growth in 2026 and 2027, those 'dot plots' also included a higher estimate for 2026 headline inflation and underlying core inflation (both based on the favourite Fed measure, the PCE price index). For 2027, the median inflation projection already falls back to a level close to the 2% target. Plausibly, this latest upward revision only partially took into account the inflationary momentum of the current energy price shock.
In addition, the expected median interest rate path remained unchanged from the December projections, according to Fed officials. It is a very cautious path with one interest rate cut of 25 basis points each in 2026 and 2027. The median estimate of long-term policy rates was little changed (3.1%).
It was notable that the Fed's communication hinted at extremely high uncertainty. In addition to the size of the shock, this mainly concerns its duration and the degree of possible spillovers to inflation expectations and economic sentiment. This also means that the 'dot plots' presented in March are likely to have little predictive value. Consequently, we assume that the Fed will also be extremely data-dependent for the rest of 2026. Our best possible assessment based on currently available information is that the Fed will be cautious in 2026 and leave its policy rate unchanged for the rest of the year. Among other things, the increased Fed estimate of core inflation for 2026 (for what it is worth in this exceptional month) suggests that there may well be no further rate cut in 2026.
Whatever it will be, the conflict in the Middle East could take a new turn any day. In the words of ECB President Lagarde, future ECB decisions will be data-dependent, and so will the Fed.
The nature and consequences of current political-military developments are extremely uncertain and virtually impossible to predict. Perhaps in part to hedge against that extreme uncertainty, the money market at one point priced in the possibility of tightening by both the Fed and ECB in 2026. For the Fed, that expectation is currently off again after the increased likelihood of a negotiated solution to the Middle East conflict.
Bond yields and spreads under upward pressure
Both US and German 10-year bond yields recently experienced moderate increases on balance. In particular, the highly volatile market expectations for Fed and ECB monetary policy played a role. 10-year yields are currently in line with our expectations. German 10-year rates are likely to continue hovering around 3% during 2026, while US 10-year rates are likely to continue gradually rising from currently around 4.35% to 4.50% by the end of 2026.
It is also notable that recently German 10-year real bond yields, adjusted for inflation expectations, are falling, in contrast to US real yields. Plausibly this is a sign that financial markets fear the negative impact of the energy price shock on European growth.
In addition, yield spreads for EMU government bonds versus Germany have also been increasing since the start of the conflict. This is especially true for countries that are relatively more vulnerable to the Middle East conflict. Especially notable here is the widened spread for Italy, which relies relatively heavily on gas imports from the region for its energy supply.
All historical prices, statistics and charts are up to date as of 23 March 2026, unless otherwise stated. The positions and forecasts provided are those as of 23 March 2026.