

Economic Perspectives February 2024
Read the full publication below or click here to open the PDF.
- The war in the Middle East is causing disruptions in global supply chains as shipping through the Suez Canal is around 65% lower than usual, forcing delays in deliveries. The troubles in the Middle East are also putting upward, albeit still limited, pressure on oil prices, which rose by 6% to 80.6 USD per barrel in January. Increasing US oil production is stopping oil prices from rising further. Gas prices remained flat, however, at 30 EUR per MWh in January. Favourable winter weather conditions and high gas reserves keep gas prices down. Despite persistent geopolitical tensions, financial markets do not price in any critical energy crisis in the near future.
- Inflation in the euro area fell from 2.9% to 2.8% in January, thanks to lower food price inflation. Core inflation declined from 3.4% to 3.3%. The fall in core inflation was fully accounted for by goods price inflation (excluding energy). Indeed, services inflation stabilised at 4%. As the latest inflation figures were in line with our expectations, we maintain our outlook for average inflation of 2.1% in 2024 and 1.9% in 2025.
- In the US, inflationary pressure remains strong as inflation only decreased from 3.3% to 3.1% in January. Within non-core components, food price inflation accelerated, while energy prices declined. Core inflation remained broadly unchanged at 3.9%. Core goods declined thanks to a sharp drop in used car prices. In contrast, services and shelter inflation accelerated rapidly. Consumer inflation expectations declined notably, however. All in all, we maintain our 2.8% and 2.3% forecasts for 2024 and 2025 respectively.
- In line with our expectations, both the Fed and ECB have kept their policy rates stable in last month’s policy meetings. We expect both central banks to only start cutting rates in Q2 2024 and to cut rates 5 times this year. Bond markets readjusted upwardly in response to better than expected data.
- In the euro area, growth again stagnated in Q4, probably due to low private consumption and negative investment growth contributions. There were wide growth divergences within the euro area economies. Southern economies notably outperformed their Northern peers (causing spreads to fall). Unfortunately, forward-looking indicators do not suggest an imminent recovery. Nonetheless, the strength in the labour market and the pick-up in bank lending are encouraging. We maintain our 0.5% and 1.3% forecasts for 2024 and 2025 respectively.
- In the US, GDP growth surprised strongly on the upside at 0.8% last quarter, thanks to both strong domestic demand and a positive development of the net export growth. Over the course of 2023, the US economy grew by a strong 2.5%. Moreover, our GDP nowcast suggests this strong performance could be repeated in Q1 2024. Business sentiment indicators increased for both manufacturing and services, while the labour market added an impressive 353k jobs and unemployment remained at 3.7% in January. For the coming quarters, we expect continued productivity growth and migration, along with strong government spending to support growth in 2024. We thus upgrade our 2024 forecast from 1.2% to 2.5% (partly due to strong overhang effects), while maintaining our 2% forecast for 2025. Given this stronger economic performance, we also expect the USD to remain strong this year.
- For China, we have revised up the 2024 GDP growth outlook modestly to 4.5%, but risks remain tilted to the downside. An especially weak CPI-inflation reading in January (-0.8% year-on-year) points to increased risks of a deflationary spiral that could further weigh on consumer and business confidence.
Global economy showed major divergences in 2023
The major economic blocs showed important divergences in 2023. The clearest outperformer was the US, which grew by an impressive 2.5%, as domestic demand and private domestic investment remained strong. China meanwhile met expectations by slightly surpassing the unambitious 5% growth target set by the CCP. The clear underperformer was the euro area, which eked out a meagre 0.5% growth, as German growth was negative.
This picture is unlikely to change dramatically in 2024. In the US, strong government spending, easing monetary conditions and healthy productivity growth could keep growth above 2%. In China, the real estate crisis and the disappearance of covid-related base effects will push down growth, but we still expect growth to surpass 4%. In the euro area, the energy crisis along with tight monetary conditions will gradually wane with some recovery later in the year (growth below 1%).
War in the Middle East is disrupting supply chains
Yemeni Houthi attacks on ships entering the Red Sea continue to disrupt global supply chains. Red Sea shipping is now around 65% lower than usual as a result. Shipping times from Asia to Europe have increased significantly as ships are now mostly diverted via South-Africa. US-UK strikes at Houthi military bases have so far not stopped Houthi hostilities.
The war in the Middle East is also putting upward pressure on energy prices. Oil prices increased by 6% in January to 80.6 USD per barrel in the wake of escalating tension between the US and Iran. On 28 January, a drone attack by Iranian-backed militias in Iraq, killed three American soldiers at an outpost in north-eastern Jordan. In retaliation, US bombers hit more than 85 targets in Iraq and Syria, while President Biden suggested more strikes would follow. The escalation in US-Iran tension raises the risk of a full-blown war between the US and Iran, a major oil producer.
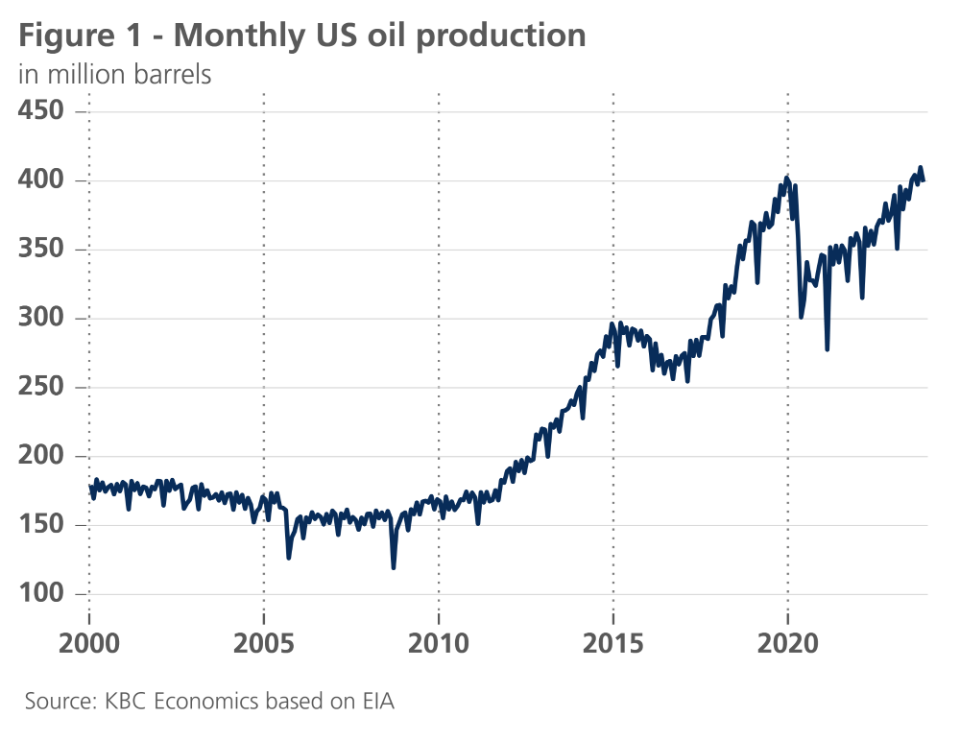
The Houthi strikes have also put upward pressure on oil prices. That said, major disruptions of Middle Eastern oil supply have been avoided thanks to larger use of overland pipelines and the rerouting of tankers around Africa. Furthermore, sky-high non-OPEC oil supply (especially US shale) is keeping oil prices in check (see figure 1).
Gas prices remained flat last month at 30 EUR per MWh. They have halved since January last year. Favourable winter weather conditions and high gas reserves (at 69%) keep prices down. Food prices declined by 1% versus last month, thanks to successful cereal harvests and lower meat demand. Food prices are now 10.4% lower than a year ago.
Euro area inflation slightly lower again
Euro area inflation fell to 2.8% in January from 2.9% in December 2023. The steepest decline occurred in food price inflation (from 6.1% to 5.7%), while the fall in core inflation was much more limited (3.3% versus 3.4% in December) and the fall in energy prices weakened (-6.3% in January versus -6.7% in December). The fall in core inflation was only accounted for by goods price inflation (excluding energy). Indeed, services inflation stabilised at 4%. Services inflation thus remains relatively persistent, with the January figure confirming that services inflation is cooling more slowly and with more difficulty. This slowing disinflation is in line with our scenario. We therefore maintain our outlook of average annual HICP inflation of 2.1% in 2024 and 1.9% in 2025. The outlook for core inflation for 2024 has been raised slightly from 2.4% to 2.6% due to the slightly higher than previously estimated services inflation and the greater weight given to services inflation in 2024 after the annual revision of the component weights of the consumer price index.
US inflationary pressure remains elevated
US inflation figures remained strong in January as prices increased by 0.3% on a monthly basis. Headline inflation decreased from 3.3% to 3.1%. Food prices increased by a surprisingly strong 0.4% last month, while energy prices declined by 0.9%.
Core inflation remained broadly unchanged at 3.9%. Within core components, core goods decreased by 0.3% last month. The decline was mostly a result of a sharp decline in used car and truck prices, which declined by 3.4% last month.
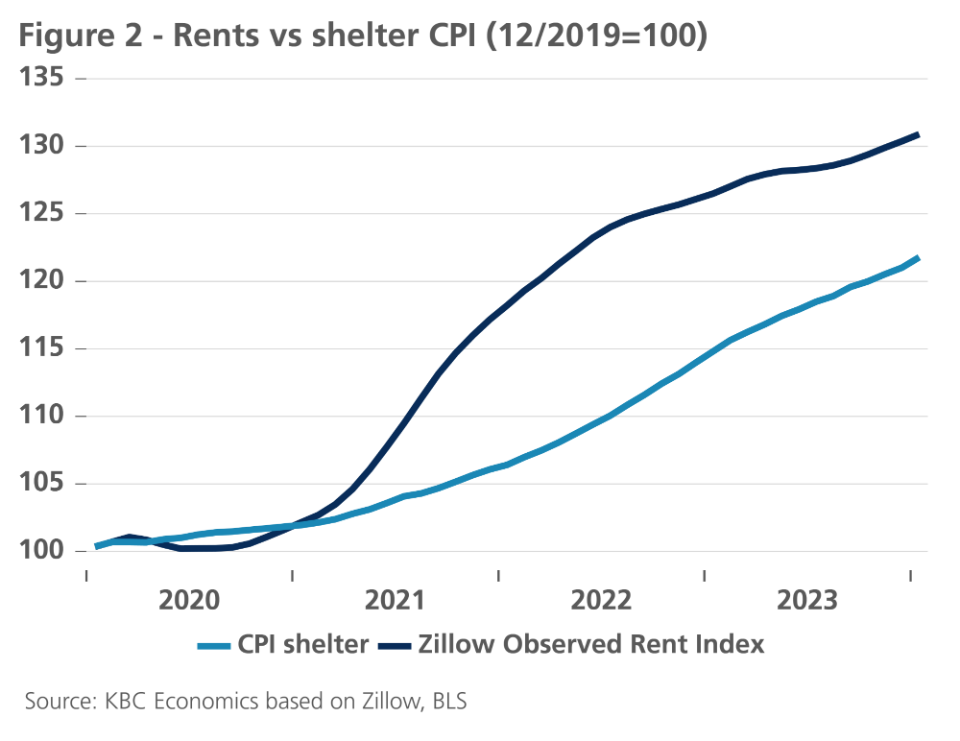
The decline in core goods stands in sharp contrast with the worrying increase in shelter and services prices. Shelter prices increased by a solid 0.6%, as owner equivalent rent accelerated, and hotel prices made a big jump. Unfortunately, recent accelerations in market rents suggest it might take a while before shelter prices cool down (see figure 2).
Core services (ex. shelter) accelerated by a whopping 0.7% last month. Service inflation accelerated across most major categories. The service price increases are likely caused by rising wages, as average hourly earnings rose by 0.55% last month. That said, unit labour cost increases remain under control, as the wage acceleration is being compensated by higher productivity numbers.
Not all inflationary news was bad last month, however. The Michigan survey indicated consumer expectations of the year ahead-inflation declined from 3.1% to 2.9%.
All in all, though the rising shelter and services are a cause for concern, we take comfort from the modest unit labour cost increases and the declining inflation expectations. We thus maintain our 2.8% and 2.3% forecasts for 2024 and 2025 respectively.
Fed in no rush to cut interest rates
Our interest rate scenario remains unchanged from last month. Indeed, the new information that became available was consistent with our view, and also moved market expectations regarding Fed and ECB policy in 2024 in the direction of our scenario.
We maintain our view that the Fed will cut its policy interest rate by 25 basis points for the first time in June, kicking off an easing cycle reducing rates to 4.125% at the end of 2024 (in steps of 25 basis points). The policy rate will be cut further to around 2.875 by the end of 2025, which we consider a neutral level. With the five foreseen rate cuts in 2024, this positioned us between, on the one hand, the three cuts in the Fed governors’ dot plots, and, on the other hand, market expectations that until recently priced in up to six rate cuts for 2024 from March on.
However, strong macroeconomic data over the past month, and in particular the higher than expected January inflation figure for the US (together with upward revisions of historical data) caused market expectations to move closer to our scenario. This is in particular the case for the start date of the rate cutting cycle (June). The most recent market expectations went even further and expect only four rate cuts of 25 basis points each in 2024, as opposed to our expectations of five rate cuts.
The release of the strong fourth-quarter GDP growth figure for the US made it clear that there are no signs of an economic slowdown. Moreover, the much better-than-expected January jobs report (and the upward revision of net job creation in December) illustrated that the Fed interest rate hikes have so far had little or no weight on economic growth. At the same time, inflation dynamics in recent quarters are also increasingly coming into line with the Fed's inflation target.
Based on these data, Fed Chairman Powell stated in late January that the Fed is in no hurry for its first rate cut. The Fed is waiting for further confirmation of the disinflationary trend and also has a dual policy objective that includes maximum sustainable job growth in addition to price stability. A rate cut from March on therefore seemed unlikely to Mr. Powell. In that context, the twice as strong as expected jobs growth in January is an additional argument for a wait-and-see approach by the Fed.
Since June 2022, the Fed has been normalising its balance sheet. To do so, it is reducing its balance sheet at the pace of 95 billion USD per month (60 billion in government bonds and 35 billion in Mortgage-Backed Securities). After its December policy meeting, the Fed announced that a tapering of that pace is coming closer. In late January, Fed Chairman Powell stated that the details will be discussed at the Fed meeting in March. We therefore expect that the Fed will begin tapering its QT during 2024, and that the end result will be a balance sheet size that still provides ample excess liquidity to the market.
ECB policy closely aligned with Fed
Our interest rate scenario for the ECB also remains unchanged. We expect that the ECB will cut its rates by 25 basis points for the first time in June, followed by four more cuts in 2024 of 25 basis points each. Consequently, by the end of 2024, the deposit rate will be 2.75%. For ECB policy too, market expectations recently moved in the direction of our scenario, specifically expecting five rather than six 25 basis point rate cuts in 2024. The market still hesitates between a start of the rate cutting cycle in April or June. We consider a June start of the easing cycle more consistent with the forward guidance of ECB President Lagarde, recently confirmed by ECB Board member Schnabel. According to her, the final phase towards the 2% inflation target may be the most difficult and the ECB wants to see more confirmation (data) that rising unit labour costs would not cause (core) inflation to settle persistently above 2%.
The ECB's quantitative policy framework remains unchanged as set at the December 2023 ECB meeting. The reduction of its APP portfolio by not reinvesting continues, while from the second half of 2024, the PEPP portfolio will also not be reinvested for an average monthly amount of EUR 7.5 billion. From the beginning of 2025, reinvestments will cease completely.
Around the end of the first quarter, the ECB is likely to complete the review of its operational policy framework. The likely outcome for the medium term, in our view, is a so-called ‘supply-driven floor system’ for money market rates. This amounts to a continuation of the current practice, which was initially introduced during the financial crisis starting in 2008, characterised mainly by the large amount of excess liquidity in financial markets.
Bond yields passing a temporary peak
As expected, US and German 10-year interest rates had a partial upward correction in early February after the prior decline. The moderate increase got an extra momentum after the higher than expected inflation figure for January in the US. We expect both interest rates to be around their peak at current levels. Towards the year-end of 2024, US interest rates may fall slightly to 4%, while German rates are likely to remain broadly unchanged in 2024. In 2025 and beyond, however, a moderate rise in German 10-year bond yields is likely. Indeed, we consider the current bond yield level to be too low from a fundamental point of view. After all, unlike the US, the euro area and German yield curve will still be significantly inverted at the end of 2024. The fundamental upside potential for German 10-year bond yields also becomes clear when we take inflation expectations into account and look at real bond yields. In the US, real yields are already broadly positive, while they remain around 0% for the German real yield. In the medium term, a moderately positive real interest rate seems likely for the euro area as well.
Euro area economy takes a breather
According to Eurostat's preliminary flash estimate, the gross value added produced in the euro area stagnated (in real terms) in the fourth quarter of 2023. This zero growth was fully in line with our expectation, but differences in GDP growth across countries were slightly larger than expected. The German economy (-0.3%) fell more sharply and Spain (+0.6%) grew more strongly, while the Italian economy, expanding marginally (0.2%), avoided an expected contraction. The economies in southern Europe, incidentally, performed markedly better than the more northern economies. The strongest growth was recorded in Portugal (+0.8%). In this respect, the strong growth of the Belgian economy (+0.4%) is also a positive outlier, not only compared to the German economy, but also to the French economy, which recorded a standstill (0.0%).
The drivers of these growth differences are not yet very clear as information on the composition of growth is still scarce and incomplete. Nevertheless, it seems clear that in both stronger-growing and weaker economies, household consumption was rather sluggish and investment made a more or less strong negative growth contribution. Presumably, the differences should be attributed mainly to the growth contribution of net exports and inventories.
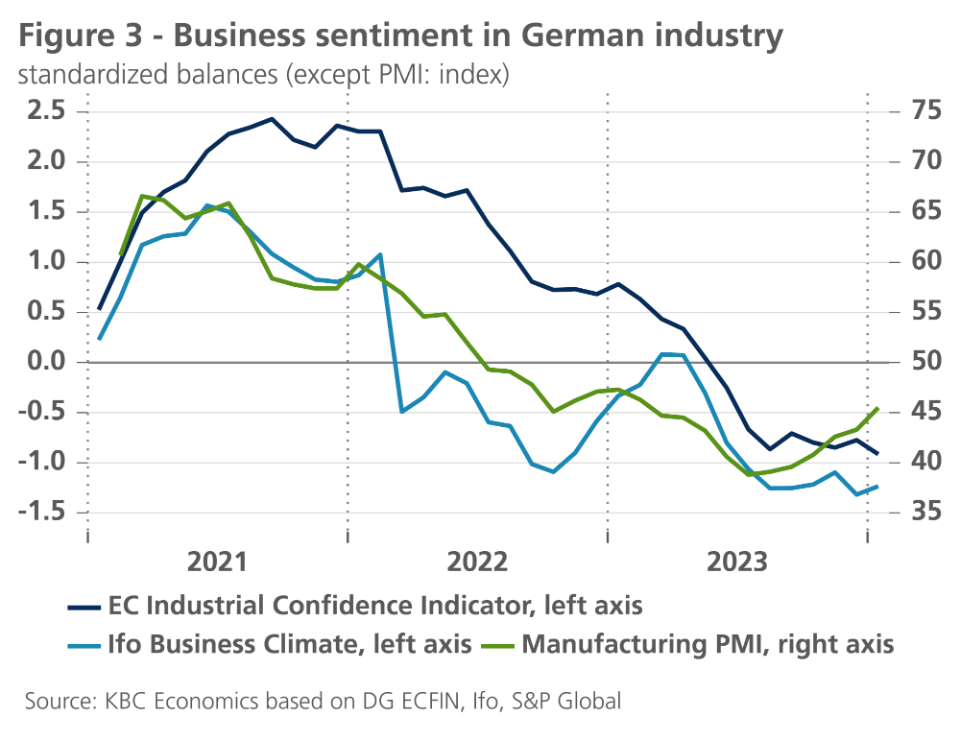
Short-term indicators, meanwhile, do not yet suggest a sharp and imminent strengthening of economic momentum. The improvement in consumer confidence that seemed to have resumed momentum in autumn 2023 gasped again around the turn of the year, while improving expectations in the retail sector are once again fading. While most indicators on business confidence in the euro area point to a bottoming out, they do not yet show a strong recovery in confidence. For German manufacturing in particular, this recovery in confidence is not confirmed by other indicators on business confidence (see figure 3). The short-term trend in manufacturing output and incoming orders (adjusted for volatile large orders) also remain negative there. Therefore, we wait for signs that the unexpectedly strong and resilient growth of the US economy would provide a boost to the European economies, and especially for Germany, as it used to do in the past.
Surprisingly, in the face of weak economic activity, the labour market remains very resilient. The euro area unemployment rate stabilised at its historical low of 6.4% in December 2023, and the number of unemployed has started to fall again. As real wages are also rising, the conditions for a recovery in consumption growth are in place, although (geopolitical) uncertainty may make such a recovery more difficult.
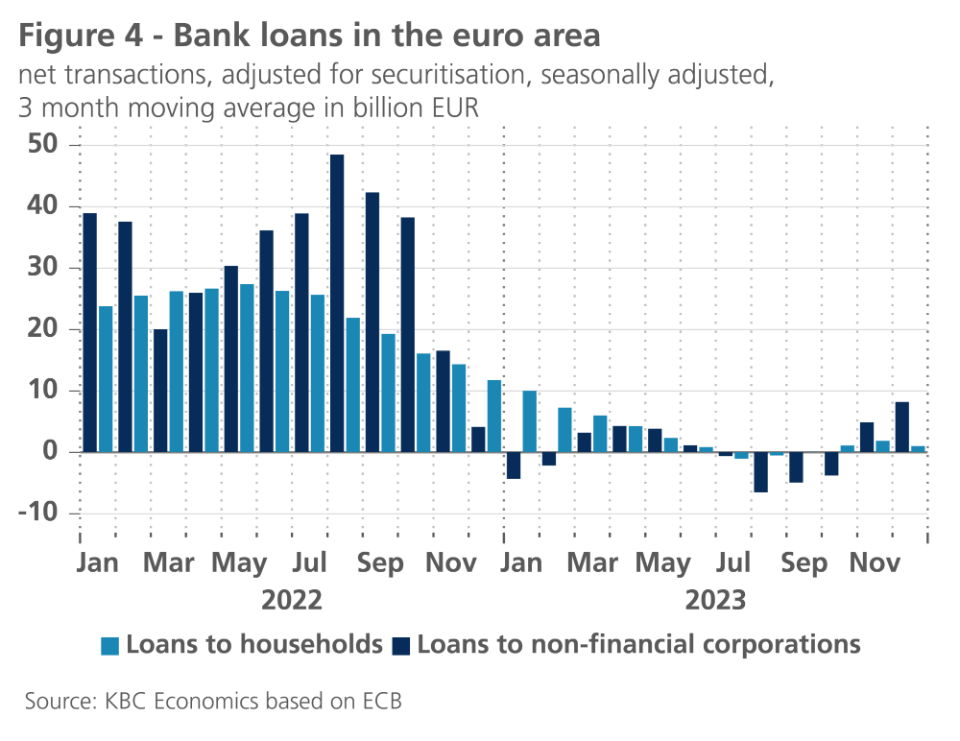
Equally encouraging is the fact that bank lending to both households and businesses is starting to rebound (see figure 4), although according to the ECB's recent Bank Lending Survey, banks still remain relatively restrictive in their lending policies. The outlook for demand for bank credit is also improving, according to that survey. Credit to business rebounded, confirming the indications from the European Commission's Autumn Business Investment Survey, which projects investment growth for 2024. That too is expected to contribute to an economic recovery, especially if the ECB starts cutting policy rates in June, as expected.
All in all, we thus maintain our growth scenario: after a period of quasi-zero growth during the winter months, economic growth will strengthen in the second and third quarters of 2024 and maintain a moderate path thereafter. This would limit euro area real GDP growth to 0.5% on average in 2024 - the same as in 2023 - and to 1.3% in 2025. There is a possibility though that strong growth in the US economy will give the European recovery an earlier and stronger start.
Stronger Southern European economic performance brings down spreads
We confirm our view on intra-EMU bond yield spreads versus Germany. Currently, those spreads are relatively low due to three factors. First, ECB policy interest rates have now almost certainly peaked with first easing steps expected already in 2024. With ‘risk-free’ German yields at or close to peaking, the ample amount of liquidity will once again become more engaged in search-for-yield in peripheral government bonds. A second factor is the relatively stronger economic performance of peripheral euro area economies compared to the German economy. Finally, the ECB's Transmission Protection Instrument (TPI) enjoys great credibility with financial markets. This instrument allows the ECB, if necessary, to effectively curb unwanted widening of sovereign spreads. The strong credibility is partly because the activation of the TPI is ultimately a discretionary power of the ECB Governing Council. This makes the TPI potentially even a more powerful instrument than the Outright Monetary Transactions (OMT), which do have formal conditions attached, notably an ESM assistance program.
Nevertheless, we continue to expect spreads to move slightly higher over the somewhat longer term. Indeed, in 2024 a whole range of (geo)political risks lurk in addition to the ‘busy’ election calendar in Europe. This could lead to difficult government formations (including in Belgium). Together with the inevitable discussions during the preparation of the budgets for 2025, which then have to comply with the renewed (and de facto stricter) rules of the Stability and Growth Pact (SGP), this will cause gradually rising intra-EMU spreads in the course of 2024.
In turn, our forecast for equilibrium spreads is based on the sustainability of public debt in the countries concerned. We take into account expected interest rates, nominal growth, the level of the debt ratio and the political will to achieve an SGP-consistent primary budget balance. From this follows our differentiation for different countries.
Strong supply shocks support US growth
The US economy keeps surprising positively. In Q4 2023, GDP increased by 0.8% quarter-on-quarter. Personal consumption expenditure was again the main contributor (0.5% quarter-on quarter). Net exports also made a strong positive contribution, while also inventories surprised positively. Government expenditures also made a solid contribution.
The good news on the US economy keeps rolling in. Business sentiment improved significantly for both manufacturing and services in January. Consumer sentiment also improved markedly. Non-farm payrolls increased by a very impressive 353k jobs in January, while prior months were revised upwards by 126k. Unemployment remained at a low 3.7%.
There are major reasons why the US keeps overperforming our expectations (and keeps resisting pressure from monetary tightening). On the demand side, public spending remains at record levels. According to the CBO, the US deficit reached 6.3% in 2023 and is projected to remain above 5% in the coming decade.
On the supply side, labour productivity grew at a rapid clip in 2023. It was 2.7% higher in Q4 2023 than in Q4 2022. It remains to be seen what the exact cause of this high productivity growth is. On the one hand, it could be a result of easing supply chains (a temporary effect). On the other hand, it might be a result of new technological advancements, such as generative AI, which will have longer-lasting effects. Record oil and gas output is also providing a nice supply boost.
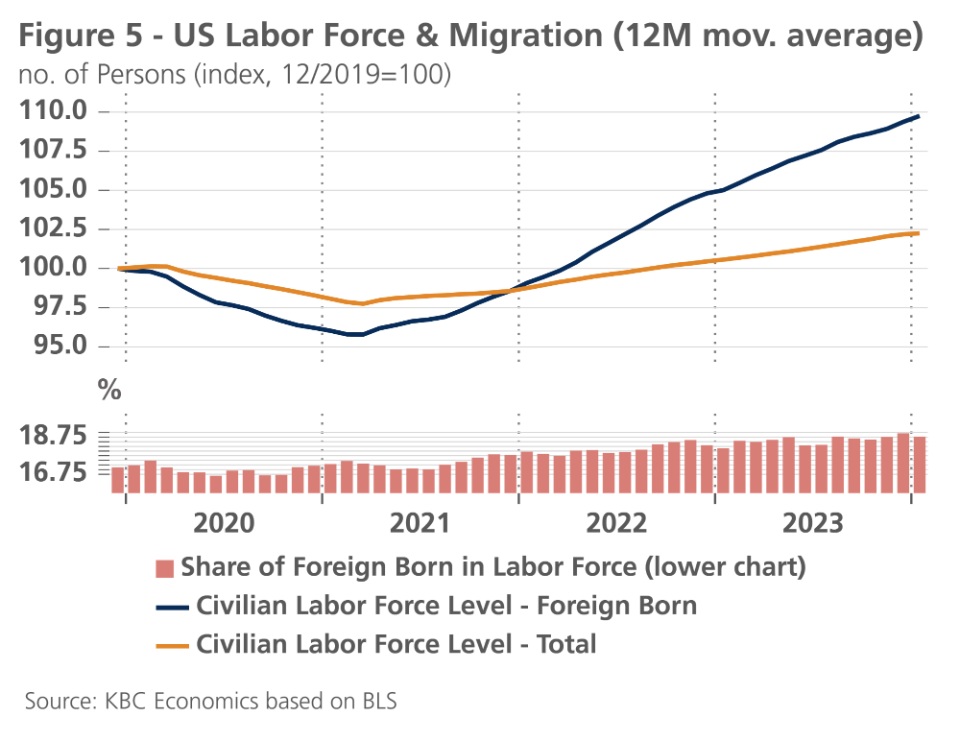
Another major positive supply shock is provided by record levels of immigration, which is driving up labour supply (see figure 5). The surge in immigration is on the one hand driven by increasing instability in Latin America. On the other hand, the tight labour market makes immigrating to the US very attractive. The number of vacancies per unemployed remains at an elevated 1.8.
This combination of a positive government-driven demand shock with major supply shocks, along with impressive Q4 GDP figures pushes up our 2024 GDP growth forecast from 1.2% to 2.5%. We maintain our 2% 2025 forecast.
Strong US economy supports the dollar
As the market adjusted its expectations of Fed policy in 2024, the US dollar strengthened sharply against the euro to around 1.07 USD per EUR. The particularly strong US labour market and the sharp improvement in the current account also contributed to this appreciation. Since we have also significantly raised our growth forecasts for the US economy for the first quarter of 2024, current dollar strength is likely to persist near the current rate for some time. For the medium term, however, we maintain our assessment that the US dollar, at its current rate, is fundamentally overvalued. A moderate and trending depreciation of the dollar from the second half of 2024 therefore remains likely.
Deflation threatens Chinese growth
The economic outlook for China is little changed compared to last month. Slightly higher growth momentum at the end of 2023 and the start of Q1 2024 leads us to revise up our 2024 growth outlook modestly to 4.5%. This would reflect moderate growth as confidence gradually improves in the coming quarters but would still be – outside of the pandemic years – the lowest growth recorded in China since 1990. Meanwhile, risks remain tilted to the downside as major structural challenges still hang over the economy, and the real estate crisis could evolve further with larger impacts for the wider economy.
Surprisingly weak inflation figures in January (at 0.3% month-on-month or -0.8% year-on-year) raise another concern. While the negative headline figure is mostly driven by food and energy prices, the core figure has also been on a downward trajectory over the medium-term and came in at only 0.5% year-on-year in January. If deflationary pressures become entrenched, it will not help revive consumer and business confidence, which is sorely needed to get Chinese growth back on a sustainably strong pathway. The risk of deflation is especially important given the already high debt load of Chinese households, mostly due to mortgages. If deflation starts to negatively impact wages and income and increases the debt burden in China, a rebound in the real estate sector will become even more elusive (for now, per capita disposable income growth remains well above inflation at 4.8% year-on-year).
All historical quotes/prices, statistics and charts are up-to-date, through February 16, 2024, unless otherwise noted. Positions and forecasts provided are those as of Feb. 16, 2024.