

Economic Perspectives April 2021

Read the full publication below or click here to open the PDF.
- The latest data and economic and pandemic developments are in line with our economic base scenario. While the UK and the US are in a more advanced phase of the vaccination cycle and therefore in a position to lift lockdown measures relatively soon, continental Europe will only see a notable acceleration of its growth dynamics in the second half of 2021.
- As was the case in last month’s assessment, all in all, the global medium-term inflation outlook remains moderate, with average inflation in the euro area expected to remain below the ECB’s inflation target of below, but close to 2% in coming years. In the near term, however, headline inflation is set to move higher. Extreme volatility in the year-on-year energy price movements, mainly due to large swings of oil prices in 2020 as a result of the lockdown measures at that time, will translate into increasing headline inflation in the coming months. It should be emphasised that this mechanical and temporary phenomenon is likely to fade subsequently as the statistical base effects caused by extremely low oil prices in Q2 2020 disappear from the year-on-year comparison. Beyond short term volatility, we expect a moderate (upward) tendency in underlying core inflation, both in the US and the euro area, as activity improves but substantial economic ‘slack’ persists.
- Reflecting the advanced phase in the vaccination cycle of the US economy, the strong resilience of the US labour market and the unprecedented fiscal relief and support packages, we have upgraded our US growth forecast for 2021 and 2022 to 6.2% and 3.8% respectively. Although the US recovery is likely to generate positive spill-over effects, progress in vaccination remains the most important precondition for reopening and economic recovery in Europe. In that respect, we maintain our outlook for the euro area of a gradual economic recovery from the second half of the year, resulting in approximately 4% growth this and next year.
- Recent macro-financial developments are expected to continue. Global bond yields are expected to moderately rise further in Q2 2021 to about 1.90% for US yields and -0.15% for German yields. The current upward trend for US yields is mainly driven by a rise in real yields. The strong correlation between global benchmark bond yields also imply an upward pressure in German yields, albeit to a lesser extent because of the ECB’s announcement of a step-up in its bond purchases in the second quarter. Changes in real interest rate differentials are also expected to generate some temporary euro-weakness affecting also the US dollar euro exchange rate.
- As the vaccination rollout proceeds in most economies, the pandemic may gradually move to the background as the main source of macroeconomic risk. Attention will again shift to other vulnerabilities, such as the trend of deglobalisation, the (lack of) support for further European economic integration, emerging markets’ risks in the face of an upward US interest rate cycle and some financial market stability concerns.
Pandemic and business cycle
This vaccination cycle has implications for the global business cycle as well. The economic impact of the most recent wave has been less severe than what may have been expected based on the experience of the previous waves in 2020. This is in part due to the fact that the policy measures have become more targeted, avoiding a ‘one size fits all’ approach to shutting down economic activity across different sectors. Moreover, as businesses have had time to adapt, economies have better learnt to ‘live with the virus’ and became more adaptive and resilient. The result is that with each new pandemic wave, the cost in terms of lost economic output (though not in terms of health and human costs) has decreased.
Sources of economic resilience
The latest pandemic wave has translated into a multi-speed global recovery, at least for 2021, with continental Europe on the slow end, the US and the UK in the middle, and with the Chinese economy in the most advanced position. These variations in the recovery phase can in part be explained by each economy’s position in the vaccination cycle, and hence also the degree to which economic activity can remain open. Another distinguishing factor is the degree of resilience and the structure of the domestic economy.
The relatively strong resilience of the US economy is reflected in the recent labour market rebound in March. The re-opening of many ‘social contact’ sectors prompted an increase of some 916,000 in non-farm employment last month, lowering the officially reported unemployment rate to 6.0% from the 14.8% figure seen in April 2020 at the onset of the Covid-19 pandemic. The current unemployment rate is now only 2.5 percentage points above its pre-pandemic rate of 3.5% in February 2020. The recent fall in the headline unemployment rate , however, masks the fact that labour force participation is still significantly lower than before the pandemic.
Nevertheless, the improvement of the labour market reduces the risk of longer-term economic scarring, which would weigh on the longer-term growth outlook for the US economy. The longer the unemployment rate remains elevated, the higher the risk is that initially temporary unemployment becomes permanent and structural in nature, leading to lasting exits from the labour force altogether (i.e. a decline in the labour force participation rate). In Europe, where the labour market has traditionally been less flexible than in the US, this risk of labour market hysteresis remains particularly relevant.
A potential source of resilience for both the US and European economies is the possible existence of pent-up demand for consumption and investment goods. As pandemic restriction measures will gradually be eased, at least part of the ‘forced’ household saving buffers (caused by a lack of spending opportunities) will be spent by consumers. To the extent that job prospects gradually recover, precautionary savings may also be partly run down again. Moreover, as economies are moving forward in the vaccination cycle, uncertainty about the economic outlook should steadily decreases from the second half of 2021 onwards, paving the way for an eventual pick-up of corporate investment that were temporarily postponed during the pandemic.
Fiscal stimulus
The emerging speed of recovery in the US is not only due to the traditionally flexible nature of the American economy, but also – and to a large extent - due to the unprecedented scale of fiscal support packages. The CARES act of March 2020 (which amounted to 2 trillion USD) and follow-up packages (approved in December 2020 for the amount of 900 billion USD and in March 2021 for the amount of 1.9 trillion USD) were mainly relief packages providing unprecedented income support to bridge the crisis. These packages arguably have less impact on lifting the structural economic growth potential, since they were primarily aimed at relief rather than at investment and additional stimulus. Plans for another fiscal package of more than 2 trillion USD (over a period of 10 years) are largely aimed at stimulating aggregate demand and boosting potential output via a broad definition of infrastructure investments. In continental Europe, by contrast, both the current pandemic situation and the scale and speed of fiscal policy support are less favourable. Compared to the US fiscal packages, the volume of the Next Generation EU programme (750 billion EUR committed in the period 2021-2023) is relatively modest. However, it should be noted that in Europe, national fiscal stimulus measures have played a much more prominent role.
The European economy may nevertheless benefit from the global fiscal stimulus, despite the more modest fiscal effort in the euro area itself. In its latest Interim Economic Outlook of March 2021, the OECD refers to a model-based analysis that suggests that the approved US fiscal stimulus package (which does yet include the proposals for the longer-term infrastructure investment package) could not only raise US economic output in the first full year after implementation by enough to eliminate the spare capacity currently estimated to exist in the US economy, but it could also significantly stimulate demand in other economies via the international trade channel. According to the OECD estimate, the largest beneficiaries of the estimate would be the neighbouring economies of Canada and Mexico, with their output rising between 0.5% an 1% in the four quarters after the stimulus takes effect. According to this analysis, the euro area and China may benefit from a boost to their GDP by between 0.25% to 0.5% over the coming years.
Against this background, we upgrade our growth forecast for the US to 6.2% in 2021 and 3.8% in 2022, while we leave our outlook for the euro area and China broadly unchanged.
International trade back to pre-pandemic levels, supporting the recovery
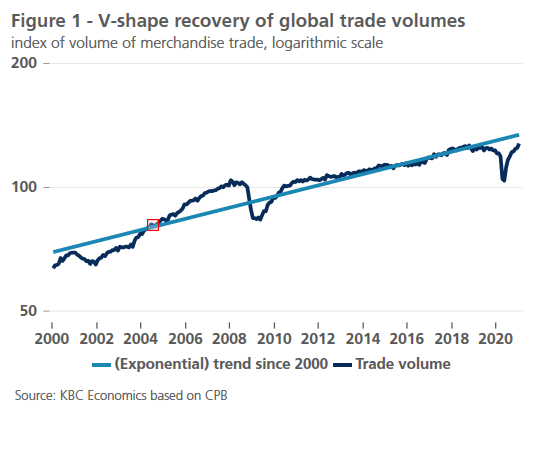
This OECD analysis highlights the importance of international trade as a driver supporting global growth. During the pandemic, international trade has indeed proven to be quite resilient. The evolution of global trade in goods (with data available until January 2021) displays a V-shape recovery that puts the latest trade volumes not too far from its trendline of the past two decades (see Figure 1). This V-shape pattern is quite different from the wide U-shape after the financial crisis. This supports the view that the recovery in trade, and by extension global output, may now happen faster than after the financial crisis. Not only is the evolution of international trade a good indicator of economic activity, but it is also an important driver of growth, by making full use of production specialisation in global value chains along the line of economies’ comparative advantages (see Box 1). This helps to avoid resource misallocations and to safeguard potential growth and total factor productivity, thereby reducing the risk of a scarring effect caused by the pandemic.
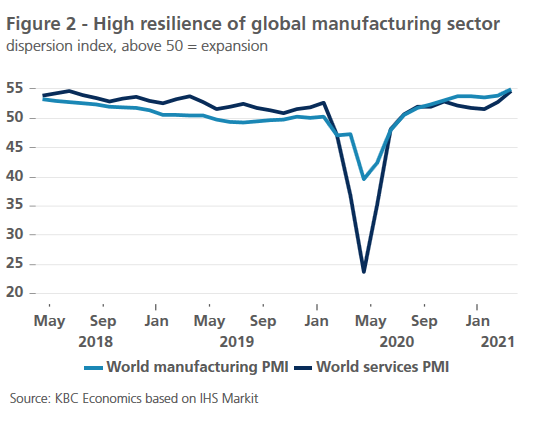
The role of international trade in mitigating the current pandemic shock is also reflected in the fact that economies and sectors that are relatively more exposed to international trade are performing better than those that are more oriented towards the domestic economy. For example, the global PMIs for the manufacturing sector (a proxy for the tradeable good sector) has fallen less at the onset of the pandemic in Q1 2020 than the PMI for the services sector (serving as a proxy for the non-tradeable goods sector). Moreover, the manufacturing PMIs recovered to a higher level as well (see Figure 2). The V-shape recovery of both the manufacturing and the services sentiment indicators is also consistent with the V-shape recovery that we observe in international trade volumes.
Box 1 – Global trade disruptions are a nuisance but not a crisis
Global trade has rebounded swiftly following its collapse in the first half of 2020. This recovery in traded goods, however, has also resulted in bottlenecks, supply shortages (particularly for semiconductors) and surging shipping costs globally. While these disruptions should be seen as temporary, prolonged disruptions to global trade could present a further headwind to the post-pandemic economic recovery.
In many ways, the ongoing trade disruptions can be seen as the result of disjointed supply and demand dynamics. With semiconductors, for example, a temporary drop in demand for cars at the outset of the pandemic led manufacturers to cut back on supply orders while demand for consumer electronics soared. As demand for cars bounced back sooner than expected, chip manufacturers had already promised their deliveries to electronics manufacturers instead, creating a backlog (for more details see KBC Economic Opinion: Chip shortage is a harbinger of the digital future). The surging prices for container freight shipping, meanwhile, are also to some extent the result of out-of-sync supply and demand dynamics. Chinese exports, which fell earlier in the year compared to other major economies, then also rebounded earlier as demand for medical supplies and consumer electronics rose (Figure B1.1).

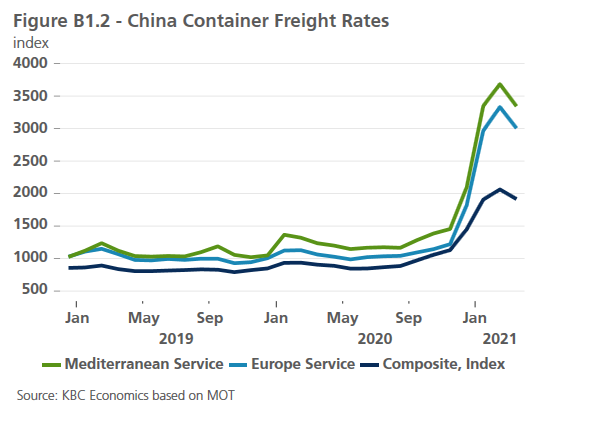
As global trade recovered elsewhere in the second half of 2020, supply shortages of container boxes and container ships became more prevalent, in part due to container ships not being where they needed to be to meet demand as a consequence of the earlier unbalanced trade flows. The result has been skyrocketing shipping costs, particularly between Europe and China (Figure B1.2).
While there are already some repercussions evident from these supply chain disruptions, such as the temporary halting of production at various automotive plants and increasing producer price pressures, the disruptions do not yet pose a threat to the global recovery. Indeed, sustained demand for goods has rather supported the resilience of economies facing renewed pandemic-related restrictions throughout the end of 2020 and beginning of 2021. Furthermore, the gradual reopening of economies this year should help alleviate the shortages and disruptions. Indeed, container shipping rates between China and Europe have already eased somewhat from February to March. On the inflation front, meanwhile, though the increased shipping costs may put some additional temporary pressure on prices (which are already expected to be volatile this year due to the recovery in oil prices), we expect core inflation to remain rather moderate, and still well below the ECB’s target in the euro area. Still, the numerous, recent disruptions to international trade, including the temporary blockage of the Suez Canal for a week at the end of March, are a reminder of the importance of global trade flows for the still fragile economic recovery. The era of the Trump administration’s aggressive approach to trade policy may be over, but challenges to global trade still remain.
Moderate inflation due to economic slack…
Despite the faster that initially anticipated recovery from the Covid-19 pandemic, the inflation rate in the global economy remains well under control (see Box 2). The underlying core inflation rate (excluding the volatile energy and food prices) remains linked to the output gap, a measure of the underutilisation of economic production capacity in economies. As an illustration, total non-farm employment in the US in March 2021 was still about 8.4 million jobs lower than in February 2020. Acknowledging that this output gap is even more difficult to measure precisely in a pandemic than in normal times, most estimates for the output gap in the US and the euro area suggest that the gap between current levels of activity and these economies productive potential is still sizeable. This is likely to keep a lid on underlying inflation, at least in the short term. The latest core inflation figure stood at 1.3% for the US (February) and 1% for the euro area (March). And from an empirical point of view, the Phillips curve remains very flat. That means that, even when unemployment rates fall, upward wage pressure may remain very moderate, thereby limiting the potential scale of inflationary pressures as US and European labour markets gradually return to their pre-pandemic states.
As a result of the ongoing recovery and in particular the unprecedented global policy stimulus provided by fiscal and monetary policy, this output gap is likely to narrow and eventually close, but we expect this to occur gradually and in an orderly fashion, without creating structural runaway inflationary pressure.
… but with high short-term volatility due to energy prices
Despite this moderate and gradual upward trend of underlying inflation, increasing volatility of headline inflation (including energy and food prices) should be expected, especially in the first half of 2021. This increase in inflation is not a surprise. It is largely the result of the oil price recovery in 2021, and the year-on-year comparison to prices one year earlier, implicit in headline inflation measures. From the current level of about 63 USD per barrel Brent oil, we expect the oil price to further rise with a moderate overshooting to a peak of 70 USD per barrel by the third quarter of 2021, and then gradually decline to about 65 USD by the end of 2022. The expected rise in oil prices in 2021 is based on three main assumptions. First, the recovery of oil demand will further gain momentum from the second half of 2021 onwards in line with our base economic scenario. Second, on the supply side the OPEC+ alliance has been quite disciplined in sticking to its agreed supply management – even if moderate increases in oil supply have been announced in the coming months. Third, the role of US shale oil production to fluctuate and keep a lid on oil prices will be more difficult as a result of stricter required capital discipline and new restrictive regulations introduced by the US administration.
The impact of this oil price scenario on the energy component of headline inflation will be very large due to the comparison with some extreme falls in oil prices during the first phase of the pandemic in 2020. It is therefore important to stress that this impact will be mechanical and temporary, as the extreme downside swings of the oil price in 2020 will gradually fade from year-on-year comparisons in energy inflation. When this happens headline inflation and underlying core inflation will converge again, at least in the absence of new sizeable oil price shocks.
Taking together our view on underlying core inflation and energy prices, we expect inflation to be 2.6% in the US and 1.6% in the euro area in 2021. As the one-off base effects of energy prices fade out, inflation will likely fall again to 2.2% in the US and 1.4% in the euro area in 2022.
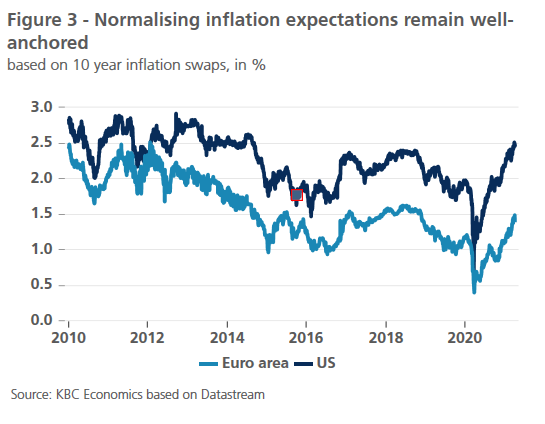
This view of well-anchored and moderate medium-term inflation is also shared by financial markets. Based on the pricing of inflation swaps, market-based inflation expectations have been gradually normalising from their extreme lows at the time of the outburst of the pandemic, and are currently slightly higher again than they were at the beginning of 2020 (See Figure 3). In other words, they remain well-anchored. In the case of the US, they are still very much in line with the Fed’s symmetric inflation target. As for the euro area, the average inflation expectation for the next 10 years remains well below the ECB’s objective of below but close to 2%. This confirms that, at least for the time being, markets do not see any major risk of runaway inflation.
Bond yields edging higher
One of the most notable recent economic developments was a rise in global government bond yields, led by US government bonds. The US 10 year government bond yield rose from 0.93% at the start of this year to above 1.70%, before stabilising currently at about 1.65%. Mainly due to spillover effects, the German 10 year government bond yields also rose, albeit more moderately, from -0.61% at the start of the year to currently about -0.30%. As a resultn the nominal 10 year US-German bond yield spread has increased.
This US-led rise of bond yields coincided both with an improving growth outlook as well with some normalisation of inflation expectations, although the latter are still at very modest levels. On balance, however, the rise of US nominal bond yields also led to a rise of real US yields, suggesting that the growth outlook and factors other than inflation expectations were the main driving factors.
Box 2 - Inflation on the rise
As with economic activity, the pandemic initially put downward pressure on prices. Recently, however, inflation has rebounded. How large and how long-lasting this increase might become has emerged as a key question for economic policymakers and investors.
The higher euro area inflation of late reflects several factors including a dramatic turnaround in oil prices (from below 20 USD per barrel last spring to 60-70 USD of late), indirect tax changes, and, unusually, sharp changes in consumer spending patterns stemming from restrictions that boosted the amount spent on items with relatively fast-rising prices. And now, as immediately after the global financial crisis, supply chain bottlenecks pose further upside risks. These various drivers could push euro area inflation towards and possibly above 2% in coming months. The critical issue is whether these ‘one-off’ influences fade or spark generalised price pressures.
One potential inflation ‘amplifier’ is the ongoing and unprecedented support to economic activity coming from fiscal and monetary policy. Large budget deficits and dramatically increased Central Bank balance sheets carry, at very least, latent upward inflation risks. So too do household savings buffers built up because of restrictions on spending and mobility in the past year.
Set against these forces is a still depressed level of economic activity – with euro area GDP only seen regaining its pre-pandemic footing later next year and unemployment likely to remain elevated notably longer. In addition, structural changes such as increased global capacity and competition, a related decline in companies’ pricing power and marked demographic changes all combined to constrain price growth. As a result, euro area inflation undershot the European Central Bank’s target of below but close to 2% through the past decade.
Beyond a near term ‘flare-up’ in inflation, some more lasting step-up in price pressures could well emerge. Although accommodative policy settings pre-pandemic failed to ignite inflation, the much larger scale and spread of current measures as well as businesses focusing on profit margins rather than growth during the recovery could generate a faster trajectory in consumer prices.
While inflation may move somewhat higher, longstanding structural forces restraining price pressures, coupled with a capacity to move monetary policy to notably less accommodative settings if and when needed, argue against a sustained surge in prices. Such strong countervailing forces make it impossible to be definitive about the inflation outlook, but we think euro area inflation will make uneven progress towards a 2% rate in coming years. That said, a likely bumpy path for inflation could prove challenging for financial markets.
More specifically, uncertainty incorporated in market expectation of the Fed’s future policy may have played a major role, leading financial markets to demand a higher risk premium to hold bonds with a longer maturity. A decomposition, based on a New York Fed staff model, of the US nominal bond yield into the compounded expected future short term rates and a risk premium attached to it, suggests that the rise in the term premium was the main factor behind the US bond yield increase. In other words, although the Fed communicated in its forward guidance that its policy rate will remain unchanged at least until 2024 and this despite of the improved growth outlook, financial markets factor in a changing outlook encompassing potential rate rises as a source of increased risk when pricing bonds. We continue to expect the yield trend to persist in the near term, and expect the US 10 year yield to rise further to about 1.90% at the end of the second quarter.
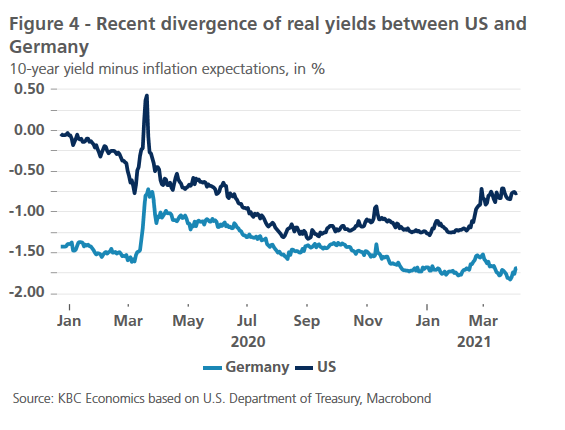
In our assessment, the current USD strength versus the EUR is mainly driven by the recent evolution of the real interest rate differential in favour of the USD (see Figure 4). This differential is both caused by increasing US real rates (dollar strength) and by decreasing German real rates (euro weakness). We expect this to persist in the second and third quarter of 2021. In the subsequent quarters, however, this euro-weakness may reverse.
Renewed attention to risk factors beyond the pandemic
The most important determinant of the macroeconomic scenario remains the pandemic and the necessary health measures to address it. Therefore, the further development of the pandemic remains the primary source of uncertainty. Nevertheless, as the vaccination campaigns steadily progress, it becomes clear that, without new unforeseen shocks, this uncertainty about the pandemic will significantly be reduced from the second half of 2021 onwards. At the point, other risk factors will again come the fore, many of which were always present in the background but faded in importance during the pandemic.
A first risk to the recovery is the further evolution of the trend of deglobalisation, which has already been in place for a number of years. The experience of the pandemic highlighted the fragility of international supply chains. To the extent that this fragility will reinforce the trend of deglobalisation that started well before 2020, it will become a structural factor. Discussions between the US and China about broad trade issues, such as intellectual property rights, are certain to remain on top of the economic agenda. Second, although the EU has made a significant step towards a European level of fiscal policy making, broad and ongoing political support for this approach cannot be taken for granted. The French presidential elections in 2022 and the upcoming decision by the German Constitutional Court regarding the Next Generation EU Recovery Fund will be two of several test cases to assess how broad the societal support for further European economic integration really is. A third risk facing the global economy is the economic stability of many emerging markets in the context of a new cycle of increasing US rates. If country-specific weaknesses are added, new crises with potentially global implications cannot be excluded.
All historical quotes/prices, statistics and charts are up to date, through 6 April 2021, unless otherwise stated. The positions and forecasts provided are those of 6 April 2021.