

Pandemic also ‘infects’ Belgian economic growth rates


The Belgian economy surprised in the fourth quarter of 2020 with growth of +0.2% compared to the previous quarter. Most economists, including us, assumed that qoq GDP growth would have been negative in light of the second wave of the pandemic. The better-than-expected GDP figure provides a large statistical growth overhang at the end of the year. As a result, we have significantly revised upwards our forecast for Belgian annual GDP growth in 2021 from 2.2% to 4.1%. This revision should not be interpreted as a move towards a more optimistic scenario or stronger growth dynamics through 2021. The current pandemic circumstances even have led us to slightly weaken the quarterly GDP growth path in the first half of the year. We continue to see the recovery of the Belgian economy strengthening more substantially only from the third quarter onwards.
Economic growth is usually expressed as the change in gross domestic product (GDP) over a certain period of time. Often this is a year. The annual change in GDP then reflects the increase or decrease compared to the previous year, usually expressed as a percentage. But to measure the real pulse of the economy, a year is a rather long period. To get a quick idea of the fluctuations, we also look at the quarterly changes. Economic growth can accelerate or decelerate throughout the year, or even suddenly change dramatically. This was very clearly the case in 2020 due to the covid-19 pandemic. Sometimes these different views give a blurred picture.
The dark blue line in Figure 1 shows the course of Belgian GDP from 2018 to 2020, expressed as an index, with the value in the fourth quarter of 2018 as 100.1 The graph shows that quarter-on-quarter GDP growth in 2019 accelerated from 0.2% in the first quarter to 0.6% in the fourth quarter. The average quarterly growth rate was 0.4% and in the fourth quarter of 2019 GDP was 1.6% higher than a year earlier. Yet in the tables with annual data, a growth figure of 1.7% appears for the Belgian economy in 2019. That figure refers to the percentage difference between the average level of GDP in 2018 and 2019. In the graph, this is represented by the light blue lines for each year. Thus, the light blue line in 2019 was 1.7% higher than in 2018.
If growth does not fluctuate too much, these different measurements of growth do not deviate too much from each other. Changes in the annual growth rates then provide a reasonably good and, above all, simple picture of economic development. But with large fluctuations in growth from quarter to quarter, the differences can become much greater. That was the case in 2020 due to the pandemic, as shown by the dark blue line in the graph.
A contraction of 3.4% in the first quarter was followed by a further, much sharper fall of 11.8% in the second quarter. This was followed in the third quarter by a strong recovery of 11.6%, after which the economy grew slightly by 0.2% in the fourth quarter. In the end, Belgian GDP at the end of 2020 was 4.8% lower than at the end of 2019 and the average contraction per quarter was 1.2%. But the total damage to the Belgian economy, as represented by the light blue lines, amounted to 6.2% in 2020. That figure appears in the tables as the annual growth rate.
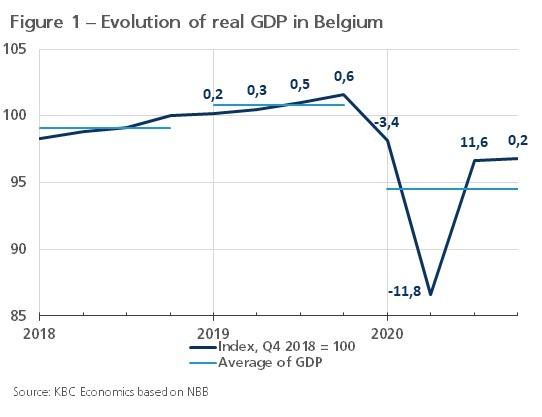
By causing large swings in the economy, the pandemic further ‘infects’ the information value of the usual growth measures. The graph illustrates that the difference between the GDP level in the fourth quarter of 2020 and the average GDP level in 2020 is much larger than in previous years. That difference is called the statistical spillover effect or ‘overhang’. It determines how much growth of the past year is already acquired for the average growth rate of the next year. Indeed, if the dark blue line in the graph maintains the level of the fourth quarter of 2020 in the four quarters of 2021, the light blue line of 2021 will be 2.4% higher than in 2020. Thus, without any quarter-on-quarter economic growth in 2021, annual GDP growth would already be 2.4%.
Of course, the overhang is not typically Belgian. Its extent differs from country to country, depending on the profile of economic fluctuations. Among the main euro area countries for which GDP figures have been published for the fourth quarter of 2020, Belgium, together with Spain and Italy, occupies a middle position between Germany, where the overhang from 2020 to 2021 is ‘only’ 1.5%, and France, with an overhang of 3.6%. The ‘infection’ of the growth figures therefore also clouds the international comparison of growth figures. For the eurozone, the overhang is 2.1%.
Outlook revised on higher overhang
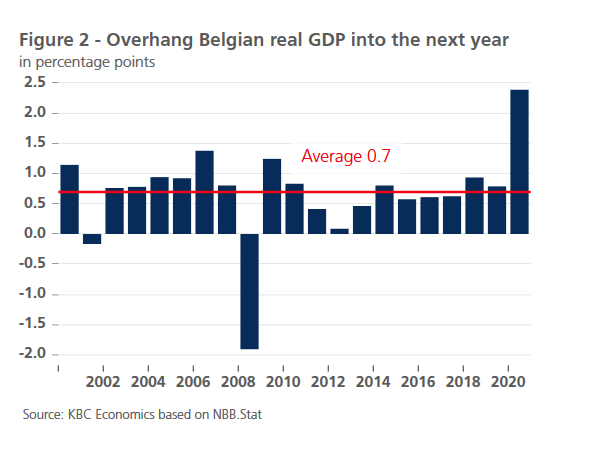
Because of the better-than-expected Q4 GDP figure (+0.2% qoq), the statistical overhang at the end of 2020 (+2.4%) was higher-than-expected as well. The overhang of 2020 into 2021 was by far the highest level seen in the past decades (Figure 2). In normal circumstances, the overhang does not change that much from one year to the next and does not distort the picture painted by the annual growth figures. During the Great Recession that followed the financial crisis, the overhang of 2008 into 2009 was also large, but negative at that time.
The higher-than-expected overhang has huge implications for our outlook for Belgian real GDP growth in 2021. More precisely, it has been revised substantially upwards from 2.2% to 4.1%. This new figure gives the impression of a much stronger recovery than we actually expect. Indeed, more than half of it consists of already acquired overhang. The revision should therefore not be interpreted as a move towards a more optimistic scenario or stronger economic dynamics through 2021. The current pandemic circumstances even led us to slightly soften the quarterly growth path of GDP in the first half of the year. We continue to see the recovery strengthening more substantially only from Q3 onwards.
1 To exclude the influence of price changes, GDP is measured in fixed prices. The influence of seasonal fluctuations and calendar effects is also adjusted in the business cycle analysis.