

The paradox of growth figures


‘You can prove anything with figures’, it is sometimes (but not quite rightly) claimed. Or, worse, ‘Figures cannot lie, but liars can figure!’. And sometimes seemingly very neutral and innocent figures, handled with the best of intentions, misrepresent what is actually going on. That is what is currently happening to KBC Economics (and many other forecasters) with its outlook for economic growth in the euro area.
The just-released June update of the KBC Economic Perspectives raises the euro area's real GDP growth forecast for 2025 from 0.9% (previous forecast) to 1.2% (the new forecast). The growth forecast for 2026 remains unchanged at 0.9%. This makes it seem as if KBC Economics expects a growth slowdown for 2026. However, exactly the opposite is the case. And yet, strange but true, the figures are ‘correct’!
This happens because the figures above are presented according to the most common measure of annual economic growth, which compares the average level of real GDP in one year with the average of the previous year. But there are other ways to report or measure growth even using the same baseline data (the real level of GDP).
In the chart, the dotted blue line shows the quarterly real GDP level in the euro area based on available historical figures from Eurostat (up to and including the first quarter of 2025) and KBC Economics' expectations until the end of 2026. The red lines show the average GDP level in each of the three years shown.
The chart illustrates that the (expected) red line of 2025 will be 1.2% above that of 2024, and that of 2026 is expected to be 0.9% above that of 2025. These are the average annual growth rates of real GDP used in the tables of almost all forecasters of economic growth - including those of KBC Economics.
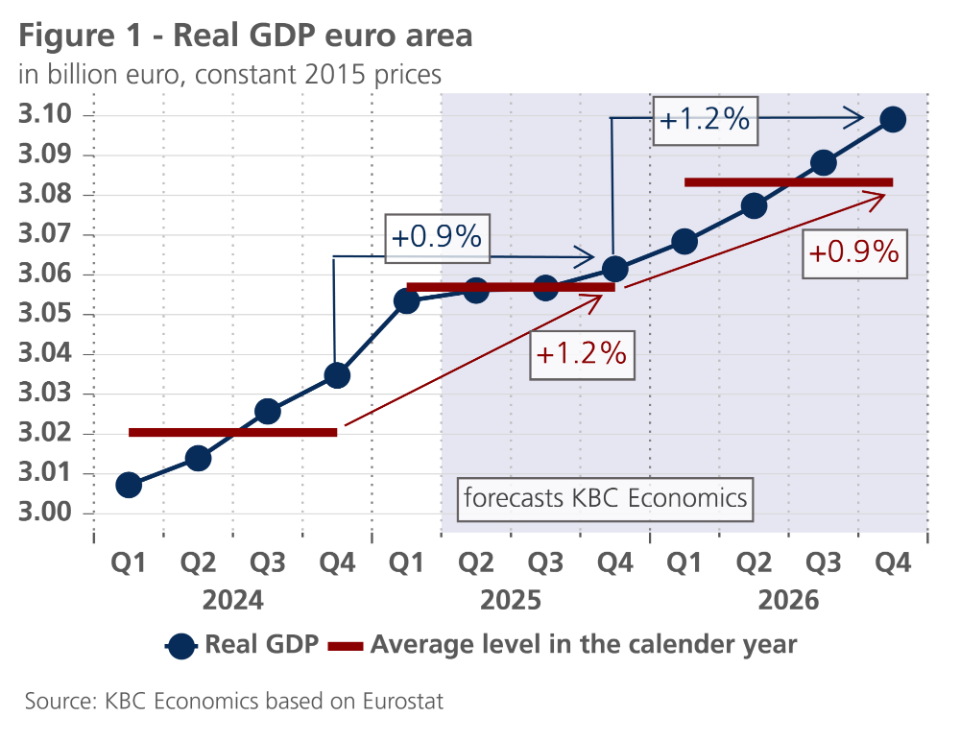
The dotted blue line also shows the level differences by quarter. The comparison of these (the quarter-on-quarter growth rates) in a way gives a better picture of the short-term dynamics in the economy. The chart shows that the level of real GDP in the second and third quarters of 2025 is expected to be barely higher than in the first quarter, and only slightly higher in the fourth quarter. Thus, hardly any growth is expected for the remaining quarters of 2025. However, the fourth quarter of 2025 does see a pick-up in growth, which is expected to gain momentum in 2026.
This expected pick-up in growth is evident if we compare the level of the fourth quarter of 2026 with that of the fourth quarter of 2025: it is 1.2% higher. By contrast, in the fourth quarter of 2025, real GDP is (expected) to be only 0.9% higher than a year earlier. Moreover, two-thirds of that growth was realised in the first quarter of 2025.
Growth dynamics throughout the year are thus better represented by comparing the year-end situation with that of a year earlier. These are the Q4 year-over-year GDP growth figures. This is logical because, as in any accounting of a flow variable (e.g. profit), in national accounts, the counter of GDP is reset to zero at the beginning of each year. Still, the comparison based on annual average levels is more common and the standard used worldwide to express growth projections.
However, this reflects less accurately the pulse of the economy, as it can also be influenced - sometimes strongly - by what happened in the last quarters of the previous year. For instance, the level of average GDP in 2025 is largely due to growth in the third and fourth quarters of 2024. That flatters the 2025 average growth rate. Conversely, weak growth in the third and fourth quarters of 2025 pulls down the 2026 average growth rate.
And so, a paradox emerges: despite the lower average growth rate in 2026, compared to that of 2025, growth in 2026 will be stronger, at least according to current expectations!