
Economic Perspectives November 2022
Read the full publication below or click here to open the PDF.
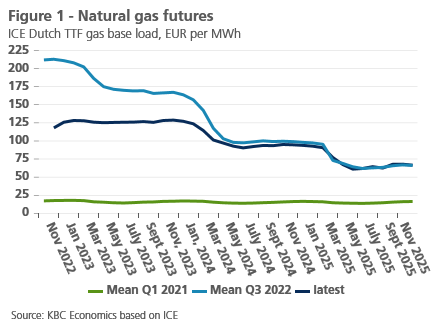
- Driven by soft weather conditions, European gas prices declined for the second month in a row, reaching 123 EUR per MWh at the end of October, down from a peak of 349 EUR per MWh in August. Nonetheless, gas prices are still around ten times higher than before the pandemic (end of 2019). In contrast to gas prices, oil prices increased by 4.8% in October to 93 USD per barrel as OPEC+ cut supply by 2 million barrels per day, taking effect this month.
- High energy prices drove euro area inflation to a record 10.7% year-on-year in October. Energy prices rose by a staggering 41.9% year-on-year, while food, alcohol & tobacco rose by 13.1% year-on-year. Core inflation also continued to accelerate reaching 5% year-on-year, driven mostly by goods inflation. The high inflation figures have prompted us to upgrade our forecast to 8.5% in 2022 and 6.1% in 2023.
- In the US, headline inflation declined to 7.7% in October, down from a peak of 9.1% in June. Core inflation also declined to 6.3%, down from 6.6% last month. A 0.4% month-on-month decline in goods inflation was the prime driver of this deceleration. Service inflation, however, amounted to 0.5% month-on-month driven by continued rent inflation and high wages. The service component will likely continue to put upward pressure on inflation. We hence raised our 2022 US inflation forecast by 0.1 percentage points to 8.1% and significantly upgraded our 2023 forecast from 3.1% to 4%.
- Central banks continue to focus on bringing back inflation to their target levels. The ECB, Fed and BoE all lifted their policy rates by 75 basis points. These central banks also indicated that the tightening cycle is far from over and that further rate hikes in the next policy meetings are to be expected, albeit potentially at smaller increments. We now expect the Fed policy rate to peak at the 5.25% to 5.5% range and the ECB deposit rate to peak at 3.5% in Q2 2023.
- The euro area economy managed to keep its head above water in Q3, as it grew 0.2% quarter-on-quarter, mainly on the back of solid private consumption. The full impact of high gas prices, inflation and monetary policy has yet to be felt, however. Business sentiment indicators have further weakened (in particular in services) and point to a mild recession. We now expect euro area average growth at close to 3.2% in 2022 while slowing to 0.2% in 2023. Despite overall positive yearly average growth, the euro area will not avoid a technical recession going forward.
- The US economy posted a solid 2.6% quarter-on-quarter annualized growth rate in Q3. This was mostly driven by high net exports, while inventories and especially residential investments dragged GDP growth down. Monetary policy will however severely cool the economy and cause a major slowdown in 2023, while also impacting the real estate sector. Though we upgraded our 2022 growth forecast by 0.1 percentage points to 1.8%, we downgraded our 2023 forecast by 0.1 percentage points to 0.5%.
- The Chinese economy rebounded to 3.9% in Q3 year-on-year. The problems in the real estate sector and the government’s zero-covid policy will continue to weigh on future growth. Consumer confidence remains weak while business sentiment indicators are suggesting contractions in both manufacturing and services. Worryingly, the outcome of the party congress risks eroding checks and balances, with an increased risk of future policy mistakes. While we have made a limited upgrade of our 2022 GDP growth forecast to 3.2%, we have downgraded 2023 growth to 4.5%.
Global economy heading to a harsh winter season
Economic growth figures for Q3 in major economies surprised on the upside. In the euro area, the economy grew by 0.2% quarter-on-quarter, skyrocketing gas prices notwithstanding. In the US, a resilient labour market and high net exports led to a 2.6% quarter-on-quarter annualized growth figure. Meanwhile, Chinese growth rebounded and reached 3.9% year-on-year in Q3, up from 0.4% year-on-year in Q2. We do not expect a repeat of these good readings as all three major economies are expected to underperform in the coming quarters. In Europe, high gas prices, along with high inflation and ECB tightening, will cause economic growth to come to a halt in 2023. In the US, a hawkish Fed is fully focused on bringing down inflation, ignoring the likely cost to growth. We expect both economies to enter mild technical recessions in the coming quarters. In China, the zero-covid policy and problems in the real estate sector will keep economic growth below potential. Furthermore, risks to growth are clearly tilted to downside and deep(er) recessions can no longer be excluded.
European gas prices fall in October
Unusually mild weather conditions eased tensions on European gas markets. Still high temperatures reduced the need for gas consumption, while windy and sunny conditions drove up renewable energy production. Combined with a continued seaborne LNG supply, these weather conditions caused gas prices to decline by 37% in October to 123 EUR per MWh, down by 65% from their August peak. Though futures prices show prices are likely to slightly rise as the colder winter months arrive (see figure 1), the rapid increase in European stock levels (94% full at end-October) indicate that the risk of broad-based gas rationing during the 2023Q1 winter months has severely diminished. Nonetheless, despite the recent drop in gas prices, gas prices remain three times higher than a year ago and ten times higher than pre-pandemic levels.
While gas prices declined markedly, brent oil prices increased by 4.8% in October to 93 USD per barrel because of the OPEC+ decision to cut production by 2 million barrels per day. President Biden’s announcement to release another 15 million barrels from the US strategic petroleum reserves put downward pressure on oil prices as did rumors of a possible US-Venezuela deal. A deal on sanctions relief with Venezuela could increase oil supply by 500,000 barrels per day.
Though the high energy prices burden the global economy, they might help speed up the energy transition. As the International Energy Agency (IEA) mentioned in its yearly World Energy Outlook, the oil price increase of 38% observed over the first six months of 2022 has similar effects as a carbon tax price of 70 USD per ton of CO2 on oil use; the natural gas price increase in Europe equals a price of 350 USD per ton CO2. As a result, the IEA now expects natural gas demand to reach a plateau by the end of the decade and oil demand to level off in the mid-2030s. It also expects coal use to fall back already by the middle of this decade. Meanwhile, renewable energy supply is expected to grow by an average 3.8% every year till 2050 (up from 3.5% in last year’s report) in the stated policies scenario. It is now expected to cover 29% of total energy supply by 2050.
Euro area inflation reaches a new high
Euro area inflation rose to 10.7% in October from 9.9% in September. Both the annual increase in energy and food prices, and core inflation continued to rise. If the recent ‘easing’ of gas prices in the futures markets (see above) is maintained, the upward pressure of gas prices on consumer prices will gradually start to ease and even reverse during 2023, presumably only in the final months. The peak of inflation might thus become gradually in reach, but the timing and dynamics of the expected cooling of inflation will also be determined by the further pass-through of the structurally higher energy cost level for companies into sales prices and by the numerous government measures to mitigate and/or spread over time the energy price increase for consumers. We do not expect an unhinged wage-price spiral, although the risk of higher wage growth is very real as employees and unions will want to lock in past inflation in new wage negotiations. Given the higher-than-expected inflation rate in October, we have raised our forecast for the average inflation rate from 8.2% to 8.5% for 2022 and from 5.3% to 6.1% for 2023. The latter figure thus does imply that monthly inflation rates will fall sharply during 2023, mainly due to the extinction of the additional strong inflation impulse from energy prices. However, the uncertainty surrounding the forecasts remains exceptionally high.
US core inflation remains elevated
In the US, headline inflation slowed to 7.7% year-on-year in October, the fourth decline in a row and down from 8.2% last month. Energy price inflation declined to 17.6% year-on-year, down from 19.9% year-on-year last month. Food price inflation also decelerated from 10.8% year-on-year to 10.6% year-on-year as pressure on global food prices is easing.
Core inflation also notably declined to 6.3%, down from 6.6% last month. Goods inflation was the prime driver of this deceleration, with a decline of 0.4% month-on-month. Within goods, used car and truck prices declined for the fourth month in a row, this time by 2.4% month-on-month, a further signal that supply chain constraints are rapidly easing. Moreover, according to the Manheim price index of used vehicles - used car prices dipped again in November.
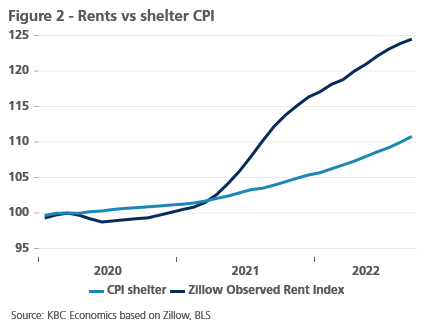
Service inflation, however, was 0.5% month-on-month, down from 0.8% month-on-month last month. A decline in medical care service prices by 0.6 month-on-month drove this decline and is unlikely to be repeated in the coming months. Other components of service inflation continued to increase. Rent prices further accelerated to 0.8% month-on-month, 0.1 percentage points higher than last month. Rent price inflation is likely to remain elevated. It takes about 4 months for market rents to affect the shelter CPI figures. As market rents have far outpaced shelter CPI (see figure 2), there will be still some pressure on CPI figures in the coming months. Other service inflation components were driven up mostly as a result of rising wages. Wages increased by 0.4% m-o-m and 4.7% year-on-year. As there are still almost twice as many job openings as unemployed people, wage pressure is likely to remain elevated in the coming months.
Given the fact that the (lower) October inflation readings matched our expectations and we see continued upward pressure on inflation figures (via higher wages and rents), we raised our 2022 US inflation forecast by 0.1 percentage points to 8.1% and significantly upgraded our 2023 forecast from 3.1% to 4%.
ECB, Fed and BoE all lift their policy rates by 75 basis points
The ECB raised its key policy rates by the expected 75 basis points for a second time straight. The ECB deposit rate now stands at 1.5%. The statement contained some dovish twists compared to the previous ones. It mentioned that further rate hikes are necessary though it left out stating that this will happen over “the next several meetings”. It also added that the Governing Council in the meantime made “substantial progress in withdrawing monetary policy accommodation”. Future policy decisions will be based on the evolving outlook for inflation and the economy. The ECB “has more ground to cover” but president Lagarde refrained from guidance on its size. She simply referred to three key elements the ECB is considering when setting rates: the inflation outlook, what tightening has been delivered already and the time lag of monetary policy. On the reduction of the balance sheet, Lagarde said they deliberately didn’t discuss it. That’s a matter for December, when the ECB will outline the key principles of quantitative tightening.
The days following the dovishly-interpreted 75 basis points rate hike, several ECB governors changed the tone and clarified the stance. Some of them even claimed another such hike in December. The tightening cycle in any case isn’t over yet, with risks that the peak policy rate will be higher than previously assumed and that policy rates will have to stay at this elevated peak level for longer. Our updated peak rate is 3.5%, to be reached by mid next year (see figure 3).
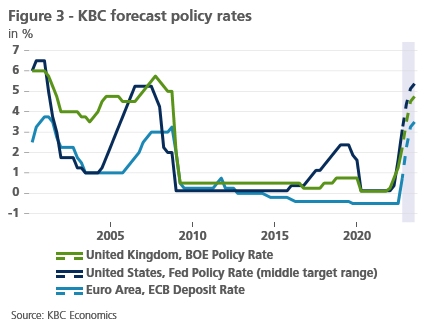
The Fed raised rates by the expected 75 basis points to 3.75-4%. That brings the policy rate further into restrictive territory, meaning that it actively dampens the economy and over time should cool inflation. Further hikes have been announced albeit possibly (and likely) at a slower pace (50 basis points). Fed chair Powell said that incoming data since the last meeting suggests that the terminal rate will be higher than the 4.5-4.75% penciled in in the September dots and that a pause in the hiking cycle is very premature. We now assume the peak in the policy rate range to be well above 5% (5.25-5.5%).
The Bank of England voted in a 7-2 decision to raise rates by 75 basis points to 3%. The two defectors voted either for a 50 basis points or 25 basis points move. The BoE’s new forecasts are not yet calibrated to the formal medium-term fiscal statement (due November 17) but do take into account all government announcements up to and including October 17, amongst others the shortened period of the Energy Price Guarantee (EPG) to six months. In unusually explicit wording, the policy statement says that further increases in Bank Rate may be required for a sustainable return of inflation to target, albeit to a peak lower than priced into financial markets. Governor Bailey repeated that later during the press conference, citing even “current” market pricing of 4.75%.
A surprisingly resilient euro area economy...
In the euro area, the first, preliminary estimate of third-quarter real GDP growth surprised to the upside. Indeed, the expected small contraction did not materialise. On the contrary, modest growth of 0.2% against the previous quarter was recorded. Among the major euro countries, Italy - again surprisingly - recorded the strongest growth (0.5%), while also the German economy performed much better than expected with growth of 0.3%. In France and Spain, growth was at the euro area average. The scarce detailed information available on the composition of growth suggests that in particular domestic consumption continued to carry growth. With a dominant growth contribution from investment, the French economy showed a somewhat different growth profile in that respect. Given the negative growth contribution of net exports in the main countries, exports may have had a much harder time than domestic demand.
The overall picture suggests that skyrocketing energy prices have not yet completely halted the economic recovery from the Covid-19 crisis after all. But compared to the strong growth figures in the first half of the year (0.6% in Q1 and 0.8% in Q2, each against the previous quarter), a sharp slowdown in growth becomes more and more apparent. Sentiment indicators, meanwhile, continue to point to a further deterioration of the growth outlook. Last month, business confidence weakened especially in the services sectors. This suggests that the post-Covid-19 recovery is starting to gasp for breath. However, the slight improvement in confidence recorded in the European Commission’s survey of retailers does not warrant too much pessimism. According to this indicator, confidence has been hovering around its long-term average since the summer months. In other words, there is not exuberant optimism, but neither is there heavy pessimism.
... gasps for breath...
The further development of domestic consumption demand will mainly depend on consumer behaviour. On the one hand, the very timid improvement in consumer confidence in October is not of a nature to expect any substantial growth support from this. Consumer confidence is still at historically and exceptionally low levels. Consumers are clearly shocked by the erosion of their purchasing power as a result of the energy price boom. According to surveys, they will put off major purchases for a while yet. On the other hand, for other spending, the numerous government measures to shore up purchasing power may provide some relief or at least a backstop to the loss of purchasing power. Also, the exceptional savings buffers built up by (a large part of) consumers during the Covid-19 crisis have not yet been used up in most euro area countries.
Whether consumers will effectively want to continue spending will probably depend very much on their (perceived) job security. In that context, it is encouraging that the labour market shows few signs of weakening for the time being. Moreover, especially in industry and construction, employment prospects are holding up relatively well. But they are deteriorating in the service and retail sectors, while, according to consumer confidence surveys, more and more consumers are starting to worry about their employment prospects.
... but is not in free fall
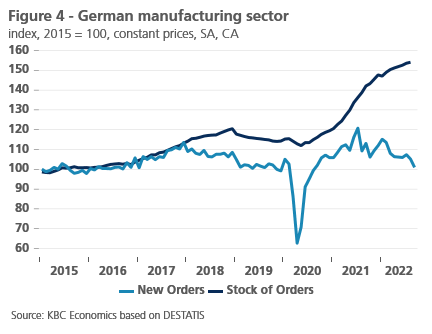
In manufacturing, overall business confidence has weakened further. It points to a possible recession going forward. But it remains striking that future expectations deteriorate much more than the assessment of the current situation. Euro area industrial companies are particularly worried about their competitiveness in both domestic and foreign sales markets. Indeed, the gas price surge and related supply uncertainty are mainly a European (and to some extent Asian) problem, affecting the competitiveness of European industry. Consequently, concerns about new orders are high. In contrast, the assessment of the existing order book deteriorates less, while the estimated guaranteed future production time (covered by the existing order book) is even at a historically high level. This estimate is nicely illustrated by the hard figures on order development in German manufacturing industries. New orders show a downward trend, but the stock of orders in portfolio is at its highest level since 2015 (see figure 4). Bottlenecks in supply chains, which have plagued industrial production in recent years, are likely to play a role in this. They are being resolved, but slowly and gradually. Hence the completion of existing orders will take some time.
Looking ahead, the euro area is therefore characterised by an economy facing very difficult winter months, but not one in free fall, while uncertainty about what comes after the winter remains particularly high. We maintain our scenario of a mild recession during the winter months with slightly negative quarter-on-quarter growth rates for real GDP in the fourth quarter of 2022 (-0.4%) and the first quarter of 2023 (-0.1%), with a difficult, weak recovery thereafter. We left our expectations for expected growth dynamics in the coming quarters unchanged compared to last month. Reflecting stronger-than-expected growth in the third quarter of 2022, the expected average growth rate for real GDP in 2022 and 2023 has been raised by 0.2 percentage points to 3.1% and 0.2% respectively. This outlook remains surrounded by very large downside risks.
Solid Q3 figures in the US
The US economy posted a solid 2.6% quarter-on-quarter annualised growth rate in Q3. This was mostly driven by high net exports (in large part thanks to LNG exports) and consumer spending, which contributed 2.77 percentage points and 0.97 percentage points to growth respectively. Government spending and non-residential investments also positively contributed to growth figures by 0.42pp and 0.49pp respectively. Meanwhile inventories dragged down growth figures by -0.70 percentage points, as companies are shedding their excess inventory. The biggest drag on growth however were residential investments (-1.37 percentage points growth contribution). They declined for the third quarter in a row, as a result of much tighter monetary policy.
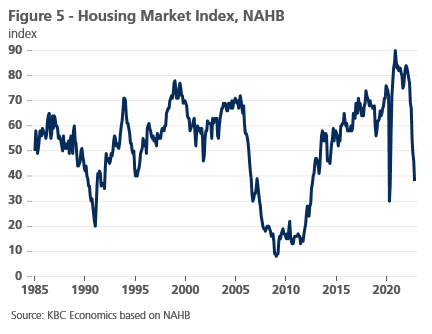
Though Q3 figures came out strong, the picture for the coming quarters is likely to be less rosy as tight monetary policy and a strong US dollar will severely weaken growth. Consumer confidence indicators are fairly weak and point to slower consumer spending in the coming quarters. The Conference Board Consumer Confidence Index dropped 5 points and reached lows not seen since February 2021. The Michigan Consumer Sentiment Indicator rebounded slightly from its record low seen in June. Producer Confidence Indicators all declined in October for both services and manufacturing and hover around 50, meaning close to contractionary territory. Residential investments are likely to continue to negatively contribute to GDP figures in the coming quarters as they are highly sensitive to monetary policy. The National Association of Homebuilders Builders’ sentiment index, a leading indicator of residential investments, has declined for 10 months in a row to 38 and is now at levels not seen since May 2020 (see figure 5). The main positive sign is the labour market which added a solid 261,000 jobs in October, while the unemployment rate increased slightly to 3.7%. Overall, we now expect growth to reach 1.8% in 2022, before monetary policy slows it down to 0.5% in 2023.
Real estate problems and zero-covid policy cast a shadow on the CCP National Congress
The Chinese economy continues to be mired in uncertainty and mounting risks. An unexplained delay in the release of third quarter GDP data, in addition to several other economic indicators, raised concerns over the strength of the recovery in the third quarter. The eventual release of the data shows the economy did indeed rebound, with growth of 3.9% q-o-q (equivalent to 3.9% year-over-year). While the third quarter figure was somewhat stronger than expected, the data does little to allay concerns over the future trajectory of China’s economy.
Problems in the real estate sector and the shadow cast by an unrelenting zero-covid policy are the main short-term factors weighing on growth. As expected, the CCP National Congress in October did not herald any imminent change to this policy despite its fall-out of keeping Chinese GDP well below target (and potential). Rumours that the groundwork is being laid for an eventual easing of the policy remain just rumours for now, but we do expect an eventual easing of the policy in 2023, likely after the winter passes and potentially following the ‘Two Sessions’ political meetings usually held in March.
The outcome of the party congress seems to have raised additional concerns as well, with Xi Jinping not only securing an unprecedented third term as president, but also cementing power via loyalist appointments in key seats within the party and revisions to the constitution. This outcome helps erode remaining checks and balances within the government, potentially raising the risk of future policy mistakes at a time when policy decisions will have a significant impact on China’s medium-term macroeconomic outlook. Furthermore, from a policy perspective, there was a recommitment to the common prosperity agenda that favours redistribution and regulatory crackdowns over headline GDP performance.
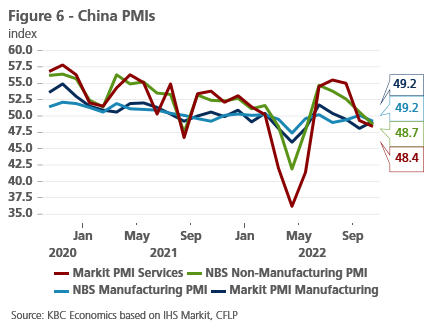
We therefore maintain a conservative outlook on China’s growth performance in the coming quarters despite the slightly better than expected Q3 data. Consumer confidence remains abysmally weak while business sentiment indicators are trending sharply down, with the PMIs suggesting contractions in both manufacturing and services in October (see figure 6). As a result, the acceleration in industrial production (0.84% month-on-month) and retail trade (0.43% month-on-month) in September, while key reasons for the stronger-than-expected Q3 GDP figure, are not yet enough to establish a stronger trend in underlying momentum. While we have modestly upgraded 2022 annual average GDP growth to 3.2%, we have downgraded 2023 average annual growth to 4.5%.
All historical quotes/prices, statistics and charts are up-to-date, through 7 November 2022, unless otherwise stated. Positions and forecasts provided are those of 7 November 2022.