

Economic Perspectives March 2023
Read the full publication below or click here to open the PDF.
- Warm winter weather and elevated gas reserves further drove down European gas prices by 16% in February to 46.4 EUR per MWh. Gas prices are now 63% lower than a year ago but still more than two times higher than pre-pandemic long-term averages. Oil and food prices remained stable in February, while metal prices declined slightly. Meanwhile, the Global Supply Chain Pressure Index dropped from 0.93 to -0.26 last month, an indication that supply chain constraint issues are now mostly behind us.
- In the euro area, inflationary pressures remain elevated. Despite a 5.2 percentage points drop in energy inflation in February, year-on-year headline inflation only edged down by 0.1 percentage points to 8.5%. Core inflation increased by 0.3 percentage points to a record 5.6%, as services inflation accelerated. Because of the higher than expected inflation figure in February, we upgraded our 2023 inflation forecast by 0.3 percentage points to 5.7%. We maintain our 2024 forecast at 3% because we still believe that inflation will cool down.
- In the US, headline inflation increased by 0.4% month-on-month and now stands at 6% year-on-year, 0.4 percentage points lower than last month. Core inflation increased by 0.5% month-on-month, a move largely driven by shelter inflation. Annual core inflation remained at 5.5%. Given the continued persistence of inflation and the worrying signs for the used cars and shelter components, we upgrade our inflation outlook by 0.6 percentage points to 4.4% for 2023 and by 0.2 percentage points to 2.2% for 2024.
- The high inflation prints come at an unfortunate time for central banks. The recent collapse of Silicon Valley Bank and two other smaller US banks have brought financial stability concerns back to the forefront. While we do expect recent events to reduce central bank hawkishness, especially in the US, we also still think central banks will remain committed to bringing inflation back to target and will thus keep rising rates in coming months. We expect the Fed policy rate to peak at 5.125% in Q2 and the ECB’s policy deposit rate to peak at 3.75% in Q3. We expect both central bank will refrain from cutting their policy rates this year.
- Lower gas prices and the rapid Chinese reopening have lifted economic prospects in the euro area. At 6.7%, the unemployment rate remains close to record lows. Sentiment indicators meanwhile improved markedly in January, though they were more mixed in February. Nonetheless, the ECB’s monetary pressure will keep growth below potential. We maintain our growth forecasts of 0.8% and 1.1% in 2023 and 2024 respectively.
- The US economy is weathering the monetary tightening storm well for now. This is especially visible in the labour market, which added another 311k jobs in February. Consumption is also strong, as demonstrated by the 1.1% increase in real consumer spending in January. Further Fed tightening will put pressure on growth in H2 2023 and 2024. We thus upgrade our 2023 growth forecast by 0.2 percentage points to 1.4%, but downgrade our 2024 forecast by 0.3 percentage points to 0.6%.
- In China, the rapid reopening is pushing up growth prospects. Sentiment indicators made a big jump into expansionary territory in January and February, especially in the services sector, and house prices in the primary market are no longer falling. Nonetheless, at the National People’s Congress, a growth target of only 5% was put forward. We are slightly more optimistic and upgrade both our 2023 and 2024 forecasts by 0.2 percentage points to 5.2% and 4.9% respectively.
Bank failures overshadow brighter spots in the economy
The prospects for the global economy are getting somewhat better, despite all the recent gloom in the financial sector in the wake of the Silicon Valley Bank collapse. In Europe, the continued decline in gas prices is bolstering industry and makes consumers more optimistic. The US economy meanwhile continues to defy the gravitational pull of monetary tightening as economic indicators point to continued resilience, especially in the labour market. China’s reopening meanwhile is going better and faster than expected and continues to drive consumer and producer confidence upwards. The reopening is also reducing pressure on global supply chains as Chinese companies are facing fewer Covid-related restrictions and absences.
The improved economic outlook comes with a major caveat, however. Inflation still rears its ugly head and is showing continued broadening and persistence in both the US and the euro area. Though central banks might become more cautious in the wake of recent US banking failures, we expect them to remain committed to bringing down inflation. We therefore expect further rate hikes. This will keep global economic growth below potential in both 2023 and 2024.
Risks to our scenario are tilted to the downside as further financial instability and rising geopolitical tensions could result in lower than expected growth.
Energy prices stabilise
European gas prices dropped by 16% in February to 46.4 EUR per MWh because of soft weather conditions and still high European gas reserves. The latter remain at 61.7%, 20 percentage points higher than usual at this time of year. Though gas prices are still more than two times higher than pre-pandemic averages, they are 63% lower than a year ago and 86% lower than their August peak. Oil prices barely moved in February and remained at 83 USD per barrel, as the market remains well supplied.
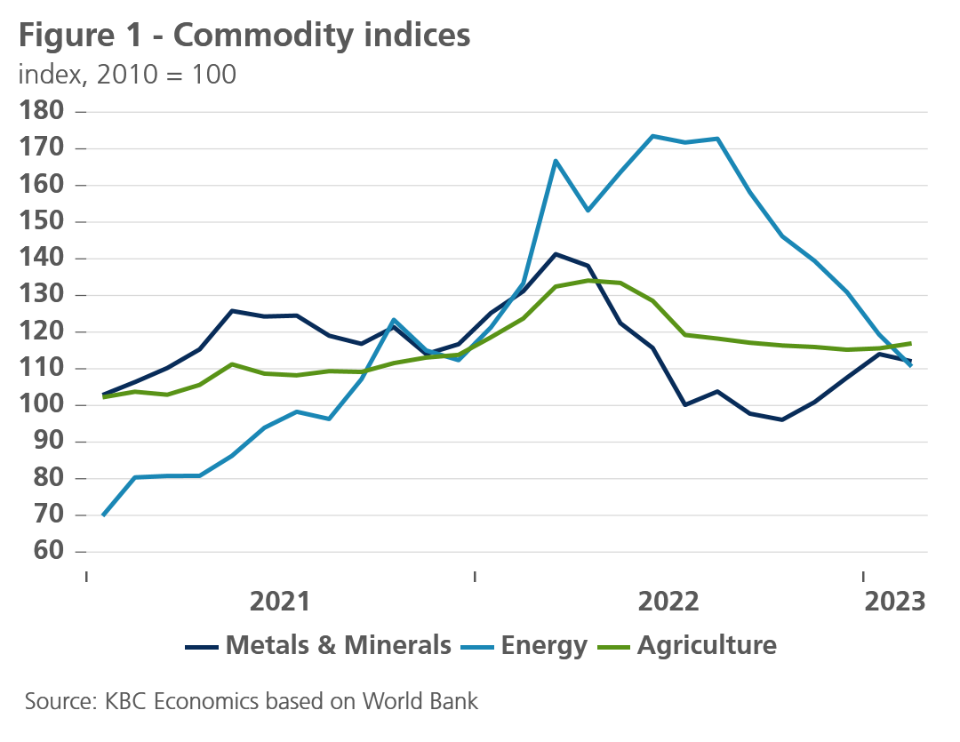
Metal prices corrected somewhat in February, following a rapid rise in the wake of the Chinese reopening. Both copper and iron ore prices declined by 2.3% month-on-month in February. The World Bank’s Metals & Minerals Index dropped to 112, down from 114 last month but still 16 points higher than in October (see figure 1). Global food prices meanwhile remained stable as lower vegetable oils and dairy prices offset the steep rise in sugar prices. Among raw materials, the sharp decline of the lumber price was notable. It declined by 22% last month, due to continued weakness in the global construction sector.
Commodity prices aside, there was also good news on the supply chain front. As the Chinese reopening went more rapidly than expected and supplier delivery times and freight rates declined across the globe, the Global Supply Chain Pressure Index dropped from 0.93 to -0.26 last month and is now 4.57 points lower than its peak in December 2021. The negative reading, the first since 2019, is an indication that supply chain constraints are now lighter than their historical averages.
Euro area inflation remains persistent
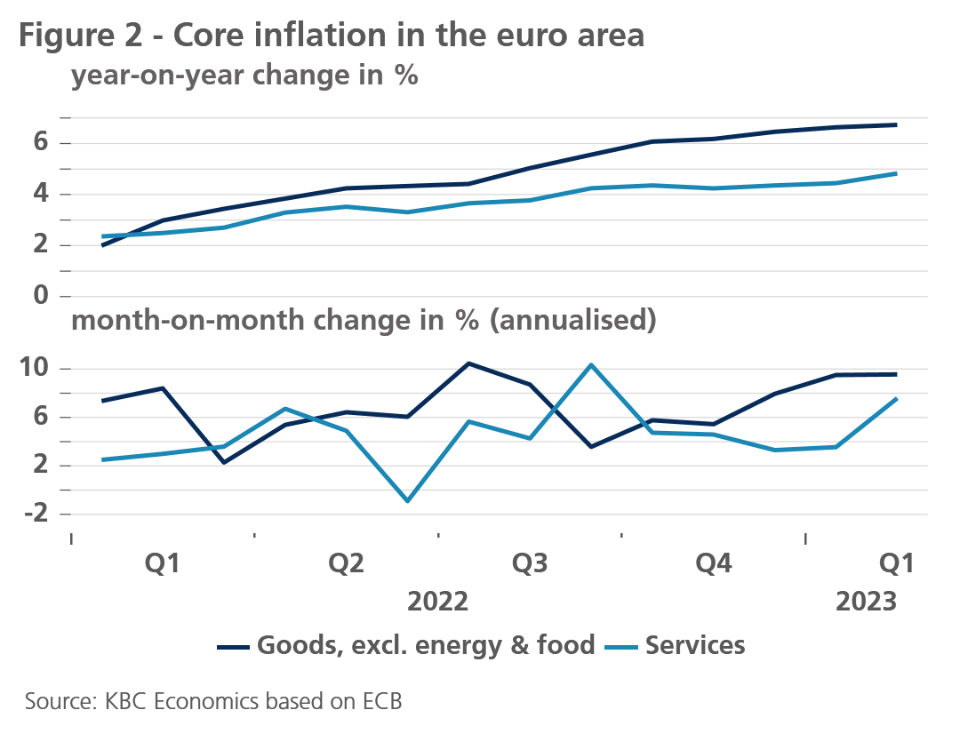
Lower commodity prices and improved supply chains have not eliminated the inflation burden. Recent euro area inflation data continue to point to a persistent problem. The preliminary figure for January was revised upwards from 8.5% to 8.6%, and February’s preliminary estimate still puts inflation at 8.5%. The fall in energy price inflation from 18.9% to 13.7% was almost completely neutralised by the further rise in food price inflation (to 15%) and by the increase in core inflation (from 5.3% to 5.6%). Especially notable was the jump in services inflation from 4.4% to 4.8%. The yearly (6.7%) and month-on-month price increases of non-energy goods are, however, still higher (see figure 2).
Leading indicators, such as import and producer prices or entrepreneurs’ price expectations, suggest some cooling of goods inflation in the future. For expected services inflation, the main focus is on wage growth. This wage growth is accelerating, as shown by the 4.5% annualized increase in wages per hour worked in the fourth quarter of 2022. This is significantly higher than the 2.6% average increase in 2019, the year before the pandemic, but still relatively limited when compared to past inflation figures. Further catching-up is likely, but the all-in-all limited increase in the ECB’s indicator of negotiated wages (to 2.9%), confirms our assessment that such wage increases are likely to be a gradual process and full recovery of lost purchasing power remains unlikely. Moreover, at the euro area level, there are indications that the past inflation surge may have been accompanied by a widening of corporate profit margins. This means that a further increase in labour costs could also be absorbed, at least partly, by a contraction in profit margins. Much will depend on the strength of consumption demand.
All things considered, we raised our forecast for average inflation in 2023 for the euro area from 5.4% to 5.7%, but left it unchanged at 3.0% for 2024. The upward revision for 2023 is only due to higher inflation rates at the start of the year as we have left our expectation of inflation cooling off later in the year unchanged. The first signs of cooling could already be visible this March. One year ago in March, we saw a sharp inflation surge due to the energy price hike. This has now been reversed, which will put downward pressure on the March 2023 headline inflation figure.
US core inflation remains worryingly high
In the US, inflation remains a serious concern. The month-on-month increase in consumer prices was 0.4% in February while core inflation accelerated to 0.5%. Headline inflation decreased by 0.4 percentage points to 6% year-on-year, while core inflation stabilised at 5.5%. Within the group of non-core components, energy inflation declined by 0.6% month-on-month and now stands at 5.2% year-on-year, while food inflation increased to 0.4% month-on-month and 9.5% year-on-year.
The prime driver of core inflation this month was shelter inflation, which increased by 0.8% month-on-month and accelerated to 8.1% year-on-year. Unfortunately, the Zillow Observed Rent Index, a forward-looking indicator of shelter inflation increased by 0.3% in February, following four months of negative month-on-month decreases. Shelter inflation will thus likely remain elevated in the coming months.
A positive element in the February report was the change in services inflation less shelter, which increased by only 0.1% month-on-month as medical care services declined by 0.7% month-on-month. There was also positive news on wage evolutions, a prime driver of service inflation, as average hourly earnings only increased by 0.2% month-on-month. It remains to be seen if these trends will persist in the coming months as labour markets remain tight.
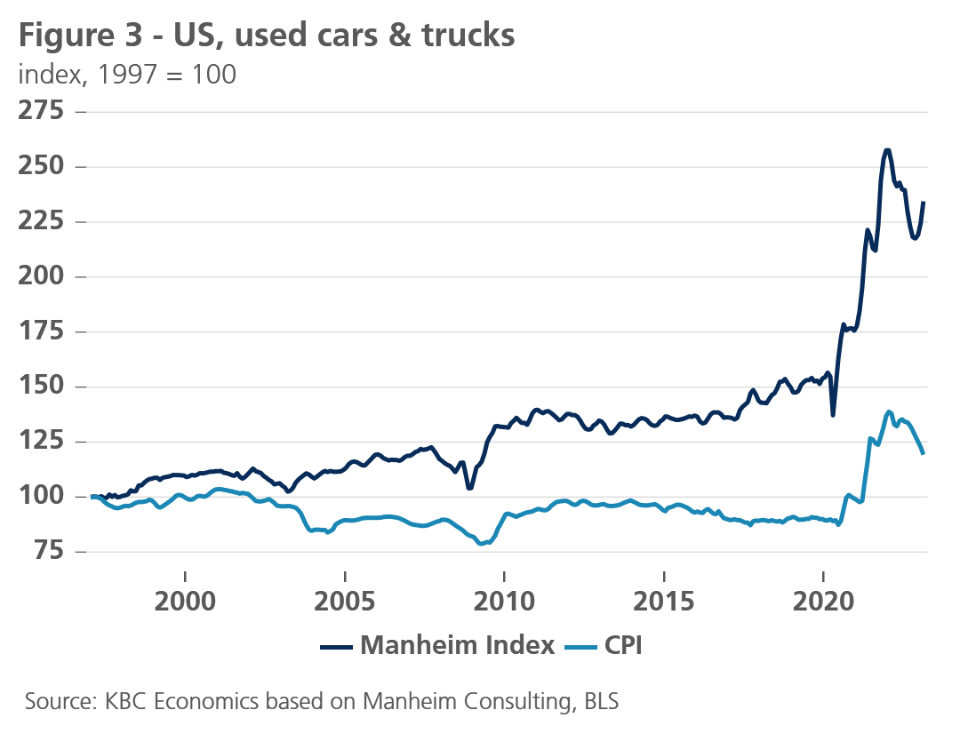
Another positive element was goods inflation, which did not increase this month thanks in large part to a 2.8% decline in used cars and trucks prices. We do expect this component to increase again in the months to come as the more forward-looking Manheim Used Vehicle Index has accelerated rapidly in recent months (see figure 3).
Given the continued high month-on-month increases in core inflation and the worrying forward-looking indicators in shelter and used car components, we upgrade our inflation outlook by 0.6 percentage points to 4.4% for 2023 and by 0.2 percentage points to 2.2% for 2024.
Increased data-dependency and difficult balancing act for central banks
Our financial outlook this month is mainly determined by two consideration. The first consideration is the purely macro-economic context, in particular the sticky underlying inflation. On its own, this calls for further tightening of the monetary policy stance of the Fed and the ECB, both in terms of rate hikes and Quantitative Tightening.
The second consideration is linked to financial stability issues. The unprecedentedly fast increase of interest rates in the past year led to financial tensions, particularly in the less regulated parts of the financial system. This refers not only to non-banks such as pension funds, but also less strictly regulated banks such as Silicon Valley Bank (SVB). These risks had already been flagged in the past. For example, the ECB Financial Stability Review of November 2022 warned that “NBFIs [Non-Bank Financial Institutions] are exposed to a further rise in bond yields and possible forced asset sales amid low liquid asset holdings. In a context of rising bond yields, NBFIs’ duration risk remains elevated, exposing the sector to further bond portfolio revaluation losses.” A similar liquidity problem arose in late September 2022 in the UK, when inadequate Asset Liability Management (ALM) of pension funds nearly led to their collapse when bond yields abruptly and strongly rose. This crisis was only brought under control when the Bank of England temporarily stepped in as a buyer of first resort of UK government bonds.
The financial stability problems that occurred last week were not only caused by inadequate asset-liability management by the firms involved, but also by the insufficient access to an effective ‘lender of last resort’ backstop facility to stop bank runs. As a result, when problems arose during the run on the bank’s deposits, ‘hold-to-maturity’ bond portfolios needed to be sold (and latent losses realised), instead of being used as collateral for liquidity provision by the central bank.
To allow financial institutions to raise liquidity at less punitive terms than through fire sales in financial markets, the Fed created the new Bank Term Funding Program (BTFP) facility on Sunday. In particular, the fact that collateral bonds will be accepted at par value (and not mark-to-market) is an important stabilising element, as this provides an effective liquidity instrument and helps avoid contagion and other potential bank-runs. In addition, the US Federal Deposit Insurance Corporation (FDIC) has extended the scope of deposits covered.
All in all, it still remains to be seen whether the bankruptcy of these specific US banks will turn into a systemic risk despite the intervention of the US authorities, and, if so, to what extent there will be contagion to the rest of the world. Since the problems appear to be concentrated in the less strictly regulated and supervised segment of the US banking sector, systemic contagion to the European financial system is less likely, given the stricter supervisory environment and strong capitalisation of European banks. Nevertheless, at least a temporary spill-over of fear to global banking sector assets occurred in the first days following the SVB-collapse.
Two tentative conclusions can be drawn at this moment. First, last week’s financial accidents are considered a game changer by financial markets. Even if the current risk of systemic contagion does not materialise in the end, it has become clear that the unprecedented monetary policy tightening cycle and liquidity draining will not necessarily run smoothly. It will continue to pose risks globally, and central banks inevitably will take this into account when deciding on their policy path going forward. For reference, the only experience with QT in the US ended abruptly in 2019 because of liquidity issues affecting the smooth functioning of US financial markets.
The second tentative conclusion is that the latest available inflation data (for February) show that underlying core inflation remains stubbornly high in the US, and is even further increasing in the euro area. Falling headline inflation is essentially ‘just’ a reflection of easing energy prices. Therefore, the need for both the Fed and the ECB to continue their tightening cycle in order to get overall inflation back to their inflation target of 2% in a timely manner, remains as pressing as ever. The crucial question is to what extent central banks (and supervisory authorities) have sufficiently independent tools to deal with financial stability risk and the excessively high inflation at the same time, without the pursuit of one policy objective compromising the other. While this may be achievable in theory, there will be a trade-off in practice with monetary policy tightening being more ‘data dependent’ (including financial stability data), than would otherwise have been the case. If this trade-off goes too far, this could potentially create the risk of ‘financial dominance’ on monetary policy.
Based on these tentative conclusion, we continue to expect the Fed to hike its policy on its March meeting by 25 basis points, followed by one more final rate hike by 25 basis points in May, bringing the cycle peak policy rate to 5.125%. This is 25 basis points lower than we expected last month. We expect the ongoing pace of Fed Quantitative Tightening (95 bn USD per month) to remain in place for the time being. In line with its unambiguous forward guidance, the ECB raised its deposit rate by 50 basis points to 3%. Three more rate hikes of 25 basis points are expected thereafter, bringing the cycle peak rate to 3.75% in July. This is higher than we expected last month, but slightly lower than we would have pencilled in case the recent financial turmoil had not occured.
Consistent with the lower Fed cycle peak rate, US 10 year bond yields are likely to also peak at a lower than previously expected level of 4.10% in Q2. Since on balance, we upgraded our outlook for the ECB cycle peak rate, German 10 year government bond yields are expected to peak in Q3 at a slightly upwardly revised yield of 3.2%. Both US and German yield curve will remain strongly inverted throughout 2023, reflecting the expectation of first rate cuts by the Fed and the ECB from mid-2024 on.
Consumption cripples euro area growth
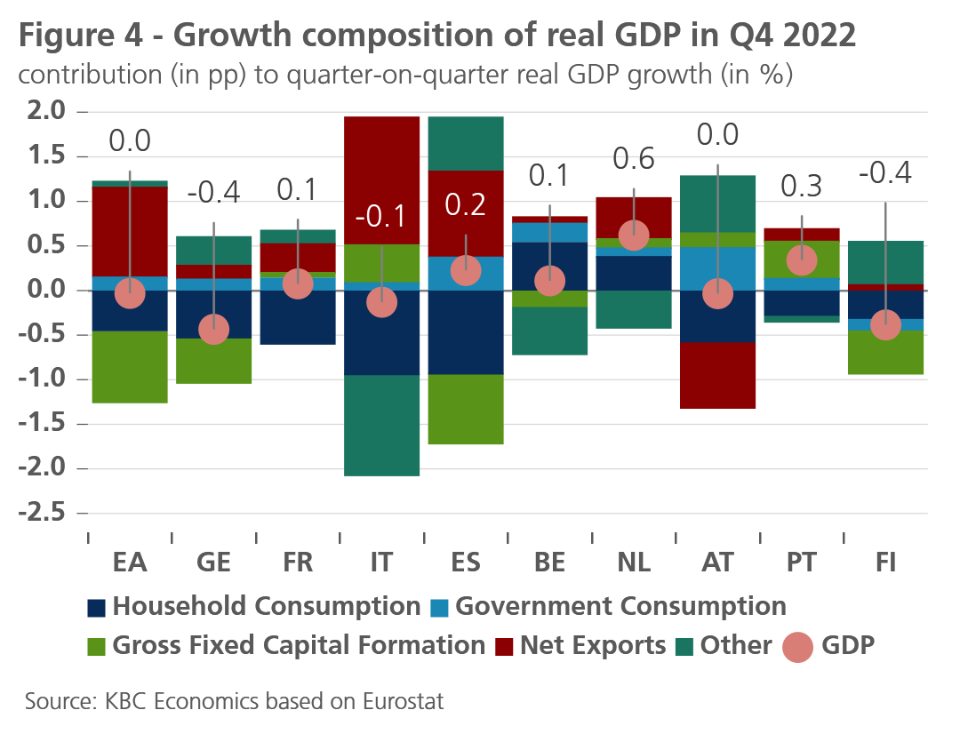
In the latest revision of real GDP for the euro area, fourth-quarter 2022 growth (versus the third quarter) was revised downwards from 0.1% to 0.0% (and slightly upward for the third quarter). In particular, the German economic performance was somewhat weaker in the final months of 2022 than previous estimates indicated. It contracted by 0.4% instead of the previously projected contraction of 0.2%. The figures on spending components show that private consumption fell in almost all euro area countries in the fourth quarter, with the Netherlands - where the economy recorded a particularly strong growth performance in the fourth quarter (0.6%) - and Belgium as notable exceptions (see figure 4). In Germany and Spain, among others, investment also made a negative growth contribution. Both business equipment investment and residential construction were responsible for this. In most other large(r) euro area countries, investment made a - albeit sometimes modest - positive growth contribution. The growth contribution of government consumption and net exports was positive almost everywhere.
Despite the stagnation in real GDP, both the number of people employed (+0.3%) and the number of hours worked (+0.4%) still increased slightly compared to the previous quarter. As a result, labour productivity declined. The data suggest that employers generally remain reluctant to lay off workers when activity weakens, preferring instead to finance the drop in productivity using their financial buffers. This is not surprising given the current labour scarcity. The euro area unemployment rate stood at 6.7% in January 2023, 0.2 percentage points lower than a year earlier and barely higher than the historical low of 6.6% recorded in October 2022.
Only a limited number of hard indicators on economic activity in the first quarter of 2023 are currently available. Confidence indicators in February showed a further recovery among consumers. Among entrepreneurs, depending on the sector or country, we saw a mix of (very) slight improvements and (very) slight deteriorations. This is in line with our scenario of very moderate growth with most countries escaping a recession in 2023. This will be supported by the fall in European natural gas prices, which has continued in recent weeks, along with falling inflation, the resilient labour market, government support measures and the improved international environment. The impact of tighter monetary policy on economic activity remains a downside risk. In our baseline scenario, we assume that higher interest rates will keep economic growth very low in the second half of the year, but we do not see them triggering a recession. We kept our euro area real GDP growth forecast unchanged at 0.8% for 2023 and 1.1% for 2024.
The American economic engine keeps running
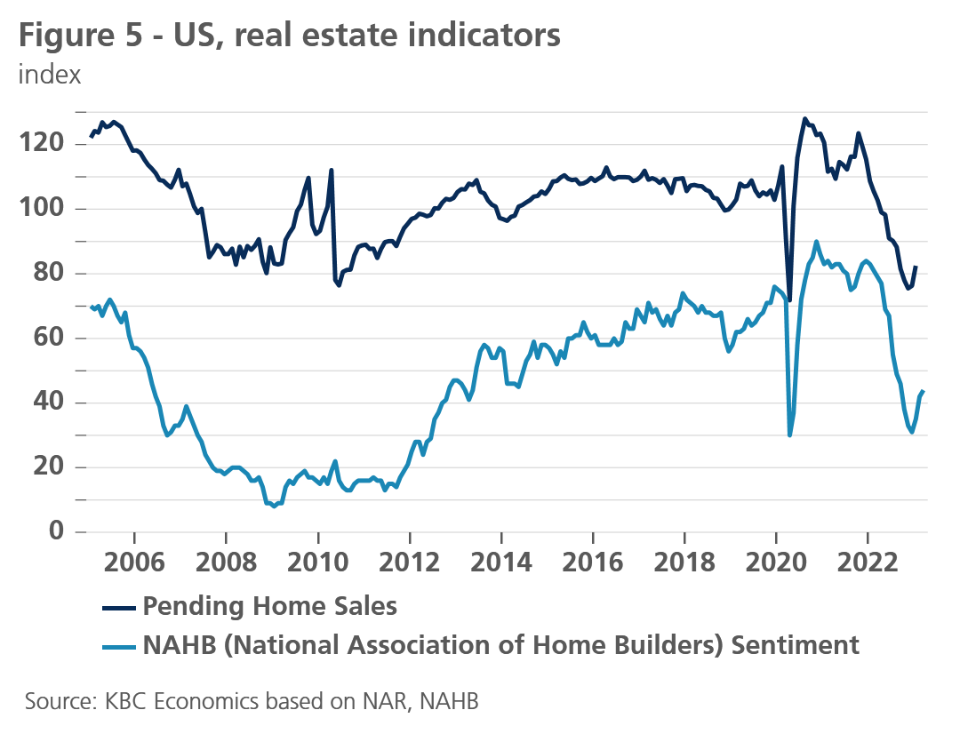
In the US, the economy is so far weathering the pressure from monetary tightening. This is especially visible in the labour market. Total nonfarm payrolls increased by a remarkable 311k jobs in February. The participation rate increased by 0.1 percentage points to 62.5%, while unemployment increased 0.2 percentage points to 3.6%. Consumer spending meanwhile accelerated markedly in January, rising 1.1% in real terms as did manufacturing output, which increased by 1% last month. Even the housing indicators have improved lately as pending home sales increased by 8.1% in January. They are still 24% lower than a year ago however. Housebuilder surveys also firmed recently (see figure 5). Taking into account our GDP growth nowcast for 2023Q1 (supported by strong exports) and given overall resilience in the economy, we upgrade our quarter-on-quarter annualized figures from 1.2% to 2% for Q1 and from 0.4% to 0.8% for Q2.
Further monetary policy tightening by the Fed, along with tighter lending standards in the wake of recent bank failures, will hit the economy eventually, as monetary policy typically takes 12 to 24 months to fully filter through to the economy.
We upgrade our 2023 growth forecast by 0.2 percentage points to 1.4%, but materially downgrade our 2024 forecast by 0.3 percentage points to 0.6%. This means that growth will stay below potential both in 2023 and 2024. As a result, we also expect a visible increase of the unemployment rate, which should gradually move up from the January lows to more than 5% by the end of 2024.
NPC shake-up in China
All eyes in China and abroad were on the annual National People’s Congress (NPC) meeting in the first weeks of March. In theory, the NPC is China’s most powerful state body under the Chinese constitution, but in practice the ruling Communist Party wields more power. This is why the NPC is widely dubbed the rubber-stamp parliament, as many major decisions and appointments are made by the Chinese Communist Party long before the NPC. Still, the NPC is closely followed because it sets the economic and political tone for the rest of the year.
During the first day of the meeting, the real annual GDP growth target for 2023 was announced to be ‘around 5%’. The target was at the lower bound of market expectations and is widely deemed easy to reach and even to surpass given the low 2022 comparison point. The fact that growth (3.0% year-on-year) underwhelmed last year compared to the target (5.5% year-on-year) is likely an important motivation for the conservative 2023 growth goal.
Another important outcome of the NPC meeting has been the appointment of Xi Jinping loyalists to important government positions, including the vice-president and the top economic advisor. The switch from more technocratic profiles to career politicians increases the risk that short-term gains could be put before longer term goals. This could potentially hamper much-needed reform efforts, including in the highly leveraged and indebted real estate sector.
Also approved at the NPC is an overhaul of the financial system and the science and tech sector. In the financial sector, a new party-led regulatory commission will be created out of the current banking and insurance watchdog to oversee all financial activities in sectors other than the securities industry. Hopes are that the new overarching body will help reduce the risk of systemic crises in the financial system. In the tech and science sector, the approved reorganisation is mainly focussed on increasing the self-reliance and security of China. This move was largely motivated by political tensions with the US, which have resulted in curbs on the sale of high-end chips and related machinery by Western companies to China.
Post-Covid recovery is gaining steam
We currently have an annual real GDP growth figure of 5.2% pencilled in for 2023, up from the 5.0% of last month. The upward revision is based on strong PMI indicators in February, and the rebound in consumer confidence as well as some hesitant green shoots of a price and sales recovery in the housing market. We remain cautious, however, as external headwinds counterbalance internal strength and structural issues continue to haunt the Chinese economy.
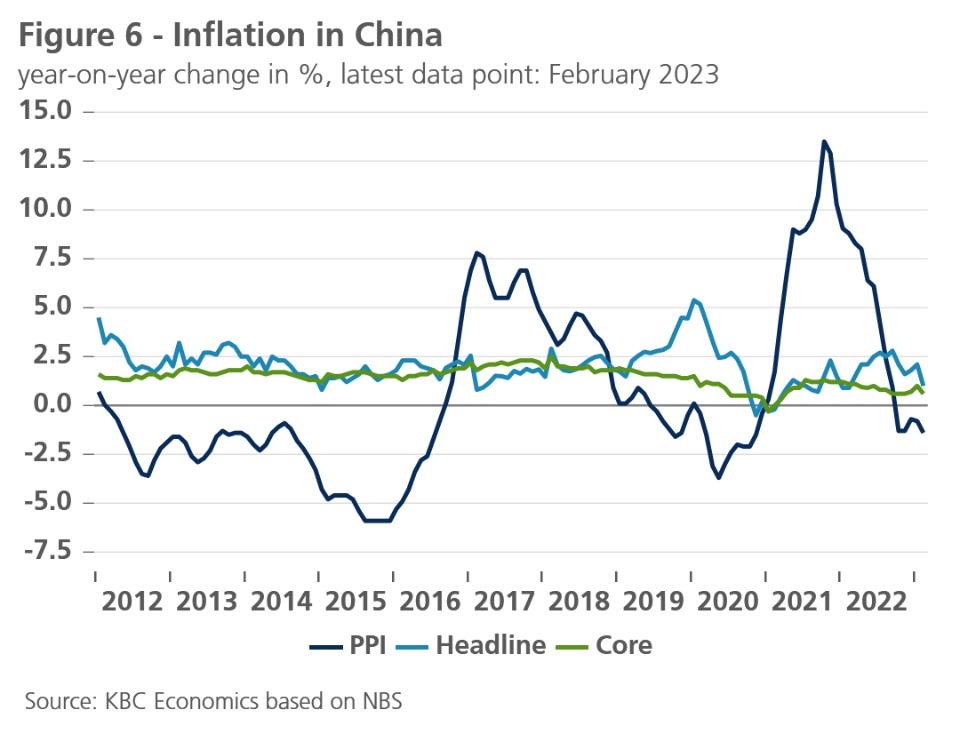
The inflation figures in China remain well-behaved, especially when compared to inflation dynamics in advanced economies. The February 2023 headline inflation figure came in at 1% year-on-year, a significant drop compared to the 2.1% in January (see figure 6). Both the timing of the Chinese New Year and the weakening of food prices played an important role in the decline but there were also still signs of demand weakness. Going forward, we expect price pressures to strengthen again as the recovery gains speed, but increases in inflation will overall remain modest, leading to a yearly average inflation figure of 2.2% for 2023.
The increased geopolitical tensions between the US and China are an important risk factor going forward. There has been a rise in the use of confrontational language from both sides of late, including an explicit mentioning by President Xi that the US is the leading force in Western efforts to implement containment, encirclement and suppression against China. A further escalation of tensions could lead to more sanctions and countersanctions being implemented, which would dampen growth prospects.
All historical quotes/prices, statistics and charts are up-to-date, up to 13 March 2023, unless otherwise stated. Positions and forecasts provided are those of 13 March 2023.