

Economic Perspectives June 2025
Read the full publication below or click here to open the PDF.
- The United States’ erratic trade policy continues to be a major source of global uncertainty. Last month, Trump threatened to impose a 50% tariff on the EU, a threat he paused until 9 July. Trump’s “Liberation Day” reciprocal tariffs are also set to take effect again on that day, though negotiations are likely to push the eventual tariffs lower. We maintain our working assumption of, eventually, a 30% effective tariff on Chinese imports, a 25% effective tariff on imports from other Asian nations, a 15% effective tariff on EU imports and a 10% effective tariff on imports from other countries.
- Both oil prices and natural gas prices rose more than 5% on 13 June as Israel and, later, the US launched strikes on Iran. Iran produces approximately 4.5% of global oil supplies and 6.5% of global gas supplies. Furthermore, markets fear(ed) a widening of the conflict in the Middle East and a closure of the Strait of Hormuz in particular. 30% of the world’s seaborne crude and 20% of liquid natural gas travel through this Strait. That said, in view of the 24 June ceasefire agreement, a closure of this strait remains a tail risk.
- Euro area inflation continues to soften. Headline inflation dropped below target from 2.2% to 1.9% in May, while core inflation dropped from 2.7% to 2.3%. The decline was caused by a large drop in services inflation (partially due to a seasonal effect). Core goods and energy inflation remained unchanged, while food inflation increased. Given higher energy prices, we slightly upgrade our 2025 inflation forecast from 2.1% to 2.2%, while downgrading it from 1.9% to 1.8% for 2026.
- Notwithstanding increased tariffs, US inflationary pressures remained mild in May. Both headline and core inflation increased by only 0.1% month-on-month, bringing them on an annual basis to 2.4% and 2.8% respectively. Energy prices declined, while shelter and services inflation softened. Notably, goods prices were unchanged, suggesting slower-than-expected passthrough of tariffs to consumer prices. We thus downgrade both our 2025 and 2026 inflation forecasts by 0.1 percentage points to 2.9% and 2.7% respectively.
- Despite a big upward revision to euro area Q1 GDP, the underlying growth dynamics remain sluggish. Business sentiment indicators remain weak, as the rebound in manufacturing sentiment is compensated by a decline in services sentiment. Consumer confidence is gradually recovering but is still at a low level. European labour markets remain tight as unemployment rates stand at historical lows and employment continues to increase. Given the upward revision of the Q1 growth figures, we upgrade our 2025 forecast from 0.9% to 1.2% while maintaining our 0.9% 2026 forecast. These annual average growth rates are consistent with a gradual but delayed recovery of the European economy.
- US GDP is set for a rebound in Q2. That said, the underlying dynamics raise concerns. Though consumer confidence rebounded, retail sales declined in May. The housing market also feels the pressure of maintained elevated interest rates. The labour market remains resilient but is showing signs of gradual easing. Given the improved outlook for Q2 GDP growth, we upgrade our forecasts from 1.1% to 1.6% for 2025 and from 1.2% to 1.4% for 2026.
- The ECB and the Fed monetary policy decisions diverged again in June. The Fed remains in wait-and-see mode, given the uncertain impact of tariffs on inflation. We expect the Fed funds rate to remain restrictive this year and now expect only two rate cuts this year, in line with the Fed dot plot. In contrast, the ECB cut its policy rates again in June, though President Lagarde indicated the rate cutting cycle might be nearing its end. We maintain our scenario of one more rate cut this year, bringing the bottom of this cycle at 1.75%.
- The Chinese economy has weathered initial disruptions from the US trade war better than originally expected, and the May and June agreements on a trade framework between the two countries provides some relief from increasingly antagonistic trade barriers. Uncertainty remains, however, and many weaknesses are still evident in the domestic economy. As such, we only marginally upgrade our real GDP forecast from 4.2% to 4.5% in 2025 and from 4.1% to 4.2% in 2026.
US trade policy uncertainty keeps the global economy in limbo. At the end of May, Donald Trump threatened to impose a 50% tariff on EU imports from 1 June onwards. Following a call with Ursula von der Leyen, he delayed the imposition of the 50% tariff till 9 July. The reciprocal tariffs for other countries (as announced on “Liberation Day”) are also set be imposed on that day. However, as negotiations between the US and other trading partners are ongoing, the eventual effective tariffs are likely to be lower. We currently maintain our working assumption of a 30% effective tariff on Chinese imports, a 25% effective tariff on imports from other Asian nations, a 15% effective tariff on EU imports and a 10% effective tariff on imports from other countries.
Though the tariff policies will almost certainly hurt growth, their impact will likely be somewhat milder than initially anticipated. We hence revised the growth outlooks for all three major economic blocs upwards. In the US, this better growth outlook is caused by a big upgrade of our Q2 outlook, driven by stronger exports and consumption, and the prospect of lower reciprocal tariffs. In the euro area, a big Q1 revision lifted our growth outlook in 2025. Finally, in China, exports are withstanding the tariff pressure (possibly due to trade diversion), while retail trade and industrial production surprised to the upside.
With regards to inflation, the Iran war and the related risk of higher energy prices puts upward pressures on headline inflation. That said, the underlying inflation dynamics remain relatively mild in all three economic blocs for now. In the US, core goods prices didn’t increase in May, despite a big hike in effective tariffs. This suggests the passthrough of tariffs will take longer to materialise. In the euro area, services inflation dropped notably in May and the wage dynamics remain favourable. In China, headline inflation remains negative while producer prices continue to decline.
Iran conflict drove up energy prices
Oil prices jumped by 5.8% on 13 June to 74 USD per barrel, as Israel launched six waves of air strikes on Iran, aiming at military and nuclear sites. Iran retaliated with ballistic missiles and drone strikes, though many were intercepted by Israel’s Iron Dome. Following a week of escalations, on 22 June, the US got involved by bombing nuclear sites in Iran. The initial retaliatory response by Iran was relatively contained lifting some of the pressure on energy markets. Following this contained response, Israel and Iran agreed to a ceasefire. That said, the ceasefire is fragile, and tensions could rapidly escalate again.
Though so far there was no major loss of oil supply, Israeli strikes could increasingly aim at Iranian oil infrastructure if the conflict intensifies again. Iran produces 3.2 million barrels of crude oil per day (see figure 1) and exports 1.8 million barrels per day. A partial loss of this production capacity would obviously be problematic for oil markets. However, as OPEC+ is ramping up supply rapidly and global oil demand is weakening, oil markets should be able to absorb such a shock.
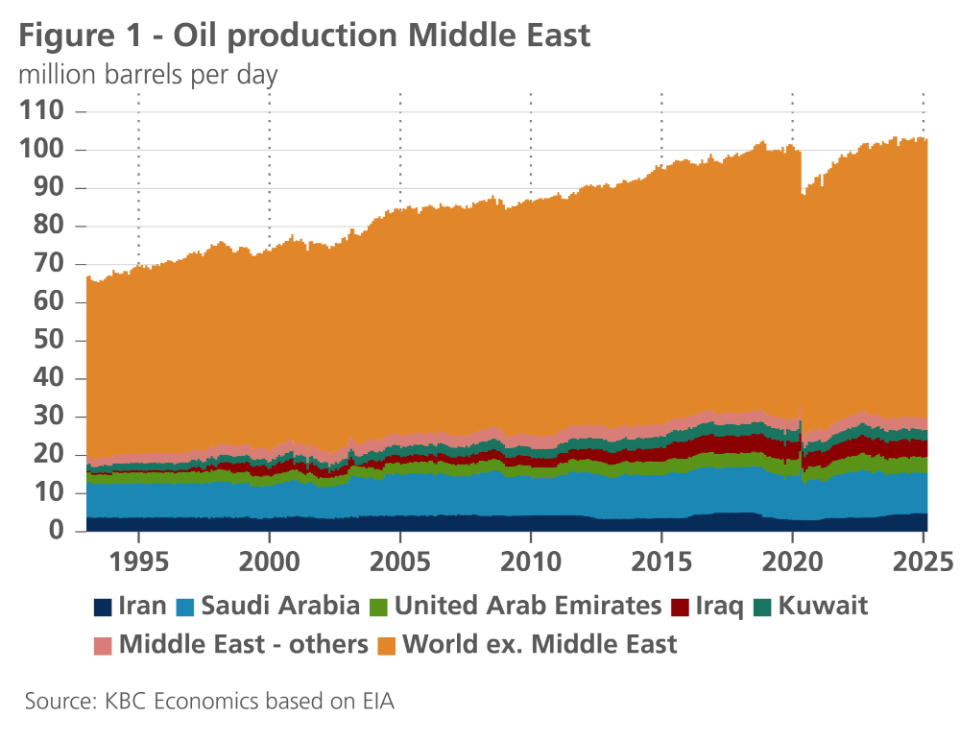
In a worse case, the conflict could also spread to the rest of Middle East, however. Markets are particularly worried that Iran could block the Strait of Hormuz. About 21 million barrels of oil (close to 20% of global consumption) are shipped through this passage every day. A blockade would thus significantly reduce global oil supply. That said, this remains a tail risk as Iran is dependent on trade from the Strait of Hormuz. Furthermore, a blockade would isolate it diplomatically and would entice both America and China to send their navies to unblock the passage.
In line with oil prices, European natural gas prices increased by 5% to 37.7 EUR per MWh on 13 June. Iran produces 275 billion cubic meters of gas per year (6.5% of global output), while Israel produces 21 billion cubic meters of gas per year. Iran’s South Pars gas field, which contains almost 20% of the world’s known gas reserves was hit and had to partially stop production. Furthermore, gas markets are also dependent on free shipping passage through the strait of Hormuz as 20% of the world’s liquid natural gas travels through it.
Eurozone inflation (temporarily?) below 2%
Euro area inflation fell to 1.9% in May. Excluding the one-off (caused by energy price-related base effects) dip of 1.7% in September 2024, it thus fell below the ECB's 2% target for the first time since June 2021. More importantly, the cooling of core inflation continues. After rebounding from 2.4% in March to 2.7% in April, core inflation fell to 2.3% in May. Food price inflation picked up further to 3.2% (from 3.0% in April and 2.3% in early 2025), while energy price inflation stabilised at -3.6%.
The decline in core inflation is entirely caused by calendar effects in services inflation. The late timing of Easter in 2025 meant that the price increases associated with the Easter holidays for package holidays, among others, occurred in April this year instead of March. That then caused a boost in services inflation from 3.5% in March to 4.0% in April. This April rebound was reversed in May. Services inflation fell to 3.2%, its lowest level since March 2022. Meanwhile, the price growth rate of non-energy goods remained at 0.6% for the fourth consecutive month.
The new decline in core inflation is in line with our scenario of a gradual cooling of underlying inflationary pressures. This is caused by the fading out of wage adjustments to the inflation upsurge in 2021-2022 due to the energy crisis following Russia's invasion of Ukraine. The sharp rise in unit labour costs that followed is now gradually wearing off, not only due to the moderation of nominal wage increases, but also due to the firming of productivity growth (see figure 2). Meanwhile, the recent strong appreciation of the euro is slightly reducing imported inflation.
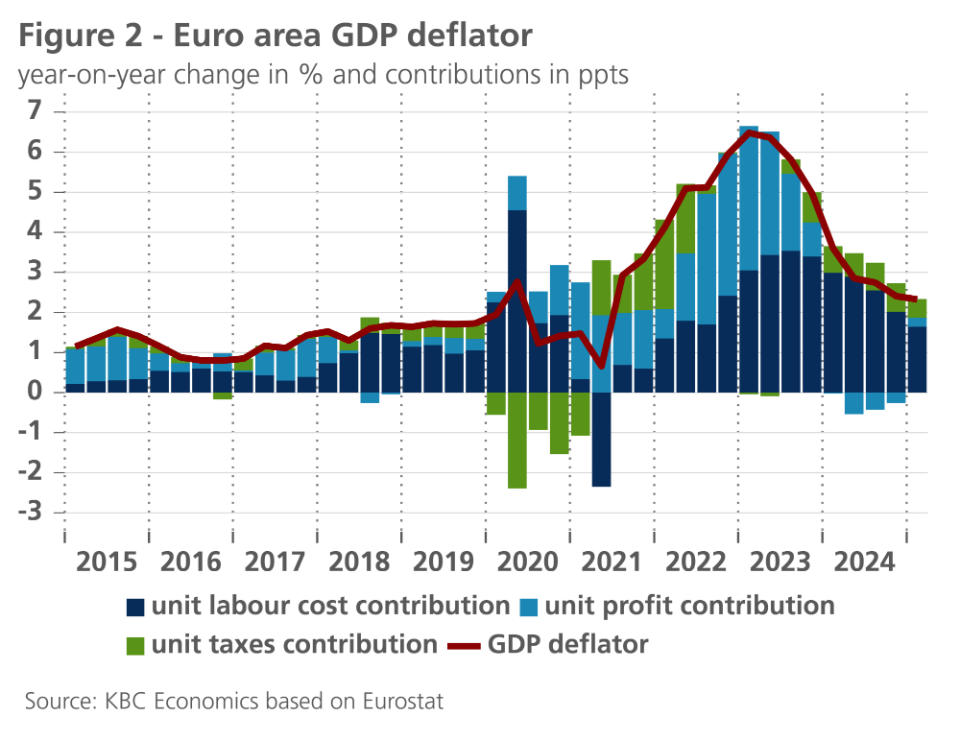
From current levels, the disinflationary impulses of core inflation will begin to weaken. Admittedly, wage indicators still suggest a cooling in the nominal wage growth rate and productivity gains will likely increase. But presumably, profit margins will recover somewhat - something that was already visible in the first quarter of 2025 (see figure 2). We expect core inflation to stabilise near 2%, although it may take a few more months to reach that level altogether. Due to base effects, core inflation may even increase again temporarily by the end of the year.
However, going forward, headline inflation will be mainly determined by new inflation impulses The recent surge in the oil price is likely to increase it in the short term, although the high volatility of the oil price makes it difficult to estimate the expected increase precisely. Futures markets suggest lower oil prices in the medium term, suggesting lower (or even negative) energy price inflation. However, the uncertainty surrounding this remains high. We have slightly raised our forecast for average euro area inflation for 2025 from 2.1% to 2.2% and lowered it slightly for 2026 from 1.9% to 1.8%. A definitive return of inflation below 2% remains to be awaited for a few more months.
US inflation remains well-behaved for now
US inflation remained soft in May. Both core and headline inflation increased by 0.1% month-on-month. Despite unfavourable base effects, headline inflation only modestly increased (from 2.3% to 2.4%), while core inflation remained unchanged at 2.8%. Aside from food prices, which increased by 0.3%, all major categories were soft.
Energy prices declined by 1%, mostly due to an earlier big drop in gasoline prices. Shelter prices increased by 0.3%, a deceleration vs last month. Both owner-equivalent rent and rent of primary residence decelerated. Market rents also decelerated notably in the last 6 months, which bodes well for future shelter prices.
Services excluding shelter were notably soft, increasing by only 0.1% last month. Many service categories were softish. Prices for professional medical care services were unchanged, while transportation services declined. The latter category was influenced by another big drop in airline fares (the third in a row). Overall, travel-related components have shown softness in the latest CPI-prints, given the big decline in international tourism to the US.
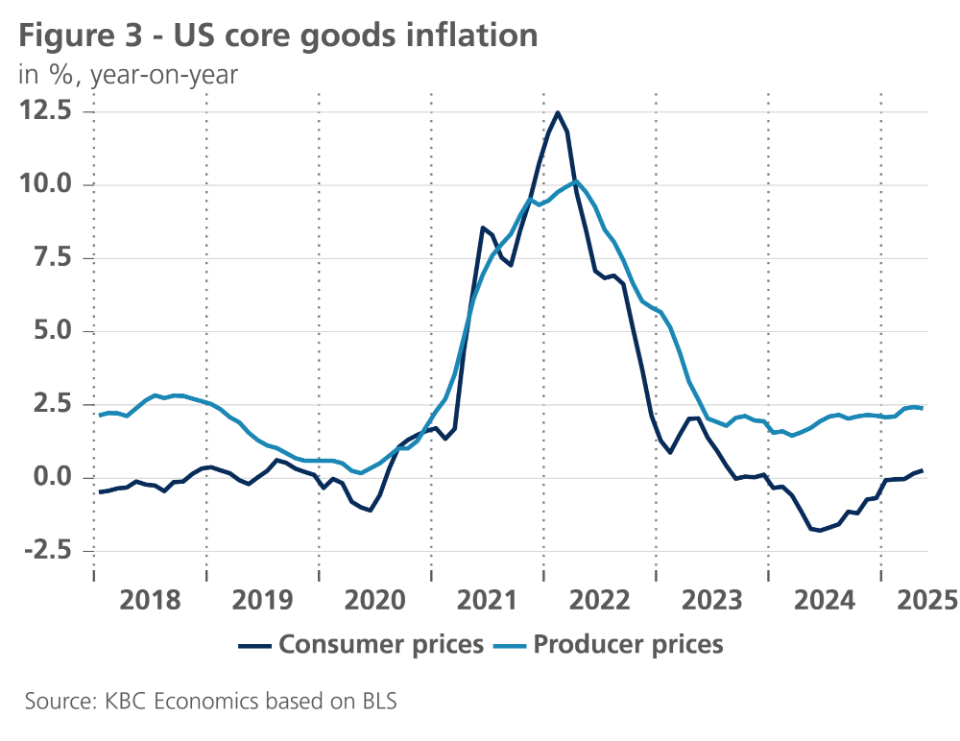
Most notable were the soft figures for core goods inflation. Notwithstanding recent major tariff increases, core goods prices were unchanged last month, while core producer prices increased mildly (see figure 3). Surprisingly, many import-dependent categories such as new vehicles and apparel even declined. That said, some import-dependent categories such as toys or computer hardware saw their prices increase markedly last month (by 1.3% and 1.1% month-on-month respectively). This suggests that the passthrough of tariffs to prices will be slower than expected and probably unevenly distributed across sectors.
The lower April and May inflation figures and the de-escalation in the trade war with China, also had a beneficial effect on consumer inflation expectations. Overall, despite the recent rise in oil prices, we slightly lower our inflation forecasts for both 2025 and 2026 by 0.1 percentage points to 2.9% and 2.7% respectively.
Surprisingly strong growth rebound in euro area
In the euro area, real GDP growth was revised upward to 0.6% in the first quarter of 2025 (versus the previous quarter). That is double the initial estimate, which was itself well above expectations. The unexpectedly better growth figures (throughout many euro area countries) were driven by exports to the US, which experienced a sharp boost in the final weeks of the quarter in anticipation of import duties. This was particularly the case in Ireland, where real GDP in the first quarter was almost 10% higher than in the previous quarter mainly due to MNE operations. With a weight of barely 4% in euro area GDP, the Irish economy thus provided more than half of the euro area GDP growth figure.
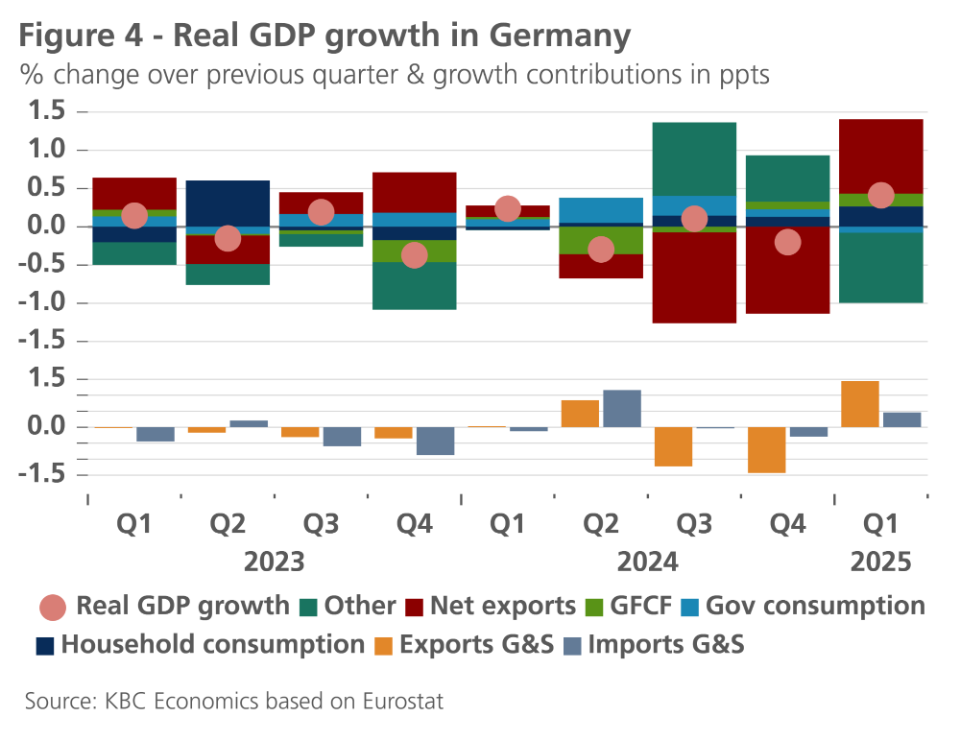
German exporters also boosted their exports to the US - especially those of cars and pharmaceuticals - sharply in the final weeks of the first quarter. Total exports of goods and services in the first quarter rose by 3.2% (in constant prices) compared to the previous quarter. That resulted in a positive contribution of net exports to GDP growth of almost 1 percentage point (after strong negative growth contributions in the previous quarters – see figure 4). Admittedly, the GDP growth effect from increased exports was tempered by the fact that a lot of goods were supplied from existing inventories. But as German consumption and investment also picked up modestly, the German economy ended up growing by 0.4% in the first quarter - double the initial estimate and significantly more than expected.
The strongest growth in the euro area was again recorded in Spain (0.6%), while the Italian economy also showed a relatively strong performance (0.3%). Belgium did slightly better with growth of 0.4%, which was significantly better than neighbouring France and the Netherlands, where growth was stranded at 0.1%.
The 0.6% growth rate - equivalent to almost 2.5% on an annualised basis and more than double the potential growth - is unlikely to be repeated in the near future. On the contrary, underlying growth dynamics remain weak. For the second and third quarters of 2025, we assume quasi-zero growth. Uncertainty due to the trade war, military conflicts and the need for additional military spending in a context of much-needed fiscal consolidation in most countries is likely to continue to weigh on economic activity. Despite some improvements, most sentiment indicators remain weak.
All eyes are on the new German government. In the 2025 budget and the multi-year financial plan, it will make its grand investment plans and military spending in the coming years more concrete. This will also make it clearer how some short-term stimulus measures, such as corporate tax relief and a reduction in energy prices, will be financed. But the full picture on Germany's public finances and its growth impacts (including those of the important Länder and de-budgeted spending) may only become clear during the summer months. Nevertheless, we still expect a growth boost to the German economy even before the year-end, but especially in 2026 and 2027. As defence spending usually provides little direct economic impetus and investments require time for implementation, we assume a gradual strengthening of growth. An unexpectedly strong confidence recovery could provide a positive surprise, however, as households' historically high savings rate and their consumption underperformance built up since the pandemic could support a German consumption boom with spill-over effects to the rest of the euro area.
We nevertheless maintain our base case for the euro area of (cumulative) barely 0.1% growth in the second and third quarters, with growth rates picking up from the fourth quarter and especially during 2026. However, the substantially stronger-than-expected growth rate in the first quarter causes an upward revision of the expected average growth rate for real GDP in 2025 from 0.9% to 1.2%. The expected average growth rate for 2026 remains unchanged at 0.9%. This leads to the paradoxical observation that the expected acceleration of economic growth in 2026 will be accompanied by a lower average growth rate than in 2025 (see also KBC Economic Brief of 27 June 2025 " The paradox of growth figures").
US GDP set to rebound in Q2
Following a slightly negative growth figure in Q1 (-0.2% qoq annualised), GDP is set to rebound in Q2. Current large swings in import figures (along with wonky developments related to gold imports and exports) muddle the GDP picture somewhat. Changes in imports don’t directly affect GDP figures as imports are subtracted from the other elements of GDP (e.g. personal consumption) which inherently include imported goods and services (see KBC Economic Opinion: “Imports don’t subtract from GDP, but they certainly do play a role”). In practice, however, as different sources are used to calculate each component, the large swings in imports might not be fully captured in the data used to calculate other components (particularly changes in inventories), especially in first estimates.
These factors complicate the estimation of GDP. However, looking at the underlying components of GDP, it appears that overall demand, though slowing, is holding up, and that consumption, despite some concerning signs, should recover somewhat relative to Q1. Non-residential investments may also provide another decent contribution to growth in the second quarter. Meanwhile, an improvement in the trade balance (from -138.3 bn USD in March to -61.6 bn USD in April) not only reflects a sharp drop in imports, but also a decent upswing in exports, the latter of which will have a positive impact on GDP. Given these factors, we revise our Q2 estimate upwards from 0.2% to 0.8% quarter-on-quarter.
Looking at growth in a larger context might give us a better picture of the underlying economic trend. We now forecast GDP will only grow by 0.75% in the first half of the year. This is much lower than the 1.4% growth in the second half of last year. The slowdown can be largely attributed to lower contributions from consumer spending. Data on consumer spending are not particularly encouraging. Consumer confidence data are at low levels, even though they rebounded somewhat after the US and China de-escalated their trade war. Retail sales declined by 0.9% last month, following a 0.1% decline in April. There were particularly big drops in car sales and restaurant spending. That said, the control group, which strips out volatile components (i.e. cars, gas, building materials, and restaurants) grew at a still decent 0.4%.
Worrying signs are also coming from the housing market, which remains under the pressure from high interest rates. The housebuilder sentiment index dropped again in June and is now at its lowest level since the end of 2022. Housing starts and housing permits also declined markedly in May, boding ill for residential investment in Q2.
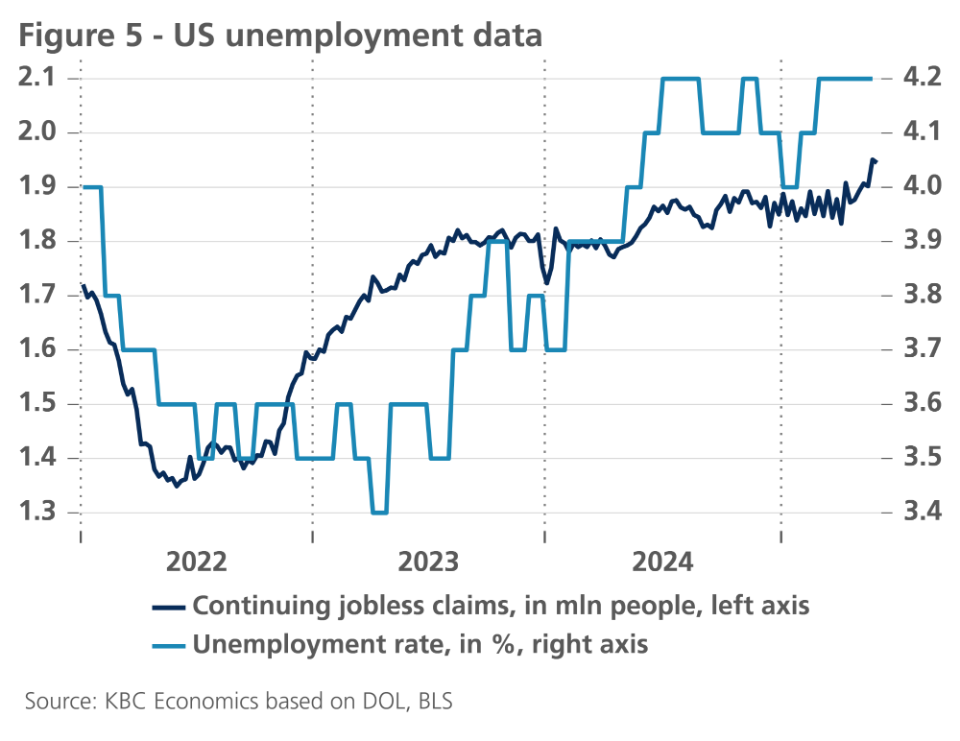
On the positive side, the labour market remains relatively resilient. Non-farm payrolls increased by 139k, firmer than expectations, though there were important downward revision to prior months. The increase was entirely driven by the private sector, as government jobs declined marginally. The number of people employed part time for economic reasons declined for the second time in a row. The unemployment rate also remained constant at 4.2%. That said, weekly unemployment claims indicate that the unemployment rate could tick up slightly in the coming months (see figure 5).
The uncertain trade policy along with stricter migration policies is likely to weigh further on growth in the coming quarters. We expect the economy to be most affected in the second half of this year. Given our major adjustment of our Q2 growth estimate, we upgrade our forecasts from 1.1% to 1.6% for 2025 and from 1.2% to 1.4% for 2026. This implies a major slowdown from the 2.8% growth seen in 2024.
China weathers trade storm better than expected
The Chinese economy appears to be weathering Trump’s trade war better than originally expected. A temporary reprieve in mid-May from tit-for-tat escalating tariffs with the US (which quickly reached 125% and 145%, respectively), followed by an agreement in early June on a framework to stick to that truce, have helped reduce disruptions.
Uncertainty remains high, however, with the latest agreement hardly constituting a friendly and growth-supportive trade deal between the two countries. US tariffs on Chinese goods remain at an extremely elevated 55%, while Chinese tariffs on US goods stand at 10%. Export controls on specific products (e.g. US chips) remain in place, and there is a lack of clarity on whether future talks to reduce tariffs further or to address Trump’s concerns over the trade balance between the two countries will take place.
For now, the impact on Chinese economic activity is evident but altogether muted. While exports to the US declined 34% year-on-year in May, total Chinese exports still grew 4.8% year-on-year. Meanwhile, both industrial production and retail trade showed surprising strength in May, up 0.6% and 0.9% mom, respectively (or 5.8% and 6.4% year-on-year, respectively). If the trend continues in June, the Chinese economy could be on track to grow above 5% year-on-year in the second quarter.
There are still many reasons to remain cautious about the outlook, however. Consumer confidence remains weak, translating into still elevated savings while business sentiment in the manufacturing sector has fallen below levels indicating a contraction. Private sector investment continues to stagnate while foreign fixed asset investment growth is still deeply negative (down 13.4% in the first 5 months of the year relative to the same period last year). Meanwhile, inflation continues to point to slack in the economy. Though core inflation ticked up marginally to 0.6% year-on-year in May, producer prices fell 3.3% year-on-year.
Given these concerns, we only modestly upgrade our outlook for China’s Q2 GDP growth from 0.1% quarter-on-quarter to 0.5% quarter-on-quarter. This results in an upgrade to our real GDP growth forecast from 4.2% to 4.5% in 2025 and from 4.1% to 4.2% in 2026.
Central banks are keeping an eye on economic developments
The ECB cut its deposit rate further to 2% in June, while the Fed kept its policy rate unchanged at 4.375%. The still high uncertainty surrounding the lingering trade conflict made both central banks signal that with their current policy rates, they are well placed to wait for further economic developments. The main difference between the two central banks is that the ECB policy rate is in the neutral zone, while the Fed says it is still modestly restrictive.
ECB near end of easing cycle
Having already removed its reference to a "restrictive" interest rate level at its previous policy meeting, the ECB stated in June that it is "well placed to navigate through current conditions and uncertainties" after the latest rate cut. This implies that the end of the ECB’s rate cutting cycle is near. We therefore maintain our view that in the third quarter of 2025 the ECB will cut its deposit rate by 25 basis points one last time in this interest rate cycle, to 1.75%. That level would be at the lower bound of the neutral zone, or even slightly stimulative. September's policy meeting seems to be a suitable opportunity for this, as ECB economists will then present updated macroeconomic forecasts again.
The latest ECB rate cut on 5 June was also based on new projections. Compared to the March forecast, expected economic growth through 2027 remained largely unchanged. By contrast, expected headline inflation was revised firmly downwards by 0.3 percentage points each for 2025 and 2026. That notable downgrade to the inflation outlook was attributed by ECB President Lagarde to a lower outlook for energy prices and the stronger euro exchange rate. For 2027, the forecast remained unchanged at 2%, thus in line with the ECB's 2% medium-term target. Hence Lagarde's reference that the end of the interest rate cycle was in sight. Since the ECB does not expect underlying core inflation to be in line with its 2% target until 2026 at 1.9%, our expectation of one more rate cut in this cycle is justified.
An important observation here is that the ECB is quite optimistic about the impact of the trade dispute on inflation. The ECB namely assumes that the EU will not take meaningful retaliatory measures in the trade conflict with the US. ECB inflation optimism is also highly dependent on volatile factors such as energy prices and exchange rate movements. Indeed, the June policy meeting was one of the rare times when the ECB explicitly referred to the euro exchange rate in its press release. This also means that a further strengthening of the euro could lead to additional rate cuts by the ECB to soften the deflationary effect of the currency strength.
Fed waiting for signs of "tariff inflation"
Based solely on the current favourable inflation data, the Fed's policy rate should actually be broadly neutral, especially if we also take into account some underlying vulnerabilities of the US labour market (such as the relatively low rate of job separations and hires). However, Fed Chairman Powell emphasised that monetary policy should be forward-looking, and thus take into account, among other things, the risks of (trade) tariff inflation, even if not yet manifest in current data. Hence, the Fed still considered the current modestly restrictive interest rate level of 4.375% as appropriate.
With this extension of the interest rate pause, the Fed says it is taking time to learn about the inflation impact of the trade conflict. The overall still resilient US labour market gives the Fed the necessary room to do so.
We assume that the Fed will cut its interest rate twice more in 2025, by 25 basis points each time. During 2026, the Fed policy rate is then likely to reach its cyclical low of 3.375%. For 2025, our scenario is in line with the new Fed outlook, but we forecast one more rate cut than the Fed in 2026.
Bond yields sideways for rest of 2025
US 10-year yields are likely to move in a band around current levels for the rest of this year. However, the risks are tilted to the upside. Those risks are caused by the expansionary budget currently going through congress (OBBB-act) and the current 'risk-off' market sentiment towards US bonds.
For German 10-year yields, we expect a gradual decompression of the term premium (gradually eliminating the so-called convenience yield). This will manifest itself mainly during 2026, when the announced fiscal stimulus and associated debt issuance are effectively implemented. The era of relative scarcity of the European benchmark bond, the German Bund, is probably largely behind us.
Against this backdrop, we also expect a further weakening of the US dollar. Besides an increasing risk premium on the dollar, this also reflects the dollar's still significant overvaluation against the currencies of US trading partners (and thus not only against the euro). Moreover, the dollar will likely receive less interest rate support from autumn 2025 onwards. Indeed, the Fed is then expected to resume its easing cycle, at a time when the ECB will have completed its easing.
Further decline of intra-EMU spreads
Intra-EMU spreads between eurozone government bonds narrowed further recently. For instance, Italy's 10-year interest rate spread with Germany fell below 100 basis points. We expect a further moderate narrowing of spreads, despite ongoing uncertainty and rating downgrades of, for example, Belgium. Driving factors remain a 'risk-on' market sentiment towards Europe, which was also reflected in declining eurozone corporate bond spreads. Market expectations of stronger future fiscal cooperation within the EU may also play a role, and certainly the stabilising effect of the ECB's Transmission Protection Instrument.
All historical quotes/prices, statistics and charts are up-to-date, up to 23 June 2025, unless otherwise stated. Positions and forecasts provided are those of 23 June 2025.