

Economic Perspectives December 2022
Read the full publication below or click here to open the PDF.
- European natural gas prices increased again significantly in November as the weather turned cold. They reached 146 EUR per MWh by the end of the month, a 26% month-on-month increase. However, with European gas reserves very high, the risk of strong and protracted gas rationing has substantially slimmed. Oil prices, meanwhile, have declined 8% month-on-month to 85 USD per barrel as Chinese Covid lockdowns reduced demand and sanctions relief on Venezuela increases supply in the longer term.
- Overall, lower energy prices brought euro area inflation down, from a record 10.6% year-on-year peak in October, to 10% year-on-year in November. Headline inflation declined in all major euro area economies except France. Core inflation also remains stubbornly high at 5% year-on-year. Inflation risks are becoming more widespread and entrenched, however, as wage pressures remain high on the back of past inflation. While we expect inflation to peak soon, its downward path in 2023 is likely to be gradual. We revised downward by 0.1 percentage points our euro area inflation forecast for 2022 to 8.4% while increasing somewhat the 2023 inflation outlook to 6.3%.
- In the US, further signs are emerging that inflation has peaked and is on a steady downward path. Not only did CPI inflation drop in October – to 7.7% year-on-year, the lowest level since January – so did producer prices and import prices, two leading indicators of inflation. PCE inflation, the Fed’s inflation benchmark, also dropped from 6.3% to 6.0% year-on-year. Wages keep growing at a rapid pace, however, as average hourly earnings increased by 5.1% year-on-year in November. We maintain our 8.1% inflation forecast for 2022 but downgraded our 2023 forecast by 0.1 percentage points to 3.9%.
- Better inflation news and worsening economic data is prompting central banks to soften their tone and possibly shift gears. As a result, bond markets rallied recently, while the dollar weakened. We believe, however, that markets are getting somewhat ahead of themselves as core inflation remains globally too high and labour markets too tight for major central banks to be comfortable and aim for an early exit. We maintain that the Fed policy rate and ECB deposit rate will peak in Q2 2023 well above 5% and 3%, respectively. We expect these rates to be maintained throughout 2023.
- The euro area economy is now entering a challenging period as winter weather will drive up gas consumption. Household spending, especially in services, keeps the economy in positive territory for now. However, consumer and producer sentiment indicators are bottoming out at low levels and are still pointing to a mild recession. We maintain our euro area growth forecast of 3.2% in 2022 and 0.2% in 2023.
- The US economy continues to show signs of resilience in Q4 2022. The labour market remains in good shape, as non-farm payroll increased by 263,000 in November. New durable goods orders and retail spending also surprised positively. Forward-looking indicators such as consumer and producer confidence deteriorated, however. We hence upgraded our 2022 forecast by 0.1 percentage points to 1.9% and downgraded our 2023 forecast by 0.1 percentage points to 0.4%.
- The Chinese economy remains under heavy pressure as a new Covid wave weighs on the economy and the real estate crisis still looms. Retail sales and producer sentiment indicators point to slower growth ahead. Widespread protests show how unpopular the government’s Covid policy is. Nonetheless, a low elderly vaccination rate makes rapid easing of Covid restrictions complicated. We downgrade our growth forecast by 0.2 percentage points for 2022 to 3% and 0.3 percentage points to 4.2% for 2023.
Fans have little reasons to cheer the world economy
Much of the world may be focused on football at the moment, but the world economy is entering a darker period. In Europe, cold weather spells are driving natural gas prices back up and continue to weigh heavily on industry and households that are already suffering from high inflation and higher interest rates. In the US, the economy remains resilient so far, but continued monetary tightening will likely push economic growth to a mild recession in 2023, especially as the real estate market weakens. Meanwhile the Chinese government is flip-flopping on its zero-Covid policy as daily cases reach new highs. Not all is doom and gloom. There are signs that inflation is peaking, in particular in the US, thanks in part to lower commodity prices and easing supply chain constraints. The road to recovery is long, however, and the possibility of a deep global recession is not off the cards. Risks to the downside include further escalation in the Ukraine war, an intensifying US-China stand-off and liquidity issues in financial markets.
Gas prices on the offensive, oil prices on the defensive
European natural gas prices increased in November as the weather turned cold. They reached 146 EUR per MWh by the end of the month, a 26% month-on-month increase. While still 53% higher than a year ago, the natural gas price is 54% below its August peak. Consumers adapted well to the price shock as EU gas demand was around a quarter below the five-year average in October and November. Meanwhile, European stock levels are filled at 94% and the risk of protracted gas rationing thus remains limited.
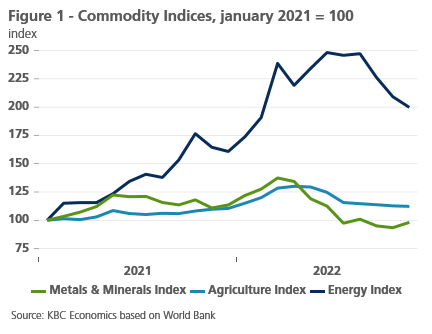
Oil prices meanwhile decreased by 8% month-on-month to 85 USD per barrel, mainly due to new Covid outbreaks in China. US sanctions relief on Venezuela, which sits on 20% of the world’s proven oil reserves, will increase oil supply in the medium term. On the upside, lower oil prices could induce the US government to refill its strategic petroleum reserves. Meanwhile, the price cap of 60 USD per barrel on Russian oil is unlikely to disrupt supply, as Ural prices are currently trading at around 55 USD. Oil is not the only commodity whose price is going down. Most commodities have been on the decline in recent months (see figure 1), but many are still well above pre-pandemic levels.
Supply chain easing lives up to its dark horse status
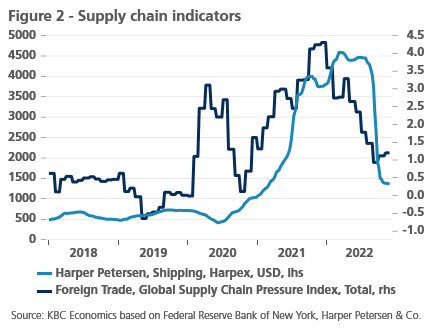
Lower commodity prices aside, easing supply chain constraints are also a positive development and will help ease inflationary pressures. Shipping prices dropped significantly as the Harpex shipping prices dropped by 70% since its peak in March (see figure 2). Used vehicle prices, according to the Manheim index, declined by 15% since their peak, but remain around 40% higher than before the pandemic. In the US, according to the ISM Survey, order backlogs are contracting at their most rapid pace since May 2020. As a result, the New York Fed’s Global Supply Chain Pressure Index has dropped from 4.3 to 1.0 in less than a year. Further adaptation and lower global demand could soften supply chain pressures in the coming months. However, the possibility of heavy Covid lockdowns or increasing Covid caseloads in China or natural gas shortages in Europe still pose a risk to global supply chains.
Euro area inflation feints
Euro area inflation fell to 10.0% in November from 10.6%. The drop was caused solely by the fall in energy price inflation to 34.9% from 41.5% in October. That decline was caused by the fall in gas and oil prices on international markets. Government measures to soften the energy price rise for consumers also contributed. In the Netherlands, for example, the introduction of a price cap caused energy price inflation to fall from almost 100% in October to 41.6% in November. As a result, inflation there fell by as much as 5.6 percentage points in one month (albeit still high at 11.2%).
Core inflation in the euro area stabilised at 5%, while the annual rate of increase in food prices (including alcohol and tobacco) accelerated from 13.1% to 13.6%. In that respect, the fall in overall inflation was more of a feint. Based on the current outlook for energy prices - which, however, remain highly volatile and uncertain - we may assume that the peak of inflation has been reached. Still, the expected inflation cooling is likely to be a difficult and gradual process.
In particular, stubbornly high core inflation underlines that the inflation problem is far from over in the euro area. Detailed analyses show that the indirect pass-through of higher energy costs into various consumer goods and services is still in full swing. The aftermath of supply disruptions during the pandemic also continues, while the post-pandemic demand recovery (see above) is also contributing to more inflationary pressures. These factors are likely to continue to play a role for some time. As they gradually exert their full impact, there is likely to be some more upward pressure on core and food price inflation from labour cost developments. We do not expect a full-fledged wage-price spiral, but rather a spread-out and probably incomplete catching-up of wages on the recent inflation upswing. (Belgium is an exception in this respect due to automatic wage indexation) This means that the final return of inflation to or below the ECB’s 2% target (in the medium term) could be in reach in the next years. In the meantime, the path may be crossed by high volatility of energy prices.
Against this background, we raised our forecast for average euro area inflation in 2023 from 6.1% to 6.3%. Due to the inflation feint in November, the average inflation rate for 2022 is likely to be slightly lower than previously expected: 8.4% instead of 8.5%.
The US is no longer an inflation champion
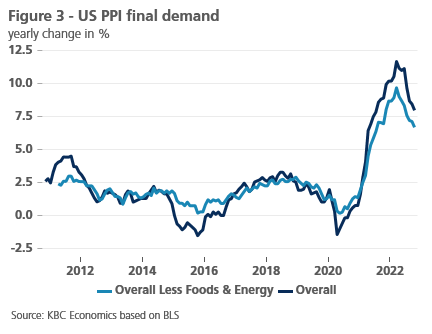
In the US, October data pointed to a moderation of inflationary pressure. Headline inflation slowed to 7.7% year-on-year in October, the fourth decline in a row. Core inflation also notably declined to 6.3%, down from 6.6% in the prior month. Producer price inflation, a (fast) leading indicator of CPI inflation, also slowed markedly in October to 8%, the lowest level since July 2021 (see figure 3). Import prices also declined for the fourth month in a row. PCE inflation, the Fed’s indicator on which the Fed states its inflation goal, declined from 6.3% year-on-year to 6.0% year-on-year, while core PCE declined from 5.2% to 5% year-on-year. Tight labour markets remain a major cause for concern, however. At 3.7%, the unemployment rate remains very low and hence wage pressure remains high. Average hourly earnings increased by 0.6% month-on-month and 5.1% year-on-year in November. We maintain our 8.1% inflation forecast for 2022 but downgraded our 2023 forecast by 0.1 percentage points to 3.9%.
VAR (Very Aggressive Rate hikes) under review
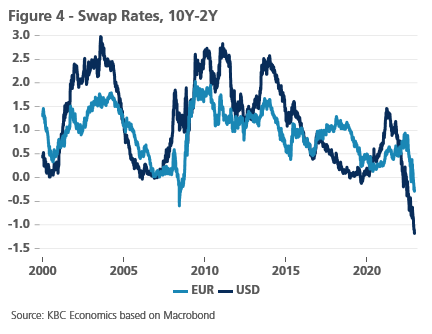
Core bond yields have staged a dramatic decline over the past few weeks. After hitting multi-year highs in October, the US yield curve shifted south with declines ranging between 30 basis points at the front and almost 80 basis points at the long end. This resulted in the sharpest inversion (2y-10y) since the early 80s. European swap yields dropped in a similarly impressive fashion, causing the curve to invert in most segments too (see figure 4).
The sharp downward correction gained significant speed after US CPI and European inflation readings caused markets to conclude that the worst of the inflation surge is over. Markets drew additional comfort from the latest European inflation reading. The current market narrative entails that central banks, the Fed in the lead, could soon prioritise economic growth over inflation once again. US money markets currently discount a terminal Fed policy rate of 4.75-5% vs 3.75-4% today. This compares to the 4.5-4.75% the Fed had pencilled in in the September dot plot but of which chair Powell at the November meeting said probably needs to be put higher. After reaching the peak in Q2 2023, markets already assume 50 basis points of rate cuts in the second half of next year. In the euro area, markets pared ECB deposit rate expectations from 3.25% to less than 2.75% by Q2 next year. The core bond rally was accompanied by a sharp reversal in the US dollar. Once king, the greenback is now suffering from massive long-offloading. Dollar weakness brought EUR/USD from near 0.95 end September to above 1.05 today.
We acknowledge the reigning market sentiment but at the current stage do not underwrite it. We do side with the idea of the Fed slowing down the tightening pace from 75 to 50 basis points later this month. This has already been communicated by several governors, including Powell. We’ll be closely watching that December meeting for 2023 guidance (dot plot), but our base case for now assumes another 100 basis points tightening over the first three meetings in 2023 given fundamental labour market strength. Unlike markets, our expected terminal rate of 5.25/5.5% is there to stay throughout 2023. Based on recent data and speeches, we now think the ECB is to follow the Fed by shifting from 75 to 50 basis points at the final meeting of this year. As a quid pro quo from doves to hawks, the ECB will start passive quantitative tightening early next year by not fully reinvesting proceeds from maturing bonds. We leave our peak ECB policy rate unchanged at 3.5% by Q2 next year as we go into the outcome of the December ECB gathering.
While the Fed and the ECB do sound slightly more nuanced than before, their top priority remains tackling inflation and keeping expectations anchored closely to the 2% target. Keen on avoiding the mistakes made in the 70s, this cannot and will not change anytime soon. We assess the current core bond rally and dollar correction to be out of sync and not consistent with the inflation objective. A reversal of market sentiment is nevertheless tricky to materialize in the short run with central bank meetings only due mid-December and trading volumes rapidly declining as the year-end approaches. By 2023 however, we may well see the return of the trends that dominated much of 2022.
Euro area economy still in the knock-out phase
Most indicators on business confidence in the euro area broadly stabilised over the past month. The purchasing managers’ confidence indicator (PMI) in the services sectors remained unchanged at 48.6 in November, while in manufacturing, a small improvement from 46.4 to 47.1 was recorded. However, both indicators and the composite indicator remained below 50, suggesting that the economy stays in contraction mode. But the bottoming out of the confidence indicator at levels not too far below 50 suggests that the recession will remain rather mild.
The European Commission sentiment indicator rose to 93.7 in November from 92.7 in October. That is the same level as in September, suggesting stabilisation here too, below the benchmark of 100. Among entrepreneurs, a slight deterioration in confidence was still recorded in industry and construction, a status quo in retail trade and a slight improvement in other service sectors. Among consumers, confidence improved more markedly. That said, it is still at an extremely low level following the sharp decline during the period March-September.
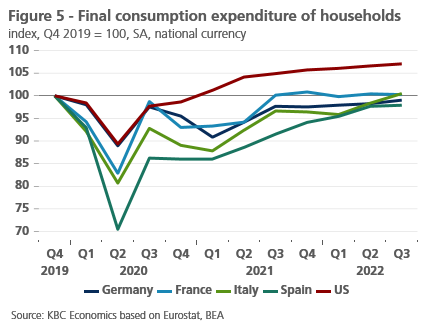
Despite that downturn, household spending in Germany, Italy, and Spain, among others, made an important contribution to the unexpectedly positive real GDP growth rate in the third quarter. However, that does not mean that consumption is booming. The partially available detail figures show that consumption growth was mainly in services, although there was also an increase in consumption of durable goods in the third quarter in the three largest euro area countries. In contrast, consumption of non-durable goods fell there. However, the overall level of consumption in the four major euro area countries is only at or still below its pre-pandemic level, reflecting the premature ending of the economic recovery due to the energy crisis and the invasion of Ukraine. In contrast, US consumption in the third quarter of 2022 was more than 7% higher than in the fourth quarter of 2019 (see figure 5). Hence, consumption growth in the euro area is still essentially a consequence of a normalisation of the post-pandemic consumption pattern.
The spending of savings buffers accumulated during the pandemic could theoretically provide a further boost to consumption. But against the backdrop of hard-hit purchasing power and war-related uncertainty, this seems unlikely, as was indicated by the strong decrease of real retail sales in October in the euro area (-1.8% compared to September and -2.6% compared to September 2021). We expect the savings buffers in practice to dampen the recession, rather than provide a real growth stimulus. For the final months of 2022 and for 2023, our expectations for real GDP growth remain unchanged: a limited downturn in the economy over the winter, followed by a difficult recovery afterwards. As a result, annual average real GDP growth would slow from 3.2% in 2022 to 0.2% in 2023.
US economy is playing extra time
The US economy keeps resisting the pressure of monetary pressure so far. Q3 GDP growth figures have been revised upwards by 0.3 percentage points to 2.9% quarter-on-quarter annualised, and Q4 figures look relatively positive so far. The labour market remains healthy, as non-farm payrolls increased by 263,000 in November, while unemployment remains low. New durable goods orders increased by 1% month-on-month in October, while real consumer spending posted a solid gain of 0.5% month-on-month. The goods trade deficit widened by 7.7% month-on-month in October, however, and construction spending, the prime victim of monetary tightening, declined 0.3% month-on-month. We upgraded our 2022 forecast by 0.1 percentage points to 1.9%, as we now expect Q4 GDP to reach 0.3% quarter-on-quarter up from -0.1% quarter-on-quarter.
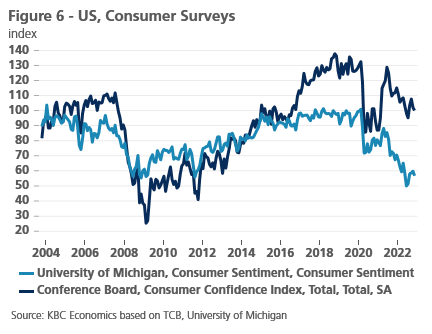
Forward-looking indicators point to more trouble ahead, however. Consumer Sentiment Indicators declined further (see figure 6) as consumers are seeing their savings dwindle. Meanwhile, producer confidence indicators are now clearly in contraction territory. The composite PMI declined to 46.3, a 1.9-point decline vs October. Meanwhile, the ISM Manufacturing declined from 50.2 to 49. New orders are also in clear contraction territory in the October reports. We hence downgraded our 2023 forecast by 0.1 percentage points to 0.4%.
China keeps scoring own-goals on its zero-Covid policy
The short-term outlook for the Chinese economy has dimmed once again thanks to a slew of rather weak data releases on top of a sharp rise in new Covid cases. Economic indicators point to a difficult start to the fourth quarter. Business sentiment surveys, which were already in contraction territory (below 50) in October, point to further weakness in November, with the NBS manufacturing and non-manufacturing indices deteriorating to 48.0 and 46.7, respectively. Hard data also confirms a weak start to the quarter, with retail sales declining 0.5% year-over-year (0.7% month-over-month) in October, while both imports and exports contracted 10.6% and 8.7% year-over-year in November. Industrial production held up better but also decelerated to 5.0% year-over-year growth in October.
Meanwhile, Covid cases have skyrocketed since the beginning of November. The sharp rise in cases came just as the government released twenty guidelines meant to help ease somewhat the enforcement of zero-Covid policy. The guidelines range from cutting isolation and quarantine times for close contacts and new arrivals, to preparing the healthcare sector and promoting vaccine and booster uptake (particularly among the elderly). However, the swift rise in cases triggered new harsh lockdowns in a number of cities despite the guidelines, as local governments were still expected to react quickly to contain new outbreaks.
The widespread protests over the last weekend of November, which reached a level not seen for decades, point at increasing social dissatisfaction with this harsh approach to enforcing the government’s Covid policy. While the protests, for now, do not appear to be continuing at the same level, possibly due to a ‘behind-the-scenes’ crackdown by the government, there are also signs that the government is taking the public’s discontent into consideration. Lockdown measures have been eased in Guangzhou, for example, despite a still high caseload, and new messaging from top officials hints at a softer approach going forward. While a shift in China’s Covid policy would be a positive development in the medium term, in the short run it can still cause a bumpy economic road ahead, as it is uncertain how the virus will circulate among a population that has so far seen very low case rates and has mostly relied on non-Western vaccines. A sharp rise in hospitalizations in the coming months could weigh sharply on activity and add to social unrest.
We therefore downgraded our forecast for fourth quarter GDP growth while upgrading somewhat our expectations for growth later in 2023. All-in-all, this leads to a downgrade of 2022 annual average growth from 3.2% to 3.0% and, due to overhang effects, a downgrade of 2023 annual average growth from 4.5% to 4.2%.
All historical quotes/prices, statistics and charts are up-to-date, up to 5 December 2022, unless otherwise stated. Positions and forecasts provided are those of 5 December 2022.