

Economic Perspectives April 2022
Read the full publication below or click here to open the PDF.
- The Russia-Ukraine war imposes a large negative supply shock on the global economy. A surge in commodity prices will, on balance, lead to higher inflation and lower economic growth. However, the magnitude of these effects remains highly uncertain and contingent, above all, on the duration of the war and policy responses. In addition, the effects of the shock are distributed unevenly across regions. Europe is set to be the hardest-hit region, largely reflecting its high reliance on Russian energy imports.
- Inflationary pressures continue to build up across advanced economies. We are doubtful that the inflation spike has already fully run its course with the near-term risks still being tilted to the upside in the face of the war in Ukraine. That said, headline inflation will stay higher for longer in both the euro area and the US and will only come close to central banks’ 2% targets in the course of 2023. Our inflation outlook for 2022 and 2023 has thus been markedly upgraded, particularly in the euro area.
- Europe is set to bear the brunt of the economic shock caused by the war in Ukraine. The first batch of March soft indicators in the euro area shows a large hit to consumer sentiment from the war, clouding the outlook for household consumption. Although business sentiment has so far proved more resilient, the war led to a notable deterioration in firms’ expectations. We now expect the recovery in the euro area to come to a standstill in Q2 and Q3, with a downside risk of a technical recession. Overall, we have lowered our real GDP forecast to 2.3% for 2022, while also downgrading our 2023 forecast to 1.4%.
- The first-quarter data suggest continued solid economic activity in the US, supported by robust consumer spending. A rapid tightening of the labour market also points to resilience in domestic activity, with the unemployment rates now effectively at the pre-pandemic levels. Looking ahead, we nonetheless see room for some moderation in underlying growth dynamics, especially amid more restrictive Fed monetary policy. As a result, we have maintained our forecast for 2022 real GDP growth at 3.1% but marked down our 2023 GDP growth forecast from 2.3% to 1.9%.
- China’s strict zero-covid policy has collided with the highly transmissible Omicron variant, leading to a deterioration in the outlook for Chinese GDP growth in recent weeks. The lockdowns have disrupted economic activity on both the production and consumption side as factories and businesses have been shut or subject to severe restrictions. Despite various measures to offset the domestic impact of the lockdowns, it will be challenging to manufacture a swift rebound in activity given problems still weighing on the real estate sector. It therefore becomes even more difficult for the authorities to reach the 5.5% GDP growth target this year, and we have downgraded our growth outlook to 4.8% for 2022 from 5.0% previously.
- The path of policy normalisation has become more complicated due to negative spillovers from the war in Ukraine, particularly in the euro area. We nonetheless believe that the ECB’s step-by-step monetary policy normalisation remains on track, with a first 25 bps rate hike expected in September and the hiking cycle extending into 2023. Meanwhile, the Fed already commenced its tightening cycle with a 25 bps rate hike in March. In line with the hawkish guidance, we have revised our Fed call towards a more front-loaded hiking cycle in 2022, supported by the balance sheet runoff expected from May onwards.
As the war in Ukraine has entered its seventh week, the humanitarian crisis caused by Russia’s aggression has reached dire proportions. Russia’s reduction of military activity around the capital city of Kyiv has raised some hopes of a breakthrough in cease-fire negotiations. However, the Russian military is now believed to have moved some of its troops to positions elsewhere in Ukraine, especially the Donbas region. Despite prevailing optimism around the peace talks, we thus remain relatively cautious and think that it will likely take several months before any peace deal between Russia and Ukraine can be achieved.
A negative supply shock from higher commodity prices
The economic implications of Russia’s invasion of Ukraine and related (self-)sanctions have already started to unfold and will continue to affect the global economy in the coming months. The Russia-Ukraine war imposes a large negative supply shock given Russia’s (and to some extent also Ukraine’s) outsized role in global commodity markets, stretching from energy and metals to agriculture. Indeed, so far, the most direct effect of the war on the global economy is felt from higher commodity – especially energy – prices.
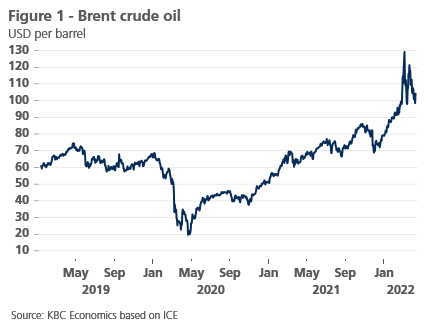
To begin with, the oil market has remained particularly volatile since Russia’s invasion of Ukraine, with Brent crude currently hovering around USD 105 a barrel (figure 1). The largest US-led Strategic Petroleum Reserve release in history, amounting to 240 million barrels over the next 6 months, will provide some near-term relief to the market. However, these additional supplies still fall short of the self-sanctioning-induced loss of Russian oil exports, implying very tight market conditions going forward. Hence, our outlook assumes oil prices staying above USD 100 a barrel throughout 2022, with the risks tilted to the upside.
Meanwhile, natural gas prices (Dutch TTF) have stabilised somewhat, albeit at elevated levels of around 110 EUR/MWh, roughly five times higher on a year-on-year basis (figure 2).

The uncertainty surrounding future Russian gas supplies nonetheless persists, highlighted by Russia’s request for gas payments in roubles. So far, Russian gas exports continue to flow into Europe, yet the risk of an abrupt halt of gas supplies from Russia is, in our view, notable. As a result, we see limited room for a normalisation in gas prices going ahead, even more so as the European Union steps up efforts to reduce its reliance on Russian energy imports (see Box 1: EU’s efforts to reduce dependency on Russian energy supplies).
Box 1 – EU’s efforts to reduce dependency on Russian energy supplies
The European Union’s dependency on Russian energy imports, in particular natural gas and crude oil, has been a longstanding concern. Russia accounts for more than 40% of gas imports and around 25% of oil imports, though there are significant cross-country differences.
After almost two months of Russian aggression in Ukraine, the political pressure to reduce energy imports from Russia is on the rise, and there even appears to be a broad agreement that energy imports from Russia should be reduced. However, there is less agreement on the scale and the pace that a reduction should proceed, with several member states, including Germany and Hungary, blocking a full import embargo.
In general, the European Union’s ability to switch away from Russian supplies is greater for oil than for natural gas. This is largely because more than two-thirds of Russian oil exports into Europe are via seaborne routes, implying greater logistical flexibility. Furthermore, there are ample strategic petroleum reserves equal to at least 90 days of net imports. On the other hand, around 95% of Russian gas exports are transferred into Europe via pipelines. Unlike oil, there are no strategic gas inventories to draw upon, and there are significant infrastructural and logistical barriers to rapidly ramp up imports of LNG.
In March, the European Commission put forward a proposal (REPowerEU) to reduce dependency on Russian gas and make the EU independent from Russian fossil fuels well before 2030. This plan outlines a series of measures, including a requirement to replenish gas storage to at least 90% of its capacity by 1 October each year. The EC seeks to diversify gas supplies via higher LNG and pipeline imports from non-Russian producers. In addition, the EC proposes to speed up the roll-out of renewable gases and to replace gas in heating and power generation. According to the EC, all these measures can reduce EU demand for Russian gas by two thirds before the end of 2022.
These aspirations for increased EU’s energy independence seem particularly challenging over such a short horizon. To begin with, most Russian oil and gas imports are contracted under long-term commitments, meaning that without explicit contract terminations (or alternatively force majeures), the decoupling could take some time. In addition, there seems to be a trade-off between the pace of decoupling and its costs: the more rapidly the EU seeks to reduce Russian imports, the higher global energy prices likely will increase (and the larger the drag on economic growth). An abrupt shut-off of Russian energy exports to Europe would likely push the continent into economic recession.
Importantly, there appears to be a case for coordinated action on the EU level to avoid a situation in which member states are bidding against each other to secure alternatives to Russian energy supplies, making them even more expensive. At the same time, a reduction in Russian energy imports is set to affect some countries more than others (the most exposed is the CEE region), possibly necessitating some fiscal action undertaken at the level of the EU as a whole.
Finally, the scale and speed of the transition away from Russian energy supplies are set to be influenced by the evolution of the war in Ukraine. The more intense and extended that war is, the stronger the political pressure will be to cut imports from Russia more aggressively.
At the same time, the impact of the Russia-Ukraine war on agriculture commodities and by extension on food prices should not be underestimated. In March 2022, global food prices went up 36% year-over-year and surged further to all-time highs (figure 3). Russia and Ukraine together account for a quarter of the world’s wheat exports, as well as a large share of global production of other grains. A food price shock will be felt across the global economy, however, emerging markets and developing countries appear particularly vulnerable (due to the higher share of food in the household spending basket), bringing back memories of the early 2010s episode when elevated food prices sparked social unrest in many less-developed economies.

Higher inflation, lower growth (albeit unevenly distributed)
A surge in commodity prices due to the Russia-Ukraine war will lead, on balance, to higher inflation and lower economic growth. However, the magnitude of these effects remains highly uncertain and contingent, above all, on the duration of the war and policy responses. In addition, the effects of the geopolitical shock are distributed unevenly across regions. Europe is set to be the hardest-hit region, largely reflecting its high reliance on Russian energy imports. By the same token, the overall impact on the US will be significantly less severe given its broadly neutral energy import-export balance.
An inflation shock yet to fully run its course
We have markedly upgraded our inflation outlook for 2022 and 2023 to take into account the war-induced surge in energy and other commodity prices, particularly in the euro area. Inflationary pressures have been building for over a year now, with the latest inflation prints reaching multi-decade highs in both the US and the euro area (figure 4). In general, we believe that headline inflation will stay higher for longer and is set to come substantially down towards central banks’ 2% target only in the course of 2023.

In other words, we are doubtful that the inflation shock has already fully run its course. Moreover, the near-term risks are still tilted to the upside with the war in Ukraine possibly leading to even stronger upward pressures on prices. At the same time, developments beyond the war are also important, in particular those related to the pandemic. China is currently experiencing its worst Covid outbreak since the start of the pandemic, raising the risk of longer – if not more intensified – supply chain disruptions.
In March, the inflation print in the euro area once again surprised to the upside. Headline HICP inflation accelerated to 7.5% year-over-year, driven by a sharp increase in energy prices and to a lesser extent also by a jump in food prices. The former is currently responsible for more than half of euro area headline inflation. Core inflation also picked up to 3.0% year-over-year as both goods and services inflation accelerated. We expect euro area inflation to stay elevated for several months, with volatility in global commodity markets continuing to dominate price dynamics. Overall, we now forecast euro area inflation to average 7.3% (up from 5.5% previously) in 2022, before moderating to a still substantial 3.4% (up from 2.2% previously) in 2023.
Strong inflationary pressures have also taken hold in the US. Headline CPI inflation accelerated to 8.5% year-over-year in March. In contrast to the euro area, price pressures in the US are more broad-based. As the US is not dependent on Russian gas supplies, a rise in energy prices ‘only’ accounted for around a quarter of total US headline inflation. Meanwhile, core inflation has accelerated to 6.5% year-over-year, which implies just a 0.3% month-over-month change. It is worth noting that the March inflation print was again positively affected by shelter (0.5% month-over-month), while lower used vehicle prices (-3.8% month-over-month) have reinforced our view that this covid-sensitive CPI item should add downward pressure to inflation in 2022.
We believe that US headline inflation peaked in March. A strong negative base effect, together with lower gasoline prices, will drive US inflation down in the coming months. In the medium-term, it will be more restrictive Fed monetary policy that will bring disinflation in the fourth quarter of 2022 and through 2023. Overall, we now forecast US inflation to average 6.5% (up from 5.8% previously) in 2022 and a return to the Fed’s target of 2% (down from 2.1% previously) in 2023.
Euro area: recovery likely to come to a standstill
Although February hard data suggest that the euro area economy was growing at a decent pace in the first quarter of this year, this now feels like a blast from the distant past given the outbreak of the Russia-Ukraine war. The euro area economy is heavily exposed to a stronger and longer-lasting energy shock, reflecting its large dependence on Russian energy imports. As a result, the euro area is set to bear the brunt of the economic shock caused by the Russian aggression of Ukraine.
The first batch of March soft indicators shows a large hit to consumer sentiment from the war. The euro area consumer confidence index dropped sharply, broadly matching the decline recorded during the pandemic-related shock in early 2020 (figure 5). In addition to concerns about the future economic situation following the start of Russian aggression, soaring inflation and the related squeeze on purchasing power likely weighed on consumer confidence, clouding the outlook for household consumption.

Meanwhile, business sentiment has so far proved more resilient to the outbreak of the war in Ukraine. In March, the composite euro area PMI index eased moderately to 54.9, still comfortably above the 50-point mark separating growth from contraction. However, the details of the March print point to a notable deterioration in firms’ expectations, both in services and manufacturing. In addition, exports orders also fell sharply in the manufacturing sector, indicating lower output in the months ahead.
Consistent with the deterioration in sentiment indicators, we have downgraded our outlook for euro area real GDP growth in the second and third quarter. The recovery in the euro area is now expected to come to a standstill due to negative spillovers from the war in Ukraine and while not our baseline, we cannot rule out a technical recession. Higher (energy) prices will weigh on real income and thus dampen household consumption, while softer business confidence is likely to weigh on investment demand. On the other hand, high levels of excess household savings and fiscal measures adopted to mitigate the impact of elevated energy prices will cushion the adverse shock.
Overall, our outlook for growth in the euro area has become notably less constructive than it seemed just a few months ago. We have again lowered our real GDP forecast to 2.3% (from 2.7% previously) for 2022, while also downgrading our 2023 forecast from 2.1% to 1.4%. However, the uncertainty around the outlook remains elevated, as the evolution of economic activity remains highly dependent on future geopolitical developments. A major downside risk to our outlook represents a disruption in Russian gas supplies to Europe leading to widespread gas rationing.
US: solid economic activity
In contrast to Europe, the US economy is less likely to be materially affected by the Russia-Ukraine war. Thanks to its large home-grown shale oil and gas sectors, the US is no longer a significant net importer of energy, meaning it is less exposed to sharp spikes in energy prices. On the aggregate level, the negative effect on household consumption from higher energy prices is largely offset by the positive effect of increased activity in its domestic energy sector. The rise in energy costs is thus acting primarily as a wealth transfer from the domestic consumers to the domestic energy sector.
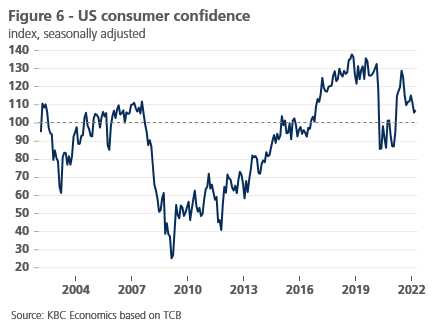
The first-quarter incoming data point to continued solid economic activity, supported by robust consumer spending. In March, US consumer confidence surprisingly edged up, as solid employment growth offset households’ near-term concerns about elevated inflation (figure 6). Furthermore, a negative real income shock is set to be cushioned by strong household balance sheets and excess savings built up during the pandemic, keeping consumer spending relatively resilient.
Moreover, the March business sentiment readings also provide an encouraging picture about the underlying growth dynamics. After three consecutive months of a decline, the ISM services index strengthened to 58.3, likely reflecting lower infection risks from Omicron that weighed on services sentiment at the turn of the year. Meanwhile, the ISM manufacturing index softened but remained well above the 50-point mark, indicating continued expansion. So far, there is no indication that Russia’s invasion of Ukraine (e.g. via increased supply chain frictions) has dampened activity.
A rapid tightening of the labour market also points to resilience in domestic activity. The US economy added 431,000 new jobs in March, only a touch below consensus expectations. Strong employment growth has pushed the unemployment rate down from 3.8% to 3.6%, despite another solid increase in labour force participation (rising to a post-lockdown high of 62.4%). In fact, the unemployment rate has now dropped effectively to pre-pandemic levels and is just a tenth percentage point above the median year-end projection from the FOMC’s March projections.
Looking ahead, we nonetheless see room for some moderation in growth dynamics, given real income losses for households from elevated inflation and our updated outlook for a more restrictive Fed monetary policy (and tighter financing conditions). The latter will cool down the US economy with some lag though, implying that a slowdown in domestic demand will push the overall growth below its long-term trend next year. As a result, we have maintained our forecast for 2022 real GDP growth at 3.1% but marked down our 2023 GDP growth forecast from 2.3% to 1.9%.
China: Omicron deteriorates growth outlook
As predicted at the start of the year, China’s strict zero-covid policy has collided with the highly transmissible Omicron variant, leading to a deterioration in the outlook for Chinese GDP growth in recent weeks. The government has responded to a surge in cases since mid-March by implementing strict lockdowns in a number of cities, most notably in Shanghai. These lockdowns have disrupted economic activity on both the production and consumption side as factories and businesses have been shut or subject to severe restrictions (e.g., the “closed-loop” system for workers) and residents have been confined to their homes. The lockdowns are also putting further pressure on global supply chains via delays at the port of Shanghai and other disruptions to shipping logistics within China (due to the closure of factories and warehouses, limited trucking availability, and the closure of exit/entry points for certain cities).
Reflecting these developments, sentiment indicators weakened across the board, with the Markit services PMI tumbling from 50.2 in February (signalling moderate expansion) to only 42.0 in March (signalling a sharp contraction). The Markit manufacturing PMI also fell in March from 50.4 to 48.1. As such, GDP growth in the first quarter was likely much lower than suggested by February’s high frequency indicators, which in themselves were mixed; from January to February, e.g., industrial production growth accelerated to 7.5% year-over-year (from 4.3% year-over-year previously) while export growth eased from 20.9% year-over-year to 16.3% year-over-year.
Policymakers have announced various measures to offset the domestic impact of the lockdowns, such as tax relief and the promise of further monetary policy support (cuts to the Reserve Requirement Ratio and Prime Loan Rate are likely). However, it will be difficult to manufacture a swift rebound in activity given problems still weighing on the real estate sector (real estate prices declined again in February by 0.1% month-over-month in the primary market and 0.3% month-over-month in the secondary market). It therefore becomes even more difficult for the authorities to reach the 5.5% GDP growth target this year, and we have downgraded our growth outlook to 4.8% for 2022 from 5.0% previously.
Monetary policy: more complicated policy normalisation
Against accelerating inflation pressures, major central banks have generally adopted more hawkish stances in recent months (figure 7). The central banks are nonetheless facing an increasingly difficult and uncertain economic backdrop amid Russian aggression in Ukraine. As the war and the resulting energy shock are set to strengthen inflationary pressures and lower economic growth, the path of policy normalisation has become more complicated in recent weeks, in particular in the euro area.

We nonetheless believe that the ECB’s step-by-step monetary policy normalisation remains on track and may be even accelerated, despite negative spillovers from the war in Ukraine. As sentiment within the Governing Council has turned more hawkish recently, the central bank is more concerned about the Russia-Ukraine war’s impact on already elevated prices than on underlying growth dynamics. Against this backdrop, the ECB decided at its March meeting to bring forward the end of net asset purchases. The Asset Purchases Programme (APP) will now amount to EUR 40 billion in April, EUR 30 billion in May and EUR 20 billion in June. The possibility to extend purchases into the third quarter of 2022 has little chance of materialising, in our view, if only because headline inflation has already surpassed expectations made in the new ECB staff projections.
In line with current official ECB guidance, we believe that the end of the net purchases in the second quarter will pave the way for a first 25 bps rate hike in September. This will be followed up by two more 25 bps hikes in the remainder of 2022 and a further tightening in the course of 2023. We forecast the ECB deposit rate to peak at 1.00% in 2023. However, the risks are heavily tilted towards both a faster and sharper policy tightening, as the ECB March meeting minutes suggested hawks are ever more vocal and becoming highly influential.
Meanwhile, the Fed has already started its policy normalisation which is expected to be delivered at a significantly faster pace than the ECB. As widely expected, the Fed increased its key rate by 25 bps to a range between 0.25-0.50%, commencing its tightening cycle and signalling a more hawkish reaction function. The revised FOMC dot plot shifted much higher towards a faster-rising fed funds rate, with the median rate path now implying seven rate hikes in 2022 and four more by end-2023. Interestingly, FOMC members now assume the terminal Fed funds rate at 2.8% next year, which is moderately above the updated estimate of the neutral rate (down to 2.4% from 2.5% previously).
In line with the Fed’s hawkish guidance, and in the view of sticky inflation and a rapidly tightening labour market, we have revised our Fed call towards a more front-loaded hiking cycle. The March FOMC minutes have reinforced our expectations that conditions are in place for 50 bps hikes at the upcoming May, June and July policy meetings, followed by additional 25 bps hikes thereafter. This places the peak range for the current tightening cycle at 3.00-3.25% early next year.
In addition, the March FOMC meeting minutes offered a sneak peek at the balance sheet runoff which is expected to begin as early as May. The Fed intends to pare down its bond holdings at a pace of USD 95 billion per month (USD 60 billion in governments bonds and USD 35 billion in mortgage-backed securities) with a three-month break-in period. The natural roll-off of bonds will be topped-up by active T-bill sales whenever the monthly target has not been reached. Once the process is up and running, the Fed will consider actively selling from its mortgage-backed securities portfolio, wishing to hold a portfolio of US Treasury bonds exclusively.
All historical quotes/prices, statistics and charts are up to date, through April 11, 2022, unless otherwise noted. The positions and forecasts provided are those of April 11, 2022.