

Belgian households' savings in focus

Read the article below or click here to open the PDF.

The savings rate, together with the evolution of real disposable household income, is an important determinant of real private consumption, which in turn is an important component (in most countries the largest) of real gross domestic product (GDP). One factor reflects the saving behaviour of households, the other their purchasing power. If real consumption growth is stronger than real income growth, which was the case in Belgium in 2024 and 2025, this implies a decline in the savings rate. In this respect, the macroeconomic savings rate is an important concept in the analysis of the business cycle. However, a good understanding of the savings rate is crucial. The savings rate is still often mistaken as a 'financial' savings rate that indicates the part of the disposable income with which financial capital is built up. However, the National Accounts use a broad definition of savings, including savings invested in financial assets as well as household investment in fixed assets (typically new construction and renovation of housing). In this research report, we provide clarity and derive a financial savings rate from the overall savings rate. For both, we show the development over the past decades and place the Belgian figures in a European perspective.
Belgians no longer savings champions
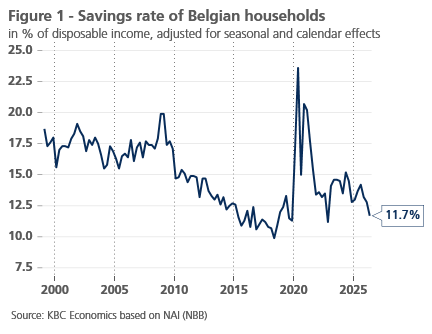
The National Accounts Institute (NAI) recently published the savings rate of Belgian households for Q2 2026. This is the so-called 'gross savings rate', expressed as a percentage of the gross disposable income of households (see the box at the bottom of this article for a brief technical explanation). Adjusted for seasonal and calendar effects, the savings rate declined further in the second quarter to 11.7%, coming from 12.8% in the first quarter of 2026 and 13.2% and 14.2% in the fourth and third quarters of 2025 respectively. This brings the figure close to previous lows (in Q4 2019 and Q4 2022), but is still well above the historic low (9.9%) reached by the savings rate in Q2 2018 (see figure 1).
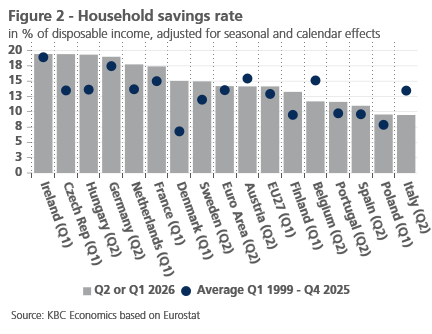
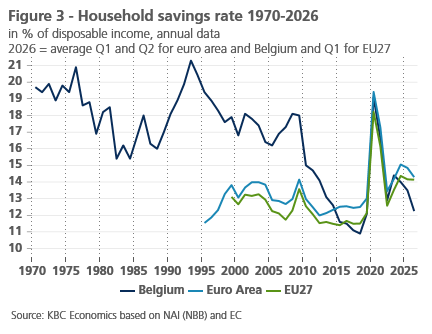
Eurostat also recently published a first release of the Q2 2026 savings rate in the eurozone as a whole and in a number of EU member states. At 11.7%, the Belgian figure was well below that in the eurozone (14.2%) and the three large neighbouring countries (19.0% in Germany, 17.7% in the Netherlands and 17.4% in France; for the latter two there is no Q2 figure yet and it is the Q1 figure) (see figure 2). It illustrates once again that Belgians are no longer the notorious savers they once were. Annual figures of the savings rate of Belgian households over a longer period show a downward trend. In addition, the level of the ratio has fallen below that in the eurozone and the EU27 over the past decade (see figure 3). In the short term, the savings rate has shown a variable course since the early 1970s, with sometimes considerable fluctuations.
A multitude of determinants
Household saving is the result of a complex interplay of economic, psychological and demographic factors. Depending on the circumstances, other explanations for saving often apply. For example, the savings rate of Belgian households peaked at 23.6% during the pandemic in Q2 2020, coming from 11.3% in Q4 2019 (see figure 1). This was because households were severely curtailed in their ability to consume as a result of lockdown measures, they were more cautious and spontaneously avoided shops, and because they also kept their finger on the purse strings as a precaution. The evolution of the savings rate during that crisis was rather atypical and illustrates that in the short term the rate is often strongly influenced by specific events or the cyclical situation, and the related confidence of households in the near or more distant future.
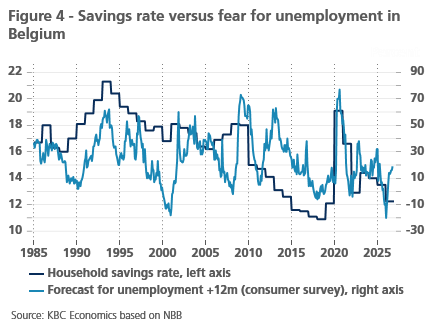
In periods of high economic uncertainty, in particular with regard to the situation on the labour market, households tend to strengthen their 'precautionary savings' (i.e. building up a financial buffer against setbacks). This relationship is illustrated by the consumer confidence indicator, more specifically the component that gauges expectations of the evolution of unemployment for the coming year (see figure 4). When people fear for their jobs, or actually become unemployed, the savings rate often rebounds, and vice versa. This is especially true in times of serious crisis. This was the case during the pandemic, but also, for example, during the EMS currency crisis of 1992-1993 and the banking crisis and Great Recession of 2008-2009, when the unemployment outlook deteriorated each time. Note that the relationship is far from perfect, with sometimes striking contrasts. For example, the savings rate continued to decline during the sovereign debt crisis in the eurozone in 2012-2013, although fears of unemployment also increased then.
Structural factors
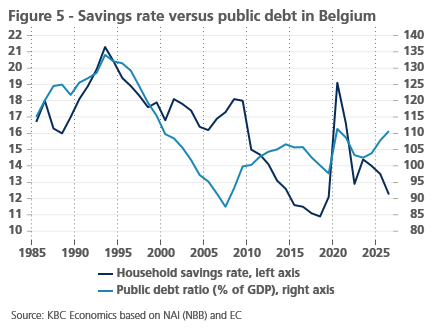
Apart from the role of specific events or the cyclical situation, in the somewhat longer term, more structural factors usually play a role in determining the savings rate. In the past, for example, it has been suggested that the dynamics of public finances, more specifically the debt ratio, help determine the development of the savings rate. According to the so-called 'Ricardian Equivalence Theorem', rational households anticipate a decrease in their future income in the event of an ongoing debt increase, assuming that the government will have to raise taxes in order to repay the debt. For this reason, households would cut back on spending and increase their savings at an earlier stage. Conversely, if debt is reduced sustainably, households expect a reduction in the tax burden over time, anticipate higher future incomes and the savings rate would therefore already be falling. Figure 5 shows that the theorem may have played a role in the period 1985-2000, but afterwards the relationship between the savings rate and the debt ratio was often even reversed.
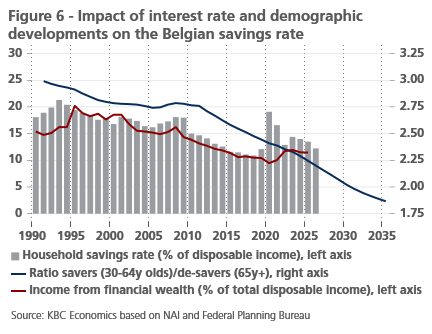
In recent decades, interest rate developments in particular have played a more visible role in determining the savings rate. For example, the sharp fall in interest rates until the pandemic eroded the income that households derive from their assets. Since households mainly save income from financial investments, while income from labour is largely consumed, this led to a downward trend in the macroeconomic savings rate (see figure 6). Because the financial wealth of households in Belgium is relatively high from an international perspective, the decline in wealth income had a relatively large impact on the savings rate. With the interest rates that have since risen again, income from financial wealth has also increased somewhat. This helps to explain why the Belgian savings rate has been slightly higher on average in recent years than in the pre-pandemic period.
Role of demography
Demographics also cloud the picture. The savings rate varies by age cohort and so changes in the age structure of the population can affect the macroeconomic savings rate. More precisely, the savings rate has a hump-shaped age profile and is higher for 30-64 year olds than for young people and pensioners. Forward-looking citizens build up assets during their working years (saving), which are then used during their retirement (de-saving). It is 'life-cycle savings', which aims to weaken fluctuations in consumption and prevents a fluctuating standard of living during a person's lifetime. Due to the ageing of the population, the ratio between the number of savers (the population aged 30+ up to retirement age) and the number of de-savers (pensioners) has systematically decreased in recent decades. This also contributed to the structurally declining savings rate at the macro level, which is likely to continue in the coming years (see figure 6).
In addition to the age structure of the population, other demographic or social factors can also influence the macroeconomic savings rate (higher life expectancy, smaller households, more single people,...). This often involves gradual behavioural changes in households or the wider population. In contrast to older generations, who still attach great importance to saving as a precaution for 'bad times' or to leave an inheritance to (grand)children (the 'bequest motive'), more recently retirees, for example, have less difficulty eating into their assets and thus maintaining their former standard of living. Changing behaviour (e.g. in terms of mobility) can also influence 'goal-based savings' (e.g. for the purchase of a private car).
Financial savings rate
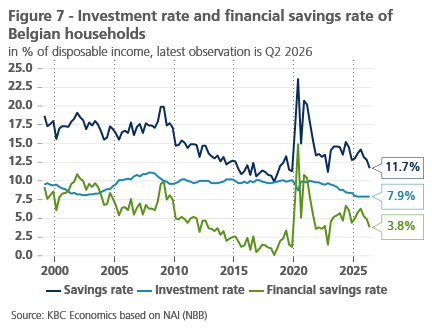
The savings rate is not in itself a good measure of the extent to which households build up financial assets. Indeed, household savings, as measured in the National Accounts, can be spent on two main categories (see box at the bottom of this article): they can be used to build up financial assets or reduce debt, and to invest in fixed assets (mainly new construction and renovation of housing). In order to obtain a financial savings rate, we must therefore deduct household investments in fixed assets from their savings. In other words, the financial savings rate of households is equal to their overall savings rate minus their investment rate. The latter is then defined as the investments of households in fixed assets expressed as a percentage of their disposable income.
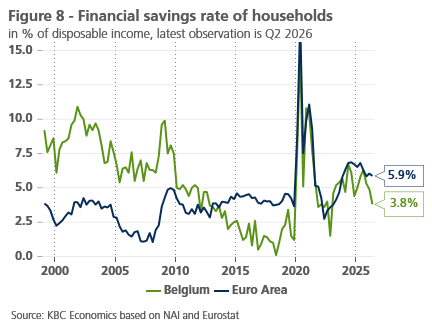
Figure 7 shows the evolution of the investment and financial savings rate of Belgian households since 1999. The declining trend in the general savings rate until the pandemic was entirely due to a decline in household financial savings. As explained above, the decrease in income from financial wealth, due to the fall in interest rates, was partly responsible for this at the time. At the beginning of 2018, the financial savings rate was even zero. The rise in interest rates in recent years has caused income from assets, and consequently financial savings, to rebound. On the other hand, Belgian households have recently invested less in fixed assets, more specifically in residential buildings (new construction and renovation). This caused their investment ratio to fall from an average of almost 10% in 2021 to 7.9% in Q2 2026. Until 2012, the financial savings rate of Belgian households was (well) above that of households in the euro area as a whole or EU27, but since then it has often been (slightly) below. In Q2 2026 (the latest figure available) the rate was 3.8% in Belgium compared to 5.9% in the euro area (see figure 8; in the EU27 it was 6.0% in Q1 2026).
Box – The savings rate briefly explained
The savings rate is a technical concept from the National Accounts and is defined as the ratio between household savings (i.e. the unconsumed part of disposable income) and their disposable income (the latter adjusted for changes in households' rights to pension funds). The concepts of saving and income can be expressed in net or gross terms, depending on whether or not they are measured to deduct the depreciation of the capital stock of households. This capital stock consists mainly of the construction or renovation of dwellings carried out by households. When, as in this research report, the savings rate is mentioned, the gross savings rate is usually meant.
Household savings are measured before their investment expenditure is taken into account. In the National Accounts, savings are considered as a means of financing household investments in 'fixed assets' (mainly new construction and renovation of housing). Only after the investment expenditure of households (as well as other more marginal capital expenditure) has been deducted is the financing capacity of households measured. The latter is the ability of households to build up financial assets and/or reduce the financial obligations they have entered into.
Defined in this way, household savings can be spent on two main categories: it can be used to build up financial assets (or reduce debt) on the one hand, and to invest in fixed assets (construction and renovation of housing) on the other. This implies that the savings ratio is not in itself a measure of the extent to which households build up financial assets. After all, in order to obtain financial savings, we have to deduct households' investments in fixed assets from their savings. The 'financial savings ratio' is then the part of disposable income that is not consumed or invested (and is therefore used to build financial assets) expressed as a percentage of disposable income. The overall savings rate then forms the sum of the 'financial savings rate' and the 'investment rate' of households.
Source: KBC Economics based on NAI (National Accounts Institute)