

Valuation differences in EU housing markets remain large

Click here to open PDF

After Eurostat earlier published Q1 2026 house price figures, the ECB recently also released its valuation metrics for housing markets in the 27 EU countries for the same quarter. According to the average of the four metrics calculated by the central bank, price cooling has reduced the overvaluation of the EU housing market since autumn 2022. But with price dynamics picking up once more, overvaluation in the EU has increased again since the beginning of 2024 to 13% in Q1 2026. Large differences remain between member states, both in terms of the level and the development of the valuation. In countries where the cooling turned into a sharp price correction (especially Luxembourg, Germany, Sweden and Austria), overvaluation fell sharply. In Luxembourg, overvaluation nevertheless remained high as of Q1 2026, but in the three other countries mentioned, it fell back below 10%. In countries that did not experience a cooling and where prices have continued to rise strongly in recent years (especially Portugal, Greece, Spain, Lithuania, Croatia, Bulgaria and Hungary), overvaluation in the housing market increased (sometimes substantially). In Belgium, where the cooling has remained relatively mild, overvaluation fell somewhat and the average of the four ECB metrics was 9% in Q1 2026. However, according to one of those metrics, an econometric model, the Belgian market is more or less correctly valued.
ECB valuation metrics
The ECB calculates four metrics of over- or undervaluation. Two of them concern the simple statistical price-to-income and price-to-rent ratios. The first relates the evolution of house prices to that of household income. The most recent value of that ratio is then compared with its long-term average, which is assumed to correspond to an equilibrium level. If the ratio rises too sharply above its long-term average, it is an indication that households' capacity to finance the purchase of a home is compromised and house prices have overshot. The second ratio relates the evolution of house prices to that of rents. In the longer term, the two should run in parallel. After all, when house prices rise more than rents, renting becomes relatively attractive, and vice versa. Again, the most recent value of the ratio is compared with its long-term average, and a deviation indicates an over- or undervaluation.
The other two valuation metrics are model based. One takes the asset price approach and looks at the movement of the price-to-rent ratio relative to long-term interest rates. This involves benchmarking the return on a property investment (approximated by the inverse of the price-to-rent) against that of an alternative investment opportunity, specifically in a 10-year government bond. In the second modelling approach (hereafter referred to as 'econometric model'), house prices are regressed on household income, interest rates, population and housing stock. The extent to which the effective house price at a given point in time deviates from the equilibrium value estimated by the regression (i.e. the error term in the regression equation) is taken as a measure of over- or undervaluation. The specification of the regression equation as well as the variables used do vary across EU countries and depend in part on data availability.
Large differences between EU countries
Figure 1 ranks the 27 EU countries by the state of their housing markets, from most overvalued to most undervalued, as reflected in the average of the four ECB metrics. Of the four metrics, the ECB only publishes the measure that is based on an econometric model. This is the most comprehensive and is represented in figure 1 by a black asterisk. Besides the average and the econometric model-based quantification, the ECB does publish the minimum and maximum of the four metrics, which correspond to the lowest and highest quantification, respectively (the blue and pink dots in figure 1).
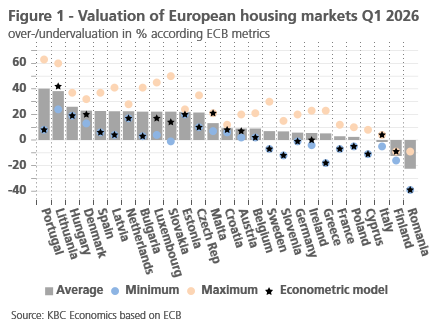
If we consider the average of the four ECB metrics, it appears that there are still large valuation differences between member states. In 12 out of the 27 countries, the housing market was overvalued by more than 20% in Q1 2026. In 4 countries, the overvaluation was minimal (less than 5%) or absent (around 0%) and in 2 countries, the housing market was even undervalued. Portugal (+40%) and Lithuania (+38%) are the two EU countries with the highest overvaluations in Q1 2026. At the other extreme, the housing markets in Finland (-13%) and Romania (-23%) are quite undervalued. The ECB does not publish valuation figures for the EU housing market as a whole. An (unweighted) average of the 27 member states shows that the overvaluation across the EU (based on the average of the four metrics) fell from a peak of 12% in early 2022 to below 8% in 2023 due to price cooling but then rebounded to 13% in Q1 2026.
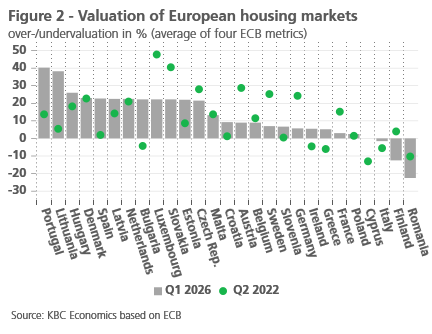
Figure 2 compares the most recent value (Q1 2026) for the average of the four ECB metrics with that just before the start of the cooling-off period (Q2 2022). In a number of countries with strong cooling, or even price correction, in the housing market, including Luxembourg, Germany, Sweden and Austria in particular, overvaluation fell sharply. In Luxembourg, however, the overvaluation remains quite high at 22%. In other countries that did not experience a cooling and where prices continued to rise strongly (Portugal, Lithuania, Greece, Spain, Croatia, Bulgaria and Hungary), overvaluation in the housing market increased (sometimes sharply) over the period under review. Country-specific factors also played a role in this, such as increased investor interest in Bulgarian real estate due to the country's entry into the eurozone. The Finnish situation also stands out. Although the housing market was not substantially overvalued before the cooling-off period, there was a strong price correction in Finland, which has now made the market cheap.
Another finding in figure 1 is that for most EU countries, there are often large differences between the four ECB valuation approaches. This indicates that there is a great deal of uncertainty associated with the calculations of over- or undervaluation and that they should therefore be interpreted with caution. In Slovakia, Portugal, Greece and Luxembourg, the difference between the highest (maximum) and lowest (minimum) valuation rate is as much as 40 percentage points or more. For 17 countries, the valuation estimated by the econometric model corresponds to the lowest (minimum) valuation. According to this most comprehensive valuation approach, the housing market would be overvalued by 20% or more in far fewer countries (only 4 instead of 12 out of 27) (i.e. Denmark +20%, Estonia +20%, Malta +21% and Lithuania +42%).
Belgian housing market
According to the average of the four ECB metrics, the Belgian housing market was still overvalued by 9% in Q1 2026. Just before the start of the cooling-off period (Q2 2022), which was relatively mild in Belgium, overvaluation was 12% (at the peak in Q2 2020 it was 19%). However, according to the ECB's econometric model, the Belgian market was correctly valued at the beginning of 2026 (a small overvaluation of 2%). This finding is in line with our own valuation estimate, also based on an econometric model. Similar to the ECB model, the KBC model establishes a mathematical long-term equilibrium relationship between house prices and their fundamentals. However, the KBC model does look over a longer period (1981-2026) and is also somewhat more refined, as changes in real estate taxation over time are taken into account in addition to household income, mortgage interest rates and the number of households. The extent to which the actual price development deviates from the equilibrium value calculated by the model (i.e. the error term in the regression equation) is seen as a measure of overvaluation, as in the ECB model. According to the KBC model, the Belgian market was also close to equilibrium in Q1 2026. Specifically, there was a slight overvaluation of 0.4% that quarter (see figure 3).
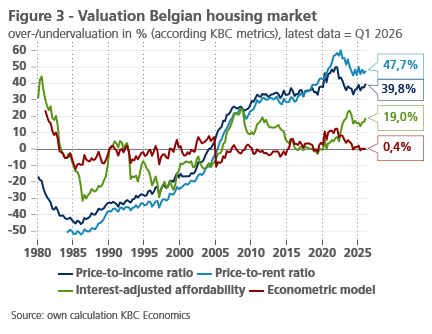
The fact that the overvaluation has been eliminated in this way implies that there is no longer any reason to fear a potentially serious house price correction in Belgium from that angle. This conclusion contrasts sharply with the fact that other metrics, more specifically the classic price-to-income and price-to-rent ratios, do still point to a (solid) overvaluation (see the KBC quantification of these metrics in figure 3). This is because these simple measures are less comprehensive and only relate the development of house prices to that of income or rent. Moreover, the classic statistical valuation ratios suffer from the fact that the result is very sensitive to the choice of the period to calculate the long-term average against which the most recent value is compared. In our own calculation, this is 1980/1984-2026, but should we only consider data since, say, 2000, the calculated overvaluation would be much lower. The ECB considers a much shorter period in its valuation based on both ratios, which explains the lower values (see maximum for Belgium in figure 1).
More specifically, the statistical problem arises that the values of the two classic ratios do not oscillate around their mean (in technical jargon: it is not a 'stationary series'). As a result, their long-term average cannot pass as an equilibrium level. The problem appears to be absent when we correct the price-to-income ratio by also taking mortgage interest rates into account. Indeed, the affordability of real estate not only depends on income but also on the interest rate. The so-called 'interest-adjusted affordability measure' compares the annual annuity that a mortgagee has to pay (both capital repayment and interest) with the income per household (assumed term is 20 years at fixed interest). The more the annuity and income diverge, the more difficult it becomes to finance an owner-occupied home. As with the price-to-income ratio, this extended measure of affordability is expressed as a percentage deviation from its long-term average. Due to the trend of sharply falling interest rates, the overvaluation, calculated in this way, was completely eliminated in the pre-pandemic years. With the rise in interest rates that followed since the spring of 2022, the overvaluation rose again to 23% at the end of 2023, but the cooling of house price dynamics then brought that percentage back to below 20% (see figure 3).
Concluding remarks
In view of the sometimes large differences between the various approaches, the interpretation of the valuation figures must be handled with caution. That is why the ECB takes the average of its four measures to estimate the level of valuation of EU housing markets. In this sense, despite the cooling that has occurred in many countries, and because prices have risen again (sometimes sharply) since then, housing markets in 12 of the 27 Member States were overvalued by 20% or more at the beginning of 2026. In countries where there has been little or no cooling, the overvaluation has even increased (sometimes substantially). This means that some vigilance, at least for some countries, is still justified. On the other hand, according to the broad approach based on an econometric model, the overvaluation problem affects fewer countries.
Although the average of the four ECB measures in Belgium is still just under 10%, the Belgian housing market no longer appears to be overvalued on the basis of the econometric modelling approach. In other words: house prices roughly correspond to what their fundamental determinants dictate. This means that, from that angle, there would no longer be a major risk of price corrections. However, a neutral valuation level does not rule out a price correction: should one or more fundamental factors deteriorate significantly (e.g. a negative income shock and sharply rising interest rates), house prices could still fall via this route. However, according to the KBC baseline scenario for these fundamentals, this is not the case, and nominal house prices are expected to rise by 2.1% and 3.0% in 2026 and 2027, respectively. Given the high headline inflation in 2026, which is likely to be well above 3%, this does imply a decline in 'real house prices' for this year.