
Residential renovations in Belgium: at the current pace we won't make it

- 1. Energy efficiency of the building stock
- 2. Renovation intensity
- 3. Renovation barriers
- 4. Recent indicators
- 5. Concluding remarks
Read the publication below or click here to open the PDF.

Warnings have been issued for some time that the pace at which homes are renovated in Belgium is too slow to meet the European climate target by 2050. If we all want to live CO2 neutral by 2050, the current renovation rate would have to be increased three to four times. In this KBC research report, we discuss the available macro figures on renovation activity of Belgian households. We paint a picture of the energy (in)efficiency of the housing stock and the renovation efforts made during the past two and a half decades. The analysis confirms that, apart from a peak in 2021, renovation intensity stagnated virtually during that period and has even declined somewhat in recent years, despite government incentives. This suggests that there are still a lot of barriers (not only financial ones) standing in the way of housing renovation.
1. Energy efficiency of the building stock
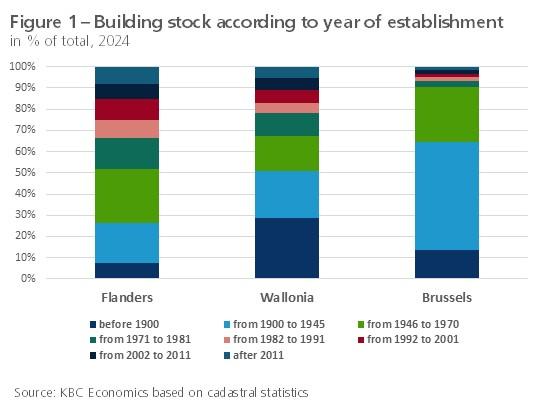
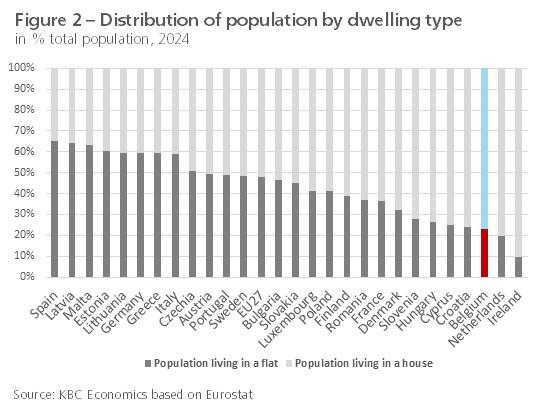
Figure 1 shows the distribution of the building stock in the three Belgian regions according to the year of establishment based on cadastral statistics. The age of buildings varies greatly from region to region, but is generally very old on average. In Flanders, 66% of buildings were erected before 1981. In Wallonia and Brussels, the proportion is as high as 78% and 93% respectively. A large proportion of these have not yet been energetically renovated. Only 8.0%, 5.5% and 1.4% of the buildings in the three respective regions are of fairly recent date, i.e. erected after 2011. Besides the average old age of the housing stock, Belgium also has many more individual, often large and detached houses compared to other European countries, where collective living in an apartment building is more common (see figure 2).
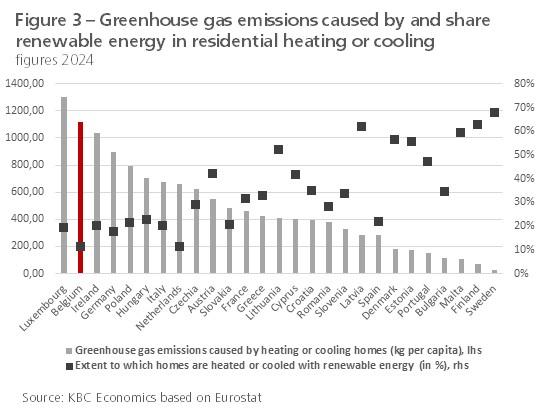
One consequence is that homes in Belgium are among the most energy-hungry in the entire European Union (EU27). Despite improvements in recent years, Belgium is the country within the EU27, after Luxembourg, with the highest per capita greenhouse gas emissions caused by heating or cooling homes (see figure 3). Even when comparing only with EU countries with a similar climate, Belgium does not score well. Belgium's relatively lower performance also applies to the extent to which homes are heated or cooled with renewable energy (solar panels and boilers, heat pumps, geothermal energy, etc.). In Belgium, their share is still only just over 10%, compared to around a quarter in the EU27 as a whole.
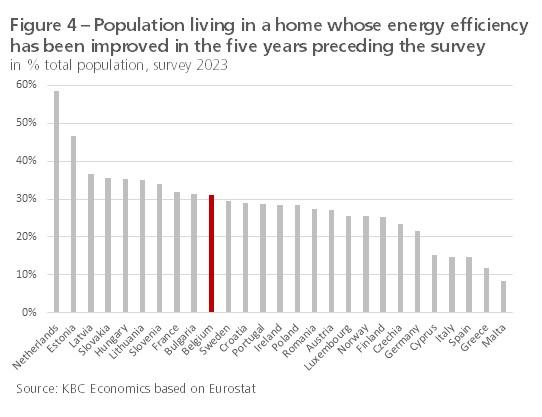
That said, the energy efficiency of homes in Belgium is improving. The rate of improvement is even slightly higher than the EU27 average, reducing the still large gap. For instance, between 2008 and 2024, greenhouse gas emissions from heating or cooling homes fell twice as fast in Belgium (by 659 kg per capita) as in the EU27 average (by 307 kg per capita). Moreover, according to a Eurostat survey, in 2023 31% of Belgians lived in a home whose energy efficiency had been improved in the five years preceding the survey. In the EU27 as a whole, the figure was lower at 25% (see figure 4). The figures do need to be put into perspective. For instance, the fall in emissions was partly due to the replacement of fuel oil with natural gas, which does not offer a long-term sustainable solution. Furthermore, some of the figures from the Eurostat survey probably relate to only limited initial improvements (e.g. loft insulation, installation of solar panels) rather than thorough renovation.
As renovations are often aimed at energy saving, figures on renovation activity are useful to estimate efforts to make the housing stock more energy efficient. Figures 5 and 6 show the renovation intensity of dwellings in Belgium and the three regions since 2000, defined as the ratio between the number of building permits issued to renovate residential buildings, on the one hand, and the number of existing residential buildings and the number of households, respectively, on the other. The figures show that, all in all, renovation intensity has remained fairly stable over the past two and a halve decades. However, the peak during the corona crisis is striking. Many households then decided to set up a renovation project, partly because a number of insulation premiums were increased at that time, which was reflected in a jump in the number of permits granted in 2021.
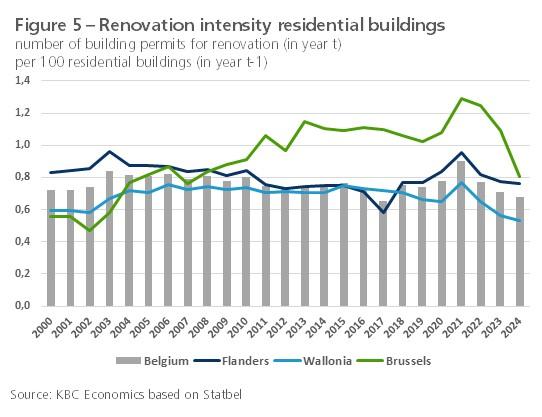
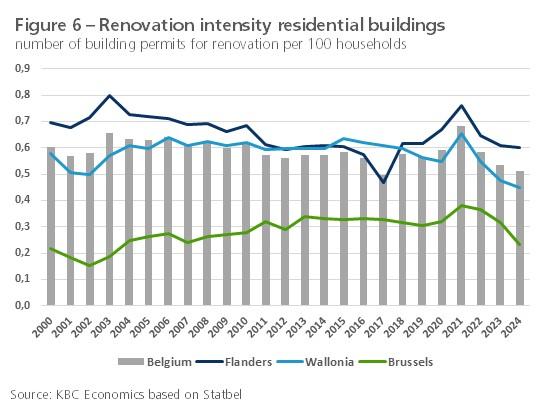
After the pandemic, renovation intensity did fall back considerably. The decline is in line with the robust contraction more generally in household investment in residential buildings (new construction and renovations), as reflected in figures from the National Accounts. A major reason for this is undoubtedly the interest rate shock, which also pushed mortgage rates higher. The decline in renovation intensity occurred in all three regions. Viewed over a longer period, since 2000 renovation intensity in Flanders has on average been somewhat higher than in Wallonia. Moreover, in Wallonia, apart from the pandemic peak, there has been a slight downward trend since 2015. Brussels deviates considerably, which is explained by the fact that households there live relatively more in flats and what we consider a residential building here more often consists of an apartment building with several residential units.
Although indicative, the permit figures do not give a perfect picture regarding the sustainability of the housing stock. On the one hand, not all energy improvements require a permit (e.g. insulation of walls, replacement of windows, installation of solar panels). On the other hand, not every renovation permit concerns a (thorough) renovation of the house. Some renovations are rather done to improve other housing qualities (e.g. extension with a garage). Moreover, as renovation activity progresses over time, the number of dwellings still to be renovated decreases. If we were to define renovation intensity as the number of renovation permits in relation to the number of dwellings still to be renovated (we do not have figures on this), a constant number of renovations actually implies a greater percentage of renovation intensity. Also, renovations today probably involve energy improvements more than in the past. Finally, Statbel only publishes figures on renovation permits for residential buildings. In practice, this may involve the renovation of an apartment building with several residential units.
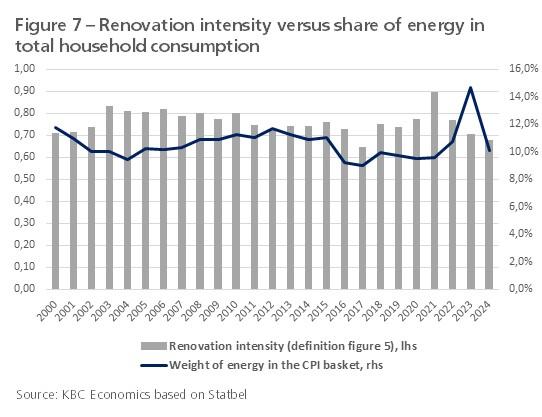
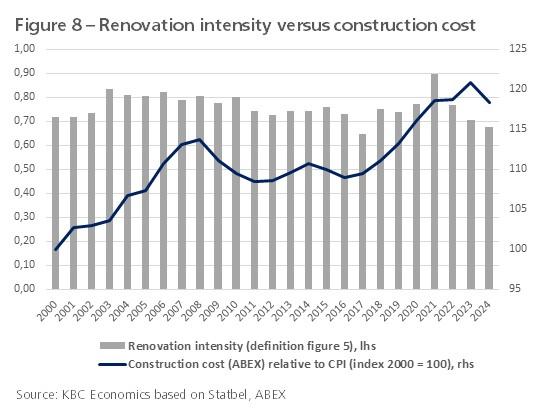
The fact that renovation intensity has not increased, despite government incentives, has to do with countervailing forces and barriers. Reference is often made to more expensive energy that would force households to undertake energy renovations. Energy prices did rise over the past two and a halve decades, but the share of energy in total household consumption remained fairly stable at 10-12% over that period (apart from the spike during the energy crisis, see figure 7). As a result, from a financial perspective, households as a whole probably did not feel the need to renovate sufficiently. On the other hand, construction costs rose sharply, also relatively against general consumer prices (see figure 8). The high renovation cost, combined with stricter sustainability standards and sometimes long (expected) payback periods, constituted a financial barrier to embark on a renovation project. According to research by Essencia in 2019, more than half of those surveyed did not carry out energy-saving works because they could not afford them. Over a third believed that renovating costs more than it brings in.
Households opting for the purchase-renovation combination were also faced with property becoming significantly more expensive. While the prices of energy-underperforming homes have been under pressure in recent years, they have not been everywhere or to the same extent. It is possible that the renovation bonuses generously provided by the government were partly factored into the selling price of the property sold, just like the housing bonus at the time. If so, this would mean that buyers benefited less than intended from the premiums. Although the duty to renovate quickly (which applies in Flanders when buying a non-sustainable house) is met with opposition, its existence still makes sense. Indeed, it puts downward pressure on the price trend of non-sustainable houses, which financially supports a renovation investment.
In addition to financial barriers, technical (e.g. protected building), informational (e.g. lack of knowledge about renovation options and incentives) and organisational barriers (e.g. finding a reliable contractor, temporary relocation and clean-up work) are likely to prevent an acceleration of renovation intensity. Ongoing socio-demographic trends, such as an ageing population and the increasing uncertainty and complexity of households, also undoubtedly play a role in this. For instance, persons of older age, single people and single-parent families - these are groups that are increasing significantly in number - renovate relatively less. Finally, there are barriers related to (inadequate) incentives (e.g. landlords less inclined to renovate because it is mainly the tenant who benefits; having other priorities;...).1
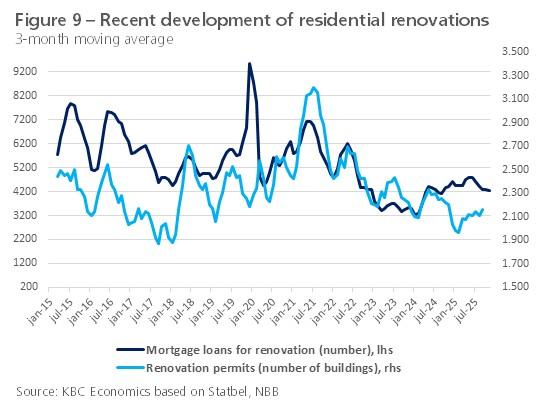
To estimate the most recent trends in residential building renovation, we rely on monthly figures. By the end of 2024, the number of renovation permits issued had fallen to an exceptionally low level. Since then, that number increased somewhat again, although we cannot really speak of a visible recovery (see figure 9). The same applies to the number of mortgage loans for renovation granted by banks. This includes renovation projects both without and with purchase of the house. With regard to the amount of mortgage loans granted for renovation (in EUR, not shown in the figure), there is, however, a clearer recovery, indicating that larger amounts are being borrowed per project.
We should stress that the monthly figures do not give a perfect picture of the extent to which homes in Belgium are effectively being made more sustainable. Indeed, some (more simple) energetic investments (insulation, heat pump, solar panels,...) are possible without planning permission and/or can be financed by an instalment loan (consumer credit) instead of a mortgage loan. Those investments are not included in the figures shown in Figure 9. Febelfin does publish figures on consumer loans for energy-efficient home renovations, but these are only available on an annual basis. In 2024, the number of such loans granted fell to 31,000, coming from a record 61,000 in 2022 and back near the credit figures in 2019-2021.
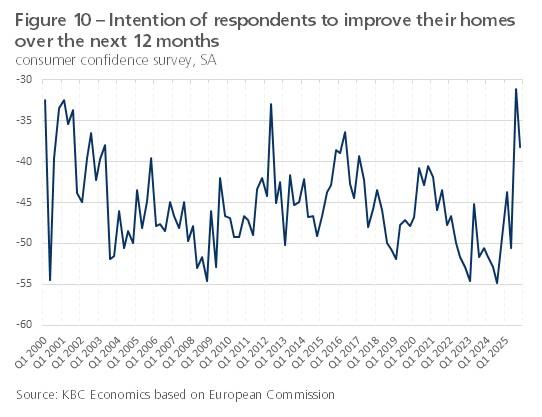
In addition to hard data, there is also information on households' willingness to renovate based on surveys. For example, the European Commission's Consumer Confidence Survey includes a question on the intention of respondents to improve their homes in the next 12 months (see figure 10). Again, in addition to an energy renovation, this could include other improvements to housing quality (new bathroom or kitchen, painting, etc.) and so we need to interpret the figures with caution. This indicator, available on a quarterly basis, did show a very strikingly positive movement in the second half of 2025. A breakdown by age shows that the higher intention to improve the home is mainly among 30-49-year-olds and to a much lesser extent among those over 50.
Europe wants buildings to be climate neutral by 2050. Today they still account for around 40% of energy consumption and over a third of greenhouse gas emissions across the EU. Although substantial efforts have been made in recent years to improve the energy efficiency of buildings, the European target still implies a very heavy effort for Belgium. To be in line with it, some 80% of Belgium's building stock still needs to be addressed. According to Embuild, the professional federation for the building sector, the current renovation rate would have to accelerate three times in Flanders and as much as four times in Wallonia and Brussels in order for all of us to live CO2 neutral by 2050.
The question is whether increasing the pace of energy renovation will be possible in practice. The National Bank of Belgium (NBB) estimated in 2022 the total investment cost to meet the 2050 target at around 350 billion euros. That is an immense amount and it is likely that a portion of Belgian households will never have the required budget to be able to finance a thorough energy renovation, all the more so as mainly households with a relatively low income live in the most energy-wasting buildings. Furthermore, there are doubts whether, at the macro level, the required numbers of skilled construction workers will be available to actually carry out the future renovations. In addition to the heavy financial cost and practical feasibility, the as-yet numerous barriers present (mentioned earlier in this report in terms of technical, informational and organisational issues) also cast doubt on being able to substantially ramp up the pace of renovation quickly.
Apart from the barriers, there is also uncertainty about how renovation activity will interact with the course of some crucial factors. First, these include ongoing socio-demographic trends, such as an ageing population and the further increasing share of single people and single-parent families within households. People over 65 often feel too old to start a thorough energy renovation themselves. Due to their more limited income compared to couples, single people and single-parent families have fewer resources to renovate. Also uncertain but important is the future price trend of fossil fuels. If they do not become much more expensive, this could stop the pace of renovation from accelerating. In any case, the European carbon tax (ETS2), which has been postponed by a year to 2028, will put an additional burden on the energy bill for households that continue to heat their homes with fuel oil or gas. The Federal Planning Bureau calculated the extra bill at 250 to 400 euros a year, but a European adjustment (including by putting more CO2 emission allowances on the market) is likely to make that price rise less abrupt.
The European target necessitates a sustained supportive government policy to make renovation projects as affordable as possible at least for households with relatively lower incomes. More attention should also be paid to removing remaining thresholds. Important here is better knowledge about renovation (what are the possibilities, advantages, costs, premiums, etc.), as well as better guidance during the renovation project. Regarding the latter, more use could be made of collective renovation projects in which households wishing to carry out similar works can participate (e.g. bundling works at neighbourhood level). Such approaches ensure efficient implementation of renovation works and also enable collective applications, such as heat networks. Finally, sufficient flow and liquidity in the housing market is important, as energy renovations are often carried out by the new owners after a house sale.
1 For a more in-depth analysis, see Van den Broek, K. (2019), “Drempels voor
renovatie aan de vraagzijde”, Leuven: Steunpunt Wonen.