
Misery index Belgium peaks

Due to the Russian war against Ukraine and the resulting energy crisis, the European economy is currently undergoing another negative economic shock soon after the pandemic. In all likelihood, most EU countries, including Belgium, will experience a (mild) technical recession sometime in the second half of 2022 to early 2023. Often, such economic downturns are accompanied by increasing ‘imbalances’, either as a cause or a consequence of the crisis. In the energy crisis we are now experiencing, sharply rising inflation is a main cause of the economic malaise. Increased unemployment, a worsening of the current account on the balance of payments and a widening public budget deficit are among the consequences.
The build-up of such economic imbalances cannot last and is best avoided, as it can eventually cause (long-term) damage to the welfare of the population. High inflation implies monetary devaluation and affects the purchasing power of households. Unemployment corresponds to idle labour and thus a loss of economic activity and income. Countries with current account deficits are ‘net spenders’: aggregated across households, businesses and government, they spend more under the form of consumption or investment than national disposable income. Consequently, they live beyond their means and have to borrow abroad. Excessive government deficits, finally, can lead to an unsustainable debt ratio. The adjustments required to reduce an out-of-control debt position are usually substantial, sometimes with serious consequences for the population.
Sum of imbalances
In order to get an overall picture of the extent to which economic imbalances are effectively occurring, we can simply add up inflation (in percent), the unemployment rate (in percent of the labour force), the current account deficit (in percent of GDP) and the deficit in the government budget (in percent of GDP). Thus calculated, this measure is an extension of the so-called Misery Index (the sum of inflation and the unemployment rate), which was put forward in the 1960s by American economist Arthur Okun.
While our misery index is comprehensive, it has limitations and should not simply be viewed as the ultimate measure of ‘economic misery’. In fact, the word ‘misery’ does not quite cover it. A country can have a relatively high GDP per capita and low poverty or inequality, but still have a poor misery index. But the latter then indicates that there are risks behind that prosperity. Moreover, the index, as we calculate it, is macroeconomic in nature (it does not, for example, take into account the impact of the economy on the environment and climate) and also says nothing about the cause of imbalances (public finances may deteriorate, for example, because of an increase in public investment).1
Figure 1 shows the long-term evolution of the broad misery index for Belgium since 1960. The data for the years 2022-2024 represent the latest forecasts by the European Commission (EC) for the four subcomponents of the index. The index peaks in 2022, mainly due to high inflation, but remains well below its peak at the beginning of the 1980s. It is notable that the index will also remain well above its long-term average (13.3%) for the next two years, at least if the EC forecasts come true. This illustrates that, just like following the oil crises of the 1970s, it may take some time for economic imbalances to normalise again.
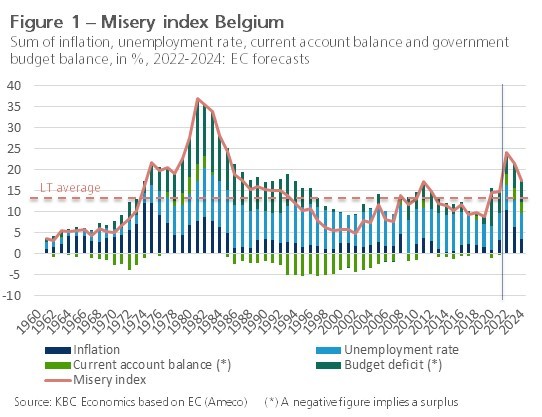
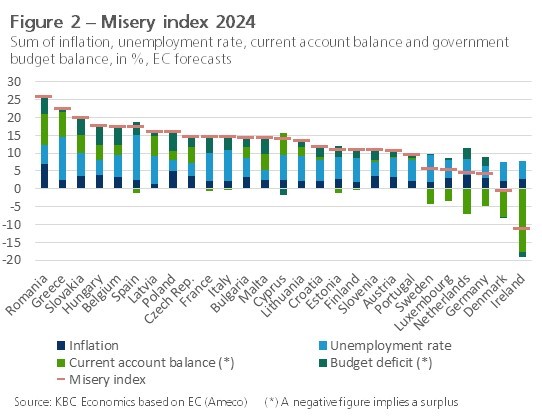
Figure 2 compares the projected misery index for 2024 among the 27 member states of the European Union. Based on the EC's latest forecasts, Belgium will still be among the group of EU countries with the highest index in 2024. Compared to our peers (neighbouring countries the Netherlands, Germany and France), we do not score well either. While in 2022 Belgium ranked 11th in the misery index for the 27 EU countries (ranked from high to low), in 2024 it is expected to be 5th (along with Spain which has the same index value). This suggests that the aftermath of the current crisis, in terms of persistent imbalances, will play somewhat harder in Belgium than in most other EU countries.
1 By the way: a large surplus in the current account or in the government budget may also indicate an imbalance. Note also that the index assumes that each percentage point increase in the four components is equally pernicious (equal weights).