

Economic Perspectives October 2022

Read the full publication below or click here to open the PDF.
- In line with other commodities, gas prices declined by 29% in September to 161 EUR per MWh. The correction in gas prices is not only the result of a global economic slowdown, but also of increased confidence in Europe’s capacity to adapt to high gas prices. Gas reserves are filling rapidly, demand is more elastic than expected and LNG supply is expanding fast. Nonetheless, gas prices are still about 13 times higher than before the pandemic.
- High energy prices continue to drive up European inflation. Headline inflation reached a new high in September, with year-on-year inflation rising from 9.1% in August to 10% in September. Energy prices rose by as much as 40.8% year-on-year. Core inflation also increased, to 4.8% from 4.3% in August, a sign that inflation is becoming more entrenched in the economy. We hence raised our inflation expectations for the eurozone to 8.2% and 5.3% in 2022 and 2023, up from 7.8% and 4.6% respectively.
- In contrast to the EA, US inflation fell for the third month in a row in September and now stands at 8.2% year-on-year, mainly thanks to a decline in energy prices. Core inflation however keeps rising steadily and now already stands at 6.6% year-on-year, up from 6.3% year-on-year in August. Underlying inflation is now mainly driven by rents and other services, which rose 0.8% month-on-month, while it seems that core goods prices have peaked. Given the stickiness of core inflation, we raised our 2022 inflation expectations by 0.1 percentage points to 8.0%.
- Central banks continue to focus their attention on controlling inflation while disregarding growth concerns. The Fed sharply revised its ‘rate guidance’ upward. As a result, we now expect the Fed funds rate to peak at 4.50-4.75% in Q1 2023 and to remain at this level throughout 2023. Double-digit inflation prints are also likely to support the ECB’s monetary cycle. We now expect the ECB deposit rate to peak at 3% in Q1 2023 and to remain at this level throughout 2023. The BoE has also been in the spotlights in September as it had to intervene strongly in the bond market, following the government’s budget announcement. As the generous budget is expected to add to inflationary pressures in the UK, we expect further rate hikes (totaling 200 basis points) by year end, bringing the policy rate to 4.25%.
- The European economy remains under severe pressure as elevated gas prices, high inflation and tighter monetary policy hit growth. Producer confidence indicators have entered recessionary territory, in particular in the gas-dependent German economy. Euro area consumer confidence also hit record lows. We now expect real GDP growth in the euro zone to be 3% in 2022 and to halt to 0% in 2023.
- In the US, the economy is showing signs of resilience. The labour market added 263.000 jobs last month and unemployment declined by 0.2 percentage points to 3.5%. Net exports also surprised to the upside. In later quarters, severe monetary tightening will pull the brakes on the economy, especially in the rapidly weakening housing market. We maintain our 2022 US growth forecast of 1.7%, but have revised our 2023 forecast downwards from 1.0% to 0.6%.
- The Chinese economy is being held back by the zero-covid policy and ongoing problems in the real estate sector. Business confidence deteriorated in most surveys and remains in recession territory. Retail trade also contracted during the summer months. However, the rise in industrial production is a small bright spot. We maintain our outlook for average annual GDP growth of 3.0% in 2022 and a modest recovery to 5.3% growth in 2023.
Heading to a harsh winter season
Many major shocks continue to weigh on the global economy. The European economy is heavily impacted by skyrocketing gas prices, which are driving up costs for energy-intensive businesses and consumers. Although gas prices fell 29% in September, they remain 13 times higher than before the pandemic in late 2019. Rising inflationary pressures and tighter monetary policy will also weigh on European growth in the coming quarters. High gas prices only have a limited impact on the US economy, given its important shale gas sector. Monetary tightening is already starting to bite there. This is most heavily felt in the real estate sector, which is showing increasing signs of weakness. China has its own problems. Persistent zero covid policies and the increasing liquidity problems in the real estate sector weigh on the near-term growth outlook. The global economic picture thus remains gloomy.
Commodity prices fall in September
Commodity prices are often the barometer of the global economy and they were in the red in September. Rising recession fears pushed oil prices to 88.5 USD per Brent barrel at the end of September, well below the peak of 129 USD in March. However, the recent OPEC+ decision to cut production by 2 million barrels again pushed the price of oil back above 90 USD. In the coming months, the oil price is likely to remain elevated as the EU embargo on Russian oil imports will go into effect and the US strategic reserve release might be discontinued next year.
Metal prices also continued to decline in September. The Metals & Minerals index decreased by 6% last month and is now down 31% from its peak in March (see figure 1). The price for lumber, which is widely used in the construction industry, declined by almost 15% in September and is now lower than before the pandemic. Food prices did not decline in a similar fashion. The prime reason for this was the increase of grain prices by 13% in September, which resulted from fears that the intensification of the Ukraine war could have a negative impact on grain shipments out of Odessa.

Europe shows resilience in the face of a Russian gas cut-off
In line with other commodity prices, European gas prices declined by 29% in September to 161 EUR per MWh. The decline in gas prices is partly a result of the slowing global economy. Yet it also reflects European adaptability and resilience in light of Russia’s decision to halt the flow of gas through the Nordstream 1 pipeline. European stock levels have already far surpassed the EU November 80% target and now stand at 88%. They are also expected to cover many days of high gas consumption next winter in the major European economies (e.g. 101 winter days in France and 86 days in Germany).
According to Andurand capital, LNG capacity and African supplies are also rapidly increasing, and could offset more than half of the total Russian supply (of 103 billion m3 in 2021) by 2023.. On the demand side, there is clear evidence that high prices are having a downward impact on gas consumption. Household gas consumption has decreased by more than 5% in H1 2022 versus the 2019-2021 H1 average, according to think tank Bruegel. Further savings are expected in the next quarters as household investments, such as better insulation, solar panels and heat pumps, take time to materialise. Renewable energy capacity is also increasing rapidly. The EU industrial sector is also adapting well and has already switched 35% of its natural gas consumption to oil.
The European resilience does not necessarily mean however that gas prices will continue to fall (see figure 2). Harsh weather conditions could drive prices back up. The European Centre for Medium-Range Weather Forecasts said early indications showed that European weather conditions in November and December could be colder and less windy, increasing demand for gas while reducing renewable capacity. Explosions in the Nordstream 1 gas pipes meanwhile accentuated the risk of major supply disruptions. Increased government interventions which reduce price incentives, such as price caps or tax reductions, could also limit gas savings and drive up prices.

There are also downward price risks. A potential output increase of the Groningen gas field, with its 450 billion m3 estimated reserves, could rapidly drive down prices. According to Shell, there is room to increase yearly output by 50 billion m3 compared to the current flow. EU member states could also loosen restrictions on shale gas exploitation. The quantity of extractable shale gas in Europe is estimated to be around 13.3 trillion m3. However, the extraction of these resources faces stiff local resistance and could complicate Europe’s efforts to tackle global warming.
Euro area inflation reaches a new peak
The recent decline in commodity prices has not eliminated inflationary pressure. On the contrary, euro area inflation rose to 10.0% in September. The rate of increase of all major inflation components accelerated. Price increases for energy products (40.8%) and food (11.8%) remained by far the strongest. Slowly but steadily, core inflation is also picking up further. Core inflation stood at 4.8% in September, a percentage point higher than in May but still 1.8pp lower than in the US (see figure 3). An important driver behind the acceleration in core inflation was the end of the cheap public transport ticket in Germany. Currently, there is little sign of a further acceleration in the underlying trend of core inflation as measured by month-on-month increases. In the coming months, the inflationary impulse from high energy prices should gradually start to fade. This means that the peak of inflation could potentially be in reach. Still, the inflation outlook remains very uncertain as it is unclear how much of the recent energy price shock will eventually be passed through in consumer prices. Moreover, the expected inflation cooling will only be very gradual. We have therefore again raised our forecasts for the average inflation rate for both 2022 and 2023 to 8.2% and 5.3% respectively.

US core inflation still keeps rising quickly
In US headline inflation fell for the third month in a row in September and now stands at 8.2% year-on-year, down from 8.3% last month. Within non-core items, energy prices declined by 2.1% month-on-month. Energy price inflation now reached 19.9% year-on-year, down from a 41.5% peak in June. Food prices increased 0.8% month-on-month however and now reached 11.2% year-on-year.
Still, the main message from the September inflation readings is that core inflation repeated its huge 0.6% month-on-month jump. As a result, core inflation reached 6.6% in September in year-on-year terms, up from 6.3% in August. Within core inflation, goods prices remained stable a month-on-month basis. This has been in large part thanks to used cars and trucks, whose prices declined by 1.1% month-on-month, further evidence of the easing of supply chain constraints. Meanwhile services (including shelter) are now the key driver of core inflation, rising 0.8% month-on-month. Notwithstanding the recent decline in US house prices, shelter prices rose 0.8% month-on-month. Recall that it takes more than a year before house price adjustments pass through to the CPI basket, in case of rents the pass-through is shorter (around 4 months). As house prices and rents rose in the first half of this year, we might still expect that shelter can contribute positively to core inflation readings in the coming months. Shelter aside, other services also rose rapidly. Medical services rose by 1% month-on-month, while transportation services even rose 1.9% month-on-month. Rising nominal wages are likely to be the prime culprit. Average hourly earnings rose by 5.9% year-on-year in September and will likely to keep rising steadily, given continued labor market tightness.
Overall, given the stickiness of core inflation, we raised our 2022 inflation expectations by 0.1 percentage points to 8.0%. In 2023, we expect a negative base effect and rapid monetary tightening to bring inflation down significantly.
Inflation is top of mind in central banks – BoE takes center stage
UK markets unintendedly took center stage in September. A market sell-off in gilts and sterling was triggered by a repricing of UK assets (credit risk) as the new government embarked on an extreme and unfunded growth supportive policy that risks eroding credit metrics of a country already suffering substantial twin deficits. The sell-off is a harbinger that it will become ever more difficult for monetary and fiscal policy to reach a balanced mix to address unacceptably high inflation without doing too much harm to growth and/or unsettling markets.
The Bank of England kept a gradual approach at the September meeting. It raised the policy rate by 50 basis points, pondering the risks of persistent high inflation against an imminent recession. An in-depth assessment of the policy of new Prime Minister Liz Truss and Finance Minister Kwasi Kwarteng was planned for November. However, Kwarteng’s ‘minibudget’ - adding 45 billion GBP of mainly debt-financed stimulus on top of measures already approved to cap energy prices - forced the BoE into action sooner. As sterling tumbled to its lowest level against the dollar since 1985 and the sell-off in LT-gilts pushed the 30-year yield north of 5.0%, the BoE was forced to step in as ‘market maker of last resort’. The Bank committed 65 billion GBP to support long-term gilts. This put the BoE in a difficult position as it had to delay plans to reduce bond holdings acquired during the pandemic (Quantitative Tightening). At the November meeting, the BoE is expected to raise its policy rate by more than 75 basis points. In theory, it should not be a difficult for independent monetary policy to counterbalance (inflationary) fiscal policy. However, with monetary and fiscal policies on a collision course in the current highly uncertain environment, there will likely be more volatility ahead for UK assets, including the pound.
On US and EMU markets, the anti-inflationary rhetoric/dynamics continued unabatedly. Ongoing solid US activity data and (core) inflation showing few signs of abating caused the Fed to sharply revise upward its ‘rate guidance’. A broad majority of Fed governors now supports a scenario of the policy rate reaching a peak near 4.50-4.75% next year. Rates most likely will have to stay high for longer, leaving no room for markets’ hope for Fed rate cuts late next year. The US curve stays inverted, but even yields at longer tenors are nearing the 4.0% barrier. Double digit EMU inflation figures leave moderates and doves within the ECB Governing Council limited arguments to object to the policy rate being raised to a neutral level soon. A peak ECB deposit rate of minimum 3.0% seems all but certain (see figure 4) and is already discounted by markets. Even after a brief correction at the end of September, European swap yields at tenors beyond 5 years easily returned north of 3.0% (with the exception of the 30 year tenor).

On FX markets, the dollar remains unrivalled in strength. The US currency has the better prospect of additional real interest rate support as Fed policy tightening is not hampered by strong recessionary considerations (yet). Persistent safe haven flows also add to dollar strength. The trade-weighted USD index (DXY) at 114+ hit the highest level since 2002 and EUR/USD has settled below parity. Surprisingly, the euro is holding up relatively well against most other major currencies despite the highly uncertain economic outlook for the region. In trade-weighted terms, the single currency has even shown tentative signs of bottoming out since August. As was the case in previous cycles of Fed-tightening combined with rising volatility/uncertainty, the dollar remains the ‘US’s or Fed’s currency and the rest of the world’s problem’. A strong dollar and weak local currency exacerbates the inflationary dynamic in many economies. An ever weaker yen due to divergent monetary policy between the Fed and the Bank of Japan forced Japanese authorities to join an ever growing group of countries digging up currency reserves to fend off currency deprecation. However, USD/JPY holding near the 145/146 intervention level only illustrates that FX interventions buy time, at best. The USD-ascent continues as long as Fed policy makes real USD yields ever more attractive.
Gloom in the euro area
High gas prices, high inflation and tight central bank policy are weighing on the European economy. In the euro area, sentiment indicators deteriorated further. Purchasing managers confidence, as reflected by the PMI’s, fell below the 50 threshold in manufacturing, services and construction, indicating an economic contraction. The economic sentiment indicator compiled by the European Commission fell below its long-term average. Especially consumer confidence, which had improved slightly in August after its steep decline since March 2022, suffered a new blow. It now stands at its lowest level since measurements began in 1985. Consumers are mainly concerned about the overall economic situation and their financial situation. Their employment prospects are also deteriorating, but to a lesser extent. This is probably linked to the development of actual unemployment, which is currently still at historically low levels in the larger euro countries. In some smaller countries, including Belgium, some (still limited) upward pressure on the unemployment rate has emerged.
The deterioration in sentiment is taking place against the backdrop of still rising inflation and a worsening external environment. The war in Ukraine is not at all under control, uncertainty about the further course of the US economy is increasing and the Chinese economy is also struggling. Reduced bottlenecks in supply chains were the only bright spots in this context. A detailed analysis of business confidence shows that their pessimism is mainly driven by negative expectations and less so by recent and current activity.
This divergence is particularly reflected in producer confidence in Germany, as measured by the Ifo indicator. The latter shows that expectations of business development over the next six months are now gloomier than during the financial crisis and close to the pessimism at the time of the pandemic outbreak (figure 5). The German economy’s high gas dependence and large exposure to the global economy are not unrelated to this. The worries about the future triggered the German government to launch a large new support package to reduce the energy bill of households and companies. At 5.2% of GDP, the package would be more than double the sum of the three previous packages. Other countries are also taking measures but these are less far-reaching. Indeed, fiscal clout in most countries is smaller than in Germany.

Because of the further downgrading of expectations, we have downwardly revised our growth forecasts for the fourth quarter of 2022 and the first quarter of 2023. Meanwhile, the economic contraction in the third quarter will likely be somewhat smaller than we expected. These changes result in a slightly higher expected real GDP growth in the euro area for the whole of 2022 (3.0% instead of 2.9%) and a downward revision for 2023, from 0.3% to 0.0%.
US growth is resilient for now
In the US, the labor market added a healthy 263.000 jobs last month and unemployment declined by 0.2 percentage points to 3.5%, showing that the labor market is still very tight. Other data for Q3 growth were mixed. Net exports surprised on the upside and are expected to boost GDP growth by 2.2 percentage points in Q3. Meanwhile retail trade disappointed by only increasing by 0.3% in August, following a 0.4% decline in July. Construction spending also decreased by 0.7% in August. All in all, we maintain our Q3 growth forecast of 2% quarter-on-quarter annualised.
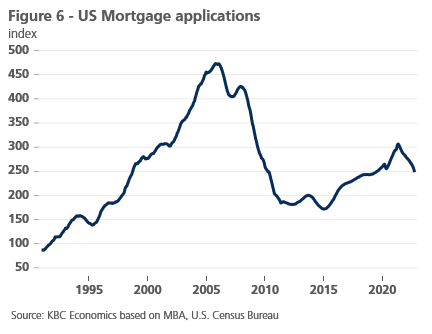
The solid Q3 growth figure is unlikely to be repeated in the following quarters. Consumer confidence indicators recovered slightly in September, but remain very low by historical standards. Producer confidence also remains around 50, close to recessionary territory, for both services and manufacturing. This bodes ill for non-residential investments. The main drag on growth, however, will be the housing market, which is most impacted by monetary tightening. 30 year mortgage rate are rising above 6% and this has weighed on mortgage applications (see figure 6). Housing permits also declined by 10% in August. We therefore revised our Q4 forecast downwards to 0% from -0.4% quarter-on-quarter annualised and our 2023 forecast to 0.6% down from 0.9%.
Zero-covid policy and problems in real estate sector hamper Chinese economy
The Chinese economy likely registered only a sluggish recovery in the third quarter, with economic activity held back by zero-covid and ongoing problems in the real estate sector. Higher frequency data, such as business sentiment indicators, support this view. The Markit manufacturing PMI deteriorated further to 48.1 in September (from 49.5 last month) while the NBS manufacturing PMI improved only modestly to 50.1 (from 49.4). On the services side, the NBS PMI also deteriorated to 50.6 in September (from 52.6 last month). Meanwhile, industrial production did expand month-over-month in both July and August (0.32% and 0.38%, respectively), but retail trade contracted -0.12% and -0.05%, respectively, highlighting the pass-through of extremely weak consumer confidence to economic activity. All-in-all, we keep our outlook unchanged with annual average GDP growth at 3.0% in 2022 before a modest recovery to 5.3% growth in 2023.
All historical quotes/prices, statistics and charts are up-to-date, through Oct. 10, 2022, unless otherwise noted. Positions and forecasts provided are those as of Oct. 10, 2022.