

Economic Perspectives May 2022

Read the full publication below or click here to open the PDF.
- In addition to its human cost, the Russian-Ukrainian war continues to exert upward pressure on energy and general commodity prices. We confirm our baseline view that oil prices are close to their peak and will stay elevated for the coming quarters before only gradually easing again. The ongoing discussion in the EU about an embargo on imports of oil from Russia, with a likely prolonged phase-in time schedule for some Central European countries, adds to the uncertainty. The main risk, however, does not so much stem from the crude oil market itself, but rather from the very tight distillates market. Moreover, the uncertainty surrounding the war in Ukraine first and foremost affects gas and electricity prices. In contrast to the US, which is much more energy self-sufficient, the EU remains, at least for the time being, crucially dependent on imports of Russian gas.
- The inflationary shock originating from commodity prices is broadening its scope in the US and the euro area economy. It is no longer exclusively linked to energy and general commodity prices but is steadily broadening to a wide range of CPI components. The fact that inflation gets more embedded in the economy is also reflected in expectations priced into inflation linked swaps. Although they have not (yet) become fully unanchored, they have reached a new plateau and are pricing in an expected average annual inflation of about 3% in the euro area for the next 10 years, well above the ECB’s 2% target. We expect that US and euro area headline inflation will remain higher-for-longer, with the US probably close to the peak, but that they will gradually decline again towards the central banks’ 2% target in the course of 2023.
- First quarter real GDP growth in the US disappointed. The US economy contracted at an annualised quarter-on-quarter rate of 1.4%, to a large extent due to weak growth of (gross) exports. The weakening global economic environment played a major role, such as the impact of the pandemic on lockdowns in China. The appreciation of the US dollar in trade-weighted terms was also an important driver. For the remainder of 2022 and 2023, we expect that the Fed will be able to engineer a soft landing of US growth dynamics to somewhat below the potential growth rate, without causing a disruptive recession.
- Meanwhile in the euro area, Q1 quarterly growth was weaker than expected too (0.2% quarter-on-quarter), but still positive. Weak data for international trade, industrial production and forward-looking sentiment indicators weighed on Q1 growth, in particular after the Russian invasion started. For Q2 and Q3 2022, we continue to broadly expect a stagnation of economic growth in the euro area. The euro area will remain vulnerable to the economic repercussions of the war in Ukraine, the related commodity price shock, below-potential growth in the US, Covid-related lockdowns in China exacerbating production chain disruptions and the impact of the first steps towards monetary policy normalisation by the ECB.
- Against the background of persistently high and broadening inflationary pressures, central banks are proceeding with their shift towards policy normalisation. This month we upgraded again the expected peak of the current rate cycle in the Czech Republic (to 6%) and Hungary (to 7.50% for the 3 months Bubor). In the US, the Fed delivered the first of an expected series of 50 basis points rate hikes, after it already started its tightening cycle with a 25 basis points hike in March. In addition, Quantitative Tightening is currently being phased in and will amount to 95 bn USD per month. Finally, we expect that the ECB will also join the rate normalisation cycle in July, albeit more gradually, with a first hike of 25 bps. In contrast to the Fed, the expected peak of the ECB rate cycle (2%) will however still be negative in real terms and below what we consider to be a neutral stance for the euro area economy.
The first-quarter GDP data showed economic growth slipped in major advanced economies. Against the expectations of continued expansion, the US economy contracted at a 1.4% annualised pace in the first quarter. In the euro area, real GDP growth came in positive but sluggish at 0.2% quarter-on-quarter, with significant heterogeneity across the member states. Finally, China started the year with a stronger-than-expected GDP gain of 1.3% quarter-on-quarter.
However, the latest GDP figures are merely a look in the rear-view mirror as the economic outlook has been rapidly overtaken by the war in Ukraine. The Russia-Ukraine war has entered the third month, so far without any signs that the conflict will be resolved soon. Although the war remains geographically contained, its economic effects are felt globally. Among major economies, the euro area is most exposed to the negative spillovers from the war, largely reflecting its high reliance on Russian energy imports. By the same token, the US will be relatively less affected given its significant energy independence.
European energy crunch
As already discussed in our previous edition, energy prices are the main transmission channel through which the war in Ukraine will affect key macroeconomic variables, i.e., leading to higher inflation and lower economic growth. Encouragingly, the past month has witnessed some stabilisation in energy prices, with Brent crude oil hovering around 105 US dollar per barrel. On the one hand, the oil price has come under downward pressures from concerns about the strength of China’s oil demand amid severe lockdown measures. On the other hand, the uncertainty surrounding Russian oil supplies continues to support prices, highlighted by the looming risk of an EU embargo on Russian oil imports. Overall, we maintain the outlook for oil prices staying above 100 US dollar per barrel Brent through 2022, with near-term risks now more balanced but still skewed to the upside.
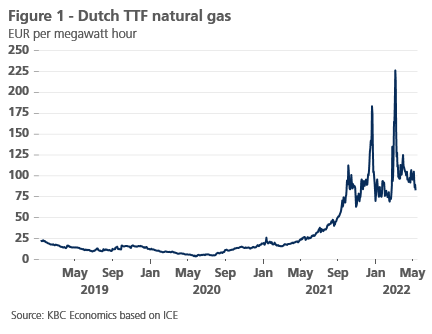
European natural gas prices (Dutch TTF) have also stabilised, although at an elevated level of around 100 EUR/MWh (Figure 1). Russia’s decision to halt natural gas deliveries to Poland and Bulgaria (due to failure to comply with the new payment system in rubles as requested by Russia) has nonetheless sparked concerns about a broader stoppage of gas flows to Europe. Indeed, the situation remains extremely fluid and further disruptions of Russian gas supplies remain the biggest near-term downside risk to our outlook. In an adverse scenario of a sudden halt of gas supplies to Europe, emergency measures to ration gas supplies should be expected, significantly hampering economic growth, sharply driving up energy prices and general inflation and pushing the euro area economy into stagflation.
Supply chains under renewed pressures
In addition, supply chains are coming under renewed pressure given disruptions related to the Russia-Ukraine war and lockdowns in China (also see KBC Research Report of 29 April). With new Covid-19 cases spreading rapidly, the Chinese government has stepped up its zero-tolerance strategy, leading to severe lockdowns in several cities (Figure 2). High-frequency indicators suggest bottlenecks started to build in late-March and will likely become more apparent in the coming months. Given uncertainty related to how long current lockdowns will last and whether new lockdowns in other major cities (such as Beijing) will be introduced, further disruptions to global supply chains remain an important risk.

Importantly, supply disruptions for particular parts can weigh on activity further downstream, as was the case with the global chip shortage and its impact on European automotive industries. The European economies that are most exposed to such disruptions from China (i.e., the economies with companies downstream from Chinese producers) are generally those in Central and Eastern Europe. This makes the lockdown situation in China an additional headwind for some of the European economies that are already most vulnerable to developments related to the war in Ukraine.
Broad-based acceleration of global inflation
Inflationary pressures have been mounting for over a year now, with the recent inflation prints reaching multi-decade highs in both the US and the euro area (Figure 3). This leads to a substantial squeeze in household purchasing power and dampens growth prospects. While the US economy is largely energy self-sufficient, the European economy is facing a marked deterioration of the terms of trade which implies an overall transfer of wealth to net energy-exporting countries. Even more worryingly, price pressures have broadened recently with a noticeable pick-up in core prices (excluding energy and food prices). Furthermore, a strong acceleration in consumer food price inflation is underway, reflecting rapidly rising agriculture prices. The trend of higher food prices is being exacerbated by the war in Ukraine, which is, together with Russia, an important global producer of food commodities.

Our outlook assumes that headline inflation will stay higher for longer and remain above the main central banks’ 2% target until well into 2023, especially in the euro area. Still, the near-term risks remain tilted to the upside in the face of the war in Ukraine and the aggravation of production chain disruptions by lockdowns in China. The severe and persistent inflationary shock in most western economies poses the risk that inflation gets more structurally embedded in the economy, and hence that it will be more difficult for central banks to squeeze it out of the economic system again. Two potential risk channels that need to be closely watched are the evolution of inflation expectations and of wage formation, more specifically of the wage evolution after productivity gains are taken into account (i.e. the unit labour costs). In the US, the inflation expectations priced into the inflation-linked swap market appear still anchored at levels slightly higher than the Fed’s medium-term inflation target of 2%, but they are consistent with their historical track record. However, the US labour market remains tight, with inflationary risks should unit labour costs rise significantly.
On the other hand, in the euro area, the overall state of the labour market is not yet creating a meaningful upward wage pressure. However, the latest wage demands for the steel industry by the influential German trade Union IG Metall of 8.2% for the coming 12 months as a compensation for past inflation highlights the risk that in Europe too, strongly increasing inflation expectations are feeding into the wage formation process. If that risk scenario materialises, it will take longer and more forceful measures by the central banks to get inflation expectation back in line with their inflation target. Those measures would come at higher economic cost in terms of lost GDP growth than in our base scenario.
According to the flash estimate, euro area HICP inflation edged marginally higher to 7.5% yoy in April, in line with the market expectations. Energy inflation has seen a moderate slowdown to 38.0% yoy from 44.4% yoy in March, driven by stabilising energy commodity prices and temporary mitigating measures implemented by some euro area governments. However, easing energy inflation was more than offset by a surprisingly forceful acceleration in core goods and services inflation to 3.5% yoy in April from 2.9% yoy in the previous month, reflecting strong cost-side price pressures. In addition, food inflation maintained a strong upward trend in April, picking up by a more-than-expected 6.4% yoy.
We expect euro inflation to remain close to its current elevated level in the coming months. Energy inflation will continue to dominate price dynamics, potentially acting as an additional source of upside inflation risk. On the other hand, it is possible that governments will step-up efforts to mitigate the effects of high energy prices on households in the course of the year. All in all, we forecast euro area inflation to average 7.3% in 2022, before moderating to a still substantial 4.0% in 2023.
In the US, the current path of inflation remains problematic. Although year-on-year inflation slowed in April thanks to statistical base effects, the month-on-month rise in core inflation accelerated to 0.6% month-on-month, beating the most bullish expectations on the market.
There are a few noteworthy developments within the April data. The increase in core inflation mainly came from three categories: housing (driven by rents), transportation commodities (driven by new car prices as used car prices declined), and transportation services. The latter was driven by a big upward swing in airline prices (up 18.6% month-on-month), which might be a reaction to rising jet-fuel prices. Overall, however, the April inflation readings showed more persistence in the core services sector, which will make core inflation figures even more sticky going forward. Hence, this is another clear signal for the Fed to bring its rate above the neutral level quickly.
Regarding the inflation outlook, we revised up inflation averages for 2022 and 2023. We believe that March marked the inflation peak in year-on-year terms, even after the troubling April’s figures. However, significantly higher-than-expected core inflation would inevitably lead to more upward adjustments of the inflation trajectory. Clearly, the outcome of April core inflation implies that inflation will decelerate more gradually in year-on-year terms – especially in the rest of this year and at the beginning of 2023.
Monetary policy acknowledging persistent inflation
To avoid a persistent stagflation scenario, all major central banks are, to varying degrees, shifting towards policy normalisation. This policy change follows a prolonged period during which steadily rising inflation was generally considered as ‘transitory’, purely the result of post-pandemic reopening bottlenecks, and therefore not requiring any monetary policy response. As inflation persisted longer than expected and continued to increase, central banks abandoned this consensus view one after the other. The Russian invasion of Ukraine and the commodity price shock it caused, with no quick ending in sight, convinced ultimately also the ECB to change views.
There remain however some policy differences among the major western central banks. On the one hand, the Fed now wants to contain inflationary pressure at all costs. It phased out its Quantitative Easing Programme in March 2022 and raised it policy rate already twice by 75 basis points in total from its near-zero starting point. We confirm our view that the Fed will continue to raise its policy rate in the upcoming policy meetings by 50 basis points each to reach a rate of 2.875% (mid-range) by the end of 2022. After one more rate hike of 25 basis points in Q1 2023, the Fed is likely to reach the peak in this tightening cycle, moderately above what the Fed itself considers a neutral longer-term rate (about 2.4% in its latest ‘dot plot’ projections of March 2022). In addition to this rate normalisation, the Fed is currently phasing in the unwinding of its previous asset purchases. At full speed, the Fed will wind down US Treasuries and Mortgage-Backed Securities at a speed of respectively 60 and 35 billion US dollars per month. This Quantitative Tightening will significantly contribute to a higher trajectory of US bond yields and to slowing US growth and inflation.
On the other hand, the ECB has been more hesitant to address inflationary pressures. However, the ECB now appears to take its turn too, but at a much more cautious pace than the Fed. In contrast to the US, the wage evolution in the euro area has (so far) been much more muted, although very recently, trade unions start demanding at least partial inflation compensations. It is true that these demands are, for the time being, backward-looking inflation adjustments, but the risk that higher inflation expectations get entrenched in the wage formation process is not negligeable. This can, for example, be seen in the 10-year average inflation expectations for the euro area that are priced into inflation linked swaps. After they had pointed for many years to an inflation rate that was well below the ECB’s 2% inflation target, they have shifted significantly upward towards to a new plateau of expectations of about 3%. These inflation expectations do not (yet) appear to be (fully) unanchored for the time being, but the fact that they are now well above the ECB’s definition of price stability was one of the elements that has triggered the ECB to take steps towards policy normalisation as well.
To begin with, the ECB also phased out net asset purchases under its Pandemic Emergency Purchase Programme (PEPP) in March and will most likely end net purchases under its general Asset Purchase Programme (APP) in July as well. However, in contrast to the Fed, the ECB is not thinking of reducing its balance sheet any time soon. Nevertheless, we expect the ECB to start a policy rate normalisation cycle of 25 basis point each meeting from July on, to reach a deposit rate of 0.50 basis points by the end of 2022. The peak of the ECB’s normalising cycle will probably reach 2% in the course of 2023, which is still a negative real rate and below what we consider a neutral rate for the euro area.
Yield spreads versus German Bunds on EMU sovereign bonds have risen as a result of the end of the ECB’s PEPP and APP and the imminent rise of policy rates. We expect this trend to continue. Together with a higher expected path for the German benchmark bond yield, this will lead to markedly higher bond yields for EMU sovereign bonds. If at any point these levels would pose a threat to debt sustainability in the euro area, the ECB is likely to introduce and implement a new instrument (which is still to be defined in detail), which would allow the ECB to prevent ‘fragmentation’ in the euro area bond market that could jeopardise the ECB’s monetary policy transmission. It is also because of this specific institutional risk for the euro area that the ECB has been much more reluctant than the Fed to accept the necessity of higher short-term and long-term interest rates.
The interest rate differential between the US and the euro area is expected to increase further in the coming quarters and has already weakened the exchange rate of the euro versus the US dollar. Some loss of credibility of the ECB in terms of its commitment to pursue price stability also played a role. It will take some time to fully restore market credibility, which is why we are now expecting a weaker path for the euro versus the US dollar.
Euro area: positive but sluggish Q1 growth
Real GDP in the euro area expanded by 0.2% qoq in the first quarter, marking a sluggish start to the year. The first-quarter GDP was affected by several factors, including pandemic-related restrictions due to the Omicron wave at the turn of the year, and the subsequent reopening of the economy. In addition, the outbreak of the war in Ukraine led to an even sharper rise in energy prices, weighing on household purchasing power. Finally, the Russia-Ukraine war exacerbated persistent supply chain disruptions. We estimate that sequential Q1 2022 real GDP growth in the euro area could have been almost 0.7 percentage point higher in the absence of the negative supply shocks to global supply chains.
At the country level, economic growth was mixed but mostly unimpressive in early 2022. Spain led the pack of the major euro area economies with real GDP expanding by 0.3% qoq. Still, the Spanish economy continues to be the major laggard in the post-pandemic recovery (Figure 4). The German economy grew by a modest 0.2% qoq, defying expectations of technical recession. Real GDP in France stagnated (0.0% qoq) in the first quarter, while Italy’s growth turned into a slight 0.2% qoq contraction.

Looking ahead, the economic picture is unlikely to get any brighter amid persistent headwinds. After a large Russia-Ukraine war-related hit to consumer sentiment seen in March, the euro area consumer confidence index inched up in April. However, despite a moderate improvement, consumer confidence remains depressed in the face of the war in Ukraine as well as soaring inflation and the related squeeze on purchasing power, clouding the outlook for private consumption.
Meanwhile, business sentiment indicators have been relatively resilient since the start of the war in Ukraine. The euro area composite PMI index rebounded to 55.8 in April, driven by a positive surprise in services. Indeed, the services sector continues to benefit from the lifting of mobility restrictions, signalling a positive start to the quarter. By contrast, activity in the manufacturing sector continues to moderate closer to the 50-point mark (separating growth from contraction) amid higher energy prices and increased uncertainty about Russian energy supplies, as well as renewed supply bottlenecks. Forward looking sentiment indicators, such as the expectations component of the German Ifo indicator, however, still point to a significant risk that in particular the European manufacturing sector may be adversely affected in the coming few quarters. The general evolution of world trade and an aggravation of supply chain bottlenecks are likely to play a role, on top of the (probably temporary) pandemic-related weaker import demand growth from China.
On balance, we maintain our overall view that the recovery in the euro area will broadly stagnate in the second and third quarter. After a moderately worse-than-expected Q1 GDP outturn, we have mechanically downgraded our growth forecast for 2022 from 2.3% to 2.1%, by not altering the expected quarterly growth dynamics for the remainder of the year. Our 2023 real GDP forecast remains unchanged at 1.4%. However, the risks to growth are tilted to the downside, not least because of the possibility of major disruptions in Russian gas supplies leading to forced gas rationing. Under such an adverse scenario, we believe it would be difficult for the euro area to avoid full-scale stagflation.
US: Q1 contraction to be followed by sub-potential growth
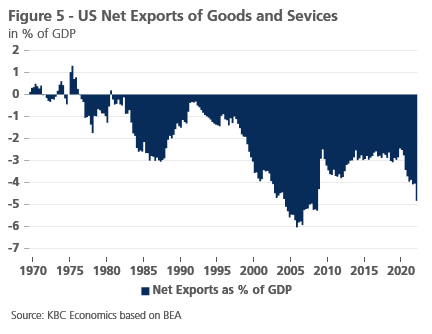
The US economy contracted in Q1 by an annualised rate of 1.4% (qoq growth of -0.4%). The main factor weighing on growth were net exports (Figure 5). Strong gross imports can still be interpreted as a reflection of solid final domestic demand. The negative growth contribution of gross exports, however, were the result of a deteriorating international economic environment, as reflected by the Chinese growth dip and the disruption by the war on international trade in general and global production chains in particular. Moreover, the trade-weighted appreciation of the US dollar also weighed on US gross export growth. As a result of the Fed’s restrictive policies and hawkish rhetoric, the nominal broad US dollar rate has strengthened by around 5% since the beginning of the year, making US (net) exports even less competitive. Our simulations indicate that such an appreciation may generate a negative contribution to growth of around 0.5 percentage point over the next six months.
This drag on growth is unlikely to disappear any time soon given the forceful tightening cycle that the Fed has embarked on, creating significant interest rate differentials in favour of the US dollar. This US tightening cycle will also weigh on growth through other interest rate sensitive components of aggregate demand, such as investments and private consumption. So far, private consumption growth has been holding up relatively well on the back of a tight labour market, although nominal wage growth is struggling to keep up with high inflation.
However, the strong dollar is not the only item inside the tightening financial conditions index. For example, long-term mortgage rates have climbed to ten-year highs and corporate credit spreads have widened significantly too. All this is linked to the Fed’s anti-inflation campaign, which is targeting the slowdown of the US domestic demand and implicitly inflation pressures. We do agree that the tightening of financial conditions will lead to a slowdown of investments and consumption in the coming quarters. Hence, GDP growth should remain below potential for some time, resulting in a gradual cooling of the labour market, which should imply a small uptick of the unemployment rate from the recent business-cycle lows (3.6 %).
All taken together, we assume that the Fed will be able to engineer a ‘soft landing’ of the US economy, in the sense of relatively quickly bringing inflation back towards its policy target without causing a severe recession. Consequently, our expected quarterly growth path for the remainder of 2022 and 2023 is somewhat below the potential growth rate, without any stagnation or even negative quarterly growth. That is admittedly a benign scenario, with risks to the US business cycle skewed to the downside. More specifically, a (technical) recession of two consecutive quarters of negative growth cannot be completely ruled out given the hard-to-estimate restrictive effects of the quantitative tightening.
China: covid causes temporary slowdown
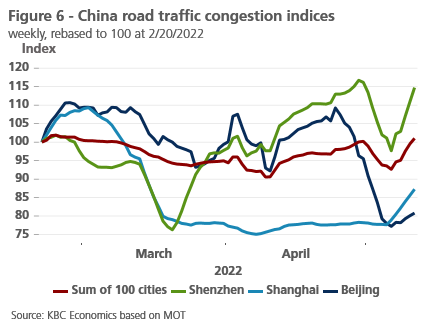
The growth outlook for China has deteriorated further in recent weeks as the covid restrictions in Shanghai have remained in place for longer than expected while fears of new, similarly strict lockdowns in Beijing have grown. Road traffic congestion in major cities, which can serve as a proxy for the severity of the restrictions, collapsed in Shanghai in mid-March and have yet to recover while a similar deterioration in Beijing can be seen since the beginning of May (figure 6).
This suggests that although Q1 GDP held up well at 4.8% year-over-year (1.3% qoq), Q2 will be far weaker due to a collapse in services activity. This view is supported by the most recent business sentiment surveys, with the Markit services PMI collapsing to 36.2 in April, signaling a steep contraction (Figure 7). The Markit manufacturing PMI also moved into contraction territory but held up somewhat better at 46.0. Given these developments, we now expect year-over-year growth of only 3.8% in Q2 2022 (0.4% qoq), with significant downside risks to this outlook. We have therefore downgraded our growth outlook for the full year from 4.8% to 4.5%.

Policymakers continue to signal increased support to boost economic growth, but policy tools are so far incremental (measures include tax relief for small businesses, local government bond issuance to support infrastructure, and cuts to the reserve requirement ratio for banks). Notably, the currency (CNY) has depreciated sharply versus the USD since late-April after a long run of relative strength since the middle of 2020. The sudden sell-off likely reflects a number of factors, including turning investor sentiment due to the harsh covid restrictions and diverging monetary policy between China and much of the rest of the world. The weaker currency may also reflect a policy choice to help support China’s export sector amid a sharp collapse in domestic demand. As policymakers have budged neither on the zero-covid approach nor on the 5.5% growth target for 2022 (which looks increasingly out of reach), further support measures are expected, particularly in the form of higher infrastructure investment.
All historical quotes/prices, statistics and charts are up to date, through May 9, 2022, unless otherwise noted. The positions and forecasts provided are those of May 9, 2022.