

Economic Perspectives March 2021

Read the full publication below or click here to open the PDF.
- More than a year into the pandemic, the global economic recovery appears to be underway. Our economic outlook has become somewhat brighter since the last edition, reflecting an improving epidemiological picture and steadily progressing vaccination campaigns as well as largely encouraging global economic data. Nonetheless, the rebound in economic activity remains fragile, and its pace uneven across the different regions, highlighting lingering downside risks and uncertainties surrounding the post-pandemic recovery.
- The euro area has started the new year on a relatively soft note amid extended lockdowns and disappointing vaccination campaigns, which weigh heavily on services sector activity. In contrast, the manufacturing recovery is gaining pace, supported by robust global demand. We expect euro area real GDP growth to hover around zero in Q1 before the recovery takes hold in Q2 and gathers further momentum later in 2021. We have raised the euro area growth outlook from 3.8% to 4.1% in 2021 and pencil in the same annual growth also in 2022.
- The US economy has seen a strong start to 2021 with surging consumer spending and upbeat business sentiment data. The labour market made further gains in February, though the path ahead remains challenging. We believe that the US economy is set for an even stronger recovery due to the rapidly accelerating pace of vaccination and the approved USD 1.9 trillion fiscal package. As a result, our real GDP growth outlook has been upgraded in both 2021 and 2022 to 6.0% and 3.7%, respectively.
- Global bond markets have seen a sharp sell-off in recent weeks, prompting a volatility burst across broader financial markets. The rise in long-term sovereign bond yields appears to reflect a material reassessment of the global economic outlook in favour of a stronger recovery and further away from severe downside risks, as well as higher uncertainty about the Fed’s monetary policy path. A repricing in the bond markets has prompted us to upgrade our expectations for the long-term sovereign bond yields in the US and the euro area. On the policy front, we continue to anticipate that both the ECB and the Fed will maintain low interest rates for some considerable time, despite a recent build-up in market expectations for tighter monetary policy.
- Oil prices have rallied further on the back of the OPEC+ decision to rollover the current level of output cuts, implying a significantly tighter market balance. We have, therefore, materially upgraded our oil price outlook, a key driving force behind our expectations for stronger short-term inflationary pressures on both sides of the Atlantic. Despite an upward revision in euro area inflation, underlying price pressures are set to remain reasonably muted over the longer term. In the US, inflation is also expected to rise rapidly in the coming months, significantly due to higher oil prices, but should ultimately remain well-behaved in the longer term.
More than a year into the pandemic, the global economic recovery appears to be underway. The rebound in economic activity, however, remains fragile, and its pace uneven across the different regions. A marked divergence also persists between different sectors, highlighting a ‘two-speed’ nature of the ongoing recovery. On the one hand, global manufacturing is on a strong footing in both advanced economies and emerging markets. Most recently, a rapid rebound in trade in goods has even led to some supply chain disruptions, including rising shipping costs and increased global delivery times. On the other hand, the services sector is set for a slower recovery with activity still severely strained amid the looming pandemic and ongoing social-distancing measures in place.
Infection rates on the decline, vaccination effort on the rise
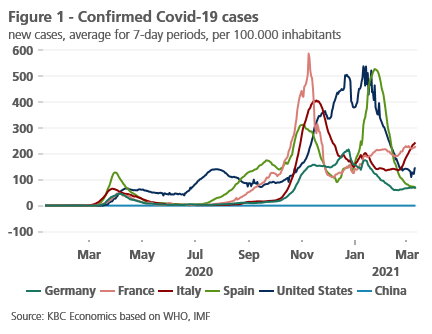
Globally, the epidemiological picture has nonetheless improved considerably since early this year. New Covid-19 infections have declined sharply worldwide, though the dynamics vary widely between countries due to an increasing number of new more transmissible variants (figure 1). Following the January peak of new daily cases, the US has turned the corner on the latest wave with the number of new cases down dramatically. Across most European countries, the infection rate has also dropped significantly from earlier peaks, helped by tight lockdowns. So far, governments have signalled a cautious approach towards lifting the restrictions with the new virus strains posing a notable risk to the reopening.
At the same time, vaccination campaigns are steadily progressing, paving a way out of the pandemic. In the US, the vaccination effort has gathered pace over the last weeks with more than 2 million doses administered per day (7-day average) and about 18% of the population having at least begun vaccination. The vaccination campaign has progressed at an even faster speed in the UK, where more than 30% of the population has already received at least one vaccine dose (figure 2).
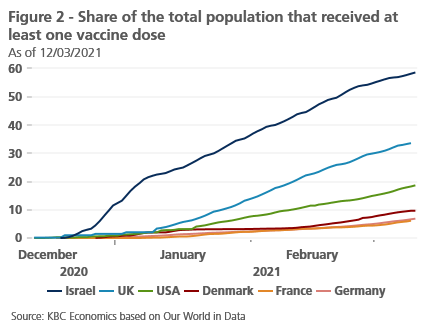
Meanwhile, the pace of vaccination has accelerated somewhat in continental Europe in the past weeks, but overall progress remains slow. This partly reflects delivery delays due to logistical and bureaucratic issues, yet a large share of delivered AstraZeneca doses – seen as a crucial part of the EU vaccination effort – have so far gone unused after efficacy doubts and adverse publicity eroded trust among the public.
A brighter economic outlook with lingering risks
Overall, our assessment of the economic outlook has become somewhat brighter since our February edition, which is reflected in growth upgrades for both the US and the euro area. We maintain our view that the US recovery will outpace other advanced economies, driven by massive fiscal stimulus and the removal of many pandemic-related restrictions in several States. In the euro area, the economic rebound is set to be somewhat slower, building momentum in the latter part of this year. Outside the advanced economies, we expect a robust annual expansion in China, leading the post-pandemic recovery across emerging markets.
These projections remain subject to considerable risks, largely related to the evolution of the pandemic and the success of vaccination campaigns. The rapid spread of new Covid-19 variants is a major downside risk, not least should the available vaccines prove ineffective or significantly less effective. A slow pace of vaccination and related concerns are important downside risks too, potentially pushing back the economic recovery. In the face of lingering uncertainty, we maintain three scenarios: the baseline (a gradual recovery strengthening from H2 2021 onwards), to which we attach a probability of 60%; the pessimistic (a disrupted and unsteady recovery) with a probability of 30%; and the optimistic (a sharp and strong recovery already in H1 2021) with a 10% probability
A soft start to 2021 in the euro area
The euro area started the new year on a soft note, extending a weak trend seen over the last months of 2020. The first batch of hard data disappointed markedly with retail sales down by 5.9% mom in January, reversing a 1.8% rise from December. This sharp drop reflects tight lockdowns across most parts of the euro area which took a heavy toll on consumer spending. Furthermore, the larger-than-expected decline appears to be a result of some specific factors such as the VAT hike in Germany and delayed winter sales in France and Italy.
These transitory factors may indeed exaggerate the underlying weakness in consumer spending which is the reason why we do not draw a strong conclusion from poor retail sales data. Still, the weakness of private sector activity extended well into February. The headline euro area PMI index picked up slightly but came in below the 50-threshold indicating contraction (figure 3). Meanwhile, activity in the services sector remained even more depressed due to the extended lockdown measures. A drag from the government restrictions, however, appears somewhat more limited compared to the sharp tightening of lockdown measures seen in November 2020.
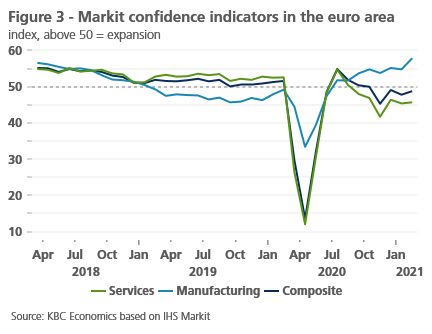
On the manufacturing side, activity in the euro area strengthened further in February, prompting renewed divergence between the economy’s two main sectors. The manufacturing PMI index surged to 57.9 and reached the highest level since February 2018. This broad-based manufacturing recovery is mainly driven by robust global demand, reflected by an increase in both output and new orders. At the same time, the headline index was (artificially) boosted by longer delivery times. While usually a sign of strengthening demand, a closer look suggests that suppliers’ delivery times lengthened in part due to emerging supply chain bottlenecks (e.g. semiconductor shortages), leading to a further increase in upstream prices pressures.
Looking ahead, resilient industry output should mitigate the negative impact of subdued services sector activity on growth. Against this background, we expect euro area real GDP growth to hover around zero in the first quarter before the recovery builds in the second quarter and gathers further momentum later in 2021 in tandem with progress on the vaccination front. In addition, fiscal policy is set to remain supportive this year, and most likely also in 2022. Although no formal decision has been yet taken, the European Commission has signalled its intention to maintain the general escape clause of the Stability and Growth Pact active in 2022. The extended suspension of EU fiscal rules is seen as important to avoid a premature fiscal tightening, allowing the economy to fully recover from the pandemic.
All things considered, we have raised the euro area growth outlook for 2021 from 3.8% to 4.1%, largely due to the sizable revisions of historical GDP data (see Box 1: Economic review on the annus horribilis). Our growth outlook for 2022 remains unchanged with the same projected real GDP growth of 4.1%. This implies that the euro area should return to the pre-pandemic level of output in the middle of 2022.
Box 1 – Economic review on the annus horribilis
The economic figures for the annus horribilis 2020 are gradually being completed. We have already pointed out several times that the Covid-19 crisis hit the European economies harder than the other major economies, such as the US and especially China. There were also significant differences between the European countries themselves. These can now be explained on the basis of the spending components. Figures are now available for the main euro countries and the euro area as a whole (Figure B1.1).
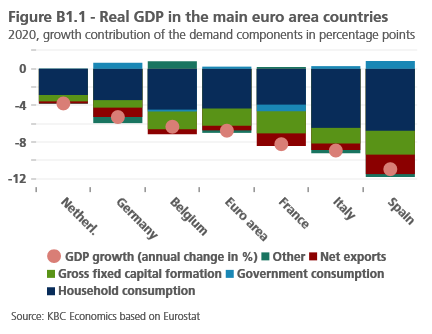
In all the countries considered, the decline in household consumption was the main cause of the economic contraction. This underlines the atypical character of this recession, because usually consumption expenditure is a stabilising factor during recessions. Investment demand also declined, but due to the sharp drop in household consumption, it made a smaller (relative) contribution to the economic downturn than usual during recessions.
Despite the massive use of budget support for the economy, only in a few countries did public consumption make a – still very limited – positive direct contribution to economic growth. Indeed, the main focus of public support has been on income transfers to households and businesses and much less on an increase in public consumption. According to IMF data, the additional spending on health care, for instance, represented only 8% (Italy and France) to 12% (the Netherlands) of the additional fiscal measures (excluding the so-called ‘automatic stabilisers’) that governments allocated to the fight against the pandemic in 2020. With a share of 18%, Belgium was somewhat of an outlier in this respect.
Although the decline in household consumption was the main cause of the economic contraction in all countries, its magnitude still varied widely from country to country. These differences largely explain the differences in the overall economic impact of the pandemic. They are related to the ultimate impact of the crisis on household incomes.
Full year figures are not yet available, but Eurostat figures for the first three quarters of 2020 show that in Spain, Italy and France (nominal) household disposable income dropped compared to the previous year by 11.6%, 9.6% and 9.3% respectively, while Belgium still recorded an increase of 1.3% and Germany and the Netherlands recorded increases of 1.5% and even 3.8%. European Commission estimates for the full year 2020 suggest that wage income of employees and the income of the self-employed have fallen everywhere, but significantly more in Southern Europe. This relatively large income shock reflects the relatively large share of sectors that were hit hard by the lockdown measures, such as hospitality and tourism. At the same time, government income compensation would have been proportionally much more limited there.
Moreover, the Spanish and Italian economies are relatively more sensitive to household income shocks because they are generally more dependent on household consumption. Their share in total GDP stood at 59.4% and 60.8% respectively in 2019, compared to only 52.7% on average in the euro area as a whole. This vulnerability is again reinforced by the relatively high importance of hospitality and transport expenditures in household consumption in these countries - expenditures that were severely hampered by the pandemic.
Strong momentum in the US economy
In contrast to the euro area, the US economy has started 2021 strongly. Industrial production rose for the fourth consecutive month in January, expanding by 0.9% mom. Retail sales recorded an even more impressive 5.3% mom rebound, significantly exceeding expectations. A strong increase in consumer spending was driven mostly by renewed fiscal support. As a part of the USD 900 billion package approved at the end of December, the government distributed USD 600 stimulus payments, and extended federal unemployment assistance, both boosting aggregate disposable income markedly (also see KBC Economic Opinion of 4 March).
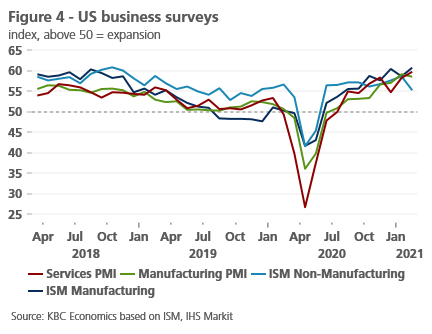
The latest soft data point to ongoing momentum in February. Business sentiment indicators came out particularly upbeat and remained well entrenched in the expansion territory (figure 4). The headline ISM manufacturing index rose to a 3-year high with increases across the production, new orders, and employment components. Along with robust goods demand, the headline index was lifted by longer delivery times amid intensified global supply chain disruptions. Coupled with higher commodities prices, this has pushed the ISM input price index to the highest level since 2008.
Meanwhile, the labour market made further gains in February. The US economy added 379,000 jobs, almost double what was expected, driven by a surge in services employment (leisure and hospitality sector). However, the number of non-farm jobs is still down by 9.5 million from its pre-pandemic level in February 2020, highlighting a challenging path ahead. Likewise, the unemployment rate ticked down to 6.2%, but the headline figure appears to be significantly understating the slack in the labour market, particularly when accounting for persons who have exited from the labour force in the last year. If we include the approximately 4.2 million people having left the labour market since the pandemic hit, the unemployment rate would be north of 9%. So, although there has been a solid rebound, the recovery remains far from complete.
Overall, we maintain our positive outlook for the US economy in 2021. Most recently, this has been reinforced by a rapidly accelerating pace of vaccination. Moreover, President Biden announced that the US would have enough vaccine supplies to inoculate every American by the end of May, two months earlier than previously anticipated. The progress in vaccination, together with a sharply lower infection rate, has already led to some easing of containment measures with more broader-based re-openings in sight.
On the fiscal front, the latest development is similarly positive. This week, the US Congress has approved the Democrats’ original full-sized fiscal package of USD 1.9 trillion, including direct payments of USD 1,400 to most individuals. Similarly to the past pandemic relief measures, the package is set to boost disposable income, and support economic activity via stronger spending in the coming months. While big elements such as direct payments to individuals and the extension of unemployment insurance will be spent in 2021, about one-third of the fiscal package will likely be spent from 2022 onwards.
Against this background, we now see an even more forceful recovery in the US economy. Our real GDP growth outlook has thus been upgraded from 5.2% to 6.0% in 2021 and from 3.5% to 3.7% in 2022. As a result, the US will outperform most of the advanced economies with output set to recover to the pre-pandemic level already in the second quarter of this year.
Higher bond yields amid reflation prospects
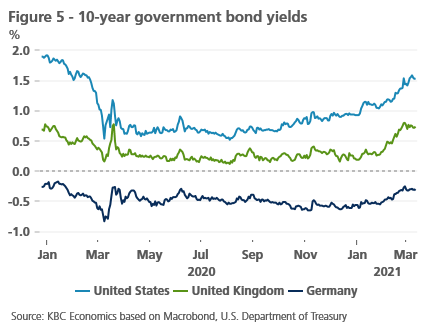
Global bond markets have seen a sharp sell-off in recent weeks, prompting a volatility burst across broader financial markets. Since early February, the yield on the 10-year US Treasury bond has surged by 50 bps, topping 1.5% for the first time since the pandemic struck. Spillovers from rising US interest rates have caused a rapid steepening of the yield curves also in other major economies. Sovereign bond yields have picked up strongly in the United Kingdom, while the rise in the euro area was somewhat more limited with the 10-year Bund yield still firmly established in negative territory (figure 5).
The sell-off across global bond markets appears to reflect a material reassessment of the global economic outlook in favour of the stronger recovery and easing concerns that severe downside risks might materialise, as well as higher uncertainty about the Fed’s monetary policy path (see Box 2: What has been driving US interest rates recently?). In the latter part of 2020, a pick-up in long-term nominal yields was driven by rising inflation expectations, but recent gains have largely come from higher real yields, signalling expectations for firmer real growth, not just inflation. In our view, market participants are gaining confidence in the growth outlook as a result of a rapid decline in Covid-19 infection rates, a ramp-up in vaccination efforts, as well as substantial fiscal stimulus in the US economy. At the same time, the unprecedented size of the US fiscal stimulus may have also raised inflation risks leading to a recalibration of risk premiums by market participants.
Box 2 - What has been driving US interest rates recently?
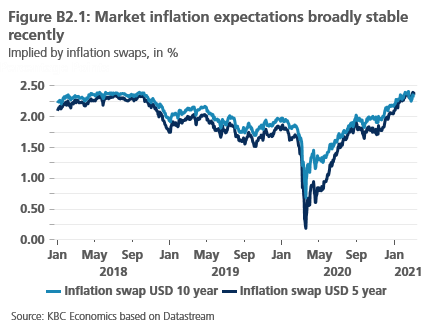
Since the beginning of 2021, US 10-year government bond yields have risen sharply by more than 70 basis points to about 1.50%. This rise was not only limited to the longer end of the yield curve, but also applied to medium-term maturities. For example, the 5-year yield rose in the same period by more than 40 basis points to about 0.80%. Although neither the level of the bond yield, nor the steepness of the yield curve are thus far at unusually high levels, the speed of the rise is all the more remarkable. This raises the question what the driving forces are behind this exceptional move.
First of all, the broadly stable evolution of market inflation expectations since the beginning of the year suggests that they are not the main driver of the higher rates (Figure B2.1).
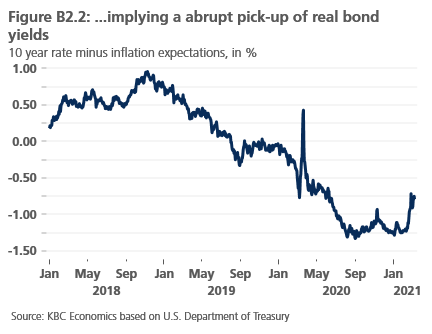
The higher bond yields, therefore, rather reflect higher real (inflation-adjusted) yields. Nevertheless, it is important to note that, even after the recent rise, real US yields are still well in negative territory, i.e. at quite compressed levels (Figure B2.2).
The second question that follows is, what component of real interest rates has been the main determining factor? According to the ‘extended expectations hypothesis’ of the term structure of interest rates, a longer-term interest rate can be thought of as the compounded expected future short term rates plus a risk premium, called ‘term premium’, to compensate for the risk-taking, among others, of getting that expectation wrong. For risk-neutral investors, this risk premium should be zero, while for risk-averse investors, it should be positive. A negative term premium, as was the case during 2020, is conceptually an anomaly. It implies either a degree of ‘risk-loving’ market behaviour, which is not very plausible, or a distortion of efficient market functioning, caused by, for example, interference by central banks’ asset purchases or excess liquidity.
To investigate the recent evolution of this term premium, we can refer to the New York Fed’s staff ACM model. This model decomposes the observed long-term interest rate in its risk-neutral component (i.e. expected future short-term rates) and the term premium.
The ACM decomposition in Figure B2.3 suggests that the recent rise of bond yields was almost entirely due to the rise of the term premium. The expected path of future short-term rates (called the ‘risk-neutral’ yield) played less of a role. The model thus suggests the that the market may still be expecting a broadly unchanged Fed policy rate for the foreseeable future (no rise of the ‘risk-neutral rate’), but that the market has become less certain about this view, and requires higher compensation for risk-taking (i.e. demands a higher term premium).
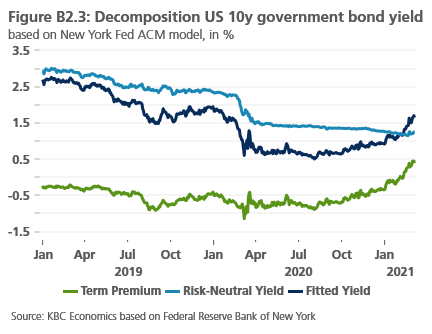
Moreover, the normalisation of the term premium (the term premium has become positive again, at least in the specification of the ACM model), may also be related to market expectations of future ‘tapering’ of bond purchases by the Fed. These bond purchases have in the past decade played a major distorting role in compressing the term premium. On the assumption that the Fed’s current forward guidance about its bond purchase programme has contributed to uncertainty for markets about the exact timing of any such ‘tapering’, the future evolution of US bond yields will partly also depend on whether, and when, the Fed provides some credible clarification on this matter. In this context, the abrupt (and temporary) rise of bond yields via a higher term premium during the 2013 ‘taper’ tantrum served as an example of what can happen to bond yields if the market’s expectation of Fed policy is not sufficiently in line with the Fed’s actual policy intentions.
A repricing in the bond markets has prompted us to upgrade the outlook for long-term sovereign bond yields, bringing the timing of the steepening of yield curves forward. We now see the 10-year US bond yield increasing to 2.15% by the end of this year and 2.25% by end-2022. The outlook for the euro area long-term interest rates has been also upgraded, albeit less significantly. The 10-year German bond yield is projected to leave negative territory by the end of 2021 and pick up to 0.25% by end-2022. Against the background of additional ECB liquidity injections, we maintain our view that intra-EMU spreads will be kept at current low levels over the forecasted horizon.
Central banks set to maintain an accommodative stance
On policy rates, we continue to expect an ultra-accommodative stance to be maintained for some time. This is despite a recent build-up in market expectations for an earlier than previously envisaged unwinding of the current monetary policy support. In the US, markets have shifted to a considerably more hawkish outlook, currently pricing the start of the hiking cycle already in early 2023, even though Fed officials (based on the December FOMC meeting) do not foresee a first rate hike until 2024. It seems likely that the markets will test the Fed’s commitment to the new flexible average inflation targeting framework further in the coming months. Nonetheless, given substantial progress that is needed to achieve both price stability and full employment targets, we anticipate that the Fed will maintain the current low policy rate until the end of 2023.
At the same time, we expect policy rates to remain low for a considerable period in the Euro area. Recent comments from ECB officials signalled some concerns about rising government bond yields, in particular in terms of possible negative effects on the ECB’s mantra of maintaining favourable financing conditions. This in part reflects the fact that the euro area is facing a slower recovery than some other advanced economies, leaving it more exposed to the rise in bond yields. Overall, we see the ECB keeping policy rates at the current level at least through to end-2022, with no early shift away from their asset purchase programmes. At its March 11 policy meeting, the ECB Governing Council decided to ‘significantly’ increase the size of its purchases under the Pandemic Emergency Purchase Programme through the second quarter and indicated that this adjustment was implemented ‘with a view to preventing a tightening of financing conditions that is inconsistent with countering the downward impact of the pandemic on the projected path of inflation’.
Higher oil prices boost inflation
A surge in commodity prices has been one the main driving forces of the global reflation theme in recent months. Along with metals and some agriculture commodities, the oil prices have rallied above 70 USD/barrel, buoyed by the surprisingly bullish outcome of the March OPEC+ meeting (figure 6). Against expectations, the OPEC+ alliance decided to rollover the current output cuts in April, while Saudi Arabia announced an extension of its unilateral 1 million barrels per day production curbs.
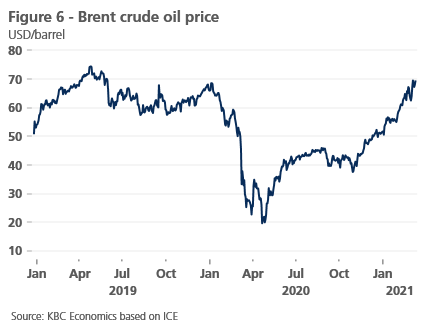
Altogether, the OPEC+ alliance is collectively withholding around 8 million barrels per day from the market, heavily supporting the ongoing market rebalancing (i.e. a decline in excess oil inventories). With demand conditions gradually improving, the oil market has become increasingly tight, likely leading to further upward price pressures (also see KBC Economic Opinion of 1 March). We have, therefore, substantially upgraded our oil price outlook, now forecasting Brent crude to average 68 USD/barrel in 2021 and 67 USD/barrel in 2022.
A higher projected path of oil prices in the near term is the key driver behind our expectations for stronger short-term inflationary pressures over the forecasted horizon. After a surprising jump in the euro area headline HICP inflation in January, the February print remained stable at 0.9% yoy, in line with expectations. Looking ahead, we anticipate a notable increase in headline inflation, driven to a large extent by a significant positive base effect from higher oil prices, emerging from March onwards. Furthermore, recent survey data pointing to mounting supply-chain pressure and rising input prices in the goods sector represent a further upside risk to near-term inflation pressures. Finally, statistical issues, such as methodological changes to the HICP basket weights, will remain a source of elevated uncertainty about the path of inflation.
That said, we see inflation picking up faster than previously envisaged, in large part due to temporary factors that the ECB will likely look through. All in all, we have revised our inflation outlook upward by 0.3 percentage points to 1.6% in 2021, followed by a pullback in headline inflation to 1.4% next year. Underlying price pressures are set to remain reasonably muted over the longer term, as a consequence of both cyclical influences and structural disinflationary forces, implying an extended period of undershooting of the ECB’s inflation target.Meanwhile, inflationary pressures are expected to gradually pick up in the US economy. While the February CPI release shows ‘core’ inflation still subdued and easing slightly to 1.3% yoy from the January reading of 1.4% yoy, a number of factors argue for higher headline and core rates in coming months. We anticipate a near-term upshoot in headline inflation above 3.0% on the back of a positive base effect from higher oil prices, the unleashing of some excess savings, and to a lesser extent due to some emerging supply chain disruptions. At the same time, we have upgraded the US inflation outlook, now expecting headline inflation to pick up to 2.6% (from 2.4% previously) in 2021, before easing somewhat to 2.2% in 2022.
In currency markets, rising long-term bond yields have temporarily supported the US dollar since late February, pushing the greenback well below 1.20 EUR/USD. We believe that the dollar is currently benefiting from an increase in real rates, however, the risk of a widening twin deficit (i.e. both current account and budget deficit) and the related financing requirements could pose a significant challenge for a continued strength of the dollar in the medium term. Overall, the room for further dollar gains is limited, in our view. We continue to pencil in a structural strengthening of the euro vis-à-vis the US dollar towards 1.25 by end-2021, reflecting a gradual unwinding of its fundamental undervaluation.
All historical quotes/prices, statistics and charts are up to date, through 8 March 2021, unless otherwise stated. The positions and forecasts provided are those of 8 March 2021.