

Economic Perspectives January 2023
Read the full publication below or click here to open the PDF.
- European natural gas prices decreased by 48% in December to 76 EUR per MWh. At least temporarily, this decrease marks the end of an extremely costly phase of the energy crisis, in which prices peaked at 340 EUR per MWh. Mild and windy weather conditions and structural savings in natural gas consumption leave the European gas reserves at high levels while Brent oil prices remain relatively low. The risk of protracted and critical energy shortages over winter have decreased significantly.
- Euro area headline inflation fell to 9.2% in December, from 10.1% in November, on the back of a significant drop in energy inflation. Headline inflation likely peaked in October (10.6%), but underlying inflation pressures are still robust, with core inflation increasing slightly to 5.2%. Going forward, we expect inflation to gradually decline further, driven by a strong deceleration in energy inflation and a gradual slowdown of core inflation. We lowered our inflation forecast for 2023 by 0.9 percentage points to 5.4% and we expect inflation to converge to the 2% ECB target in the course of 2024.
- Recent CPI inflation dynamics confirm the downward trajectory of US headline inflation, which dropped to 6.5% in December, corroborating the view that the US inflation peak lies well behind us. Decreasing core inflation (now at 5.7%) and some tentative signs that wage growth is slowing suggest that underlying inflationary pressures may also be easing. We have revised down our inflation forecast to 3.5% for 2023 and to 2% for 2024.
- In their December monetary policy meetings, the Fed and the ECB both decided to hike interest rates by 50 basis points and reaffirm their commitment to keep policy rates well within restrictive territory until inflation is on a sustained downward path. The ECB also announced it will soon take its first timid steps towards quantitative tightening. In line with central bank communications, we maintain our forecast that the ECB deposit rate and the Fed policy rate will peak in Q2 2023 at 3.5% and 5.375% respectively.
- Despite some positive inflation developments, the advanced economies are still headed for stagnation, with (mild) technical recessions still on the table. While our view on euro area growth dynamics remains fundamentally unchanged, we did strengthen our average growth outlook for 2023 to 0.4% because of the near-term relief provided by lower energy prices. For 2024 we forecast real GDP growth to reach 1.5% as the economy gradually recovers. Thanks to its strong labour market and resilient private consumption, the US economy has managed to remain surprisingly resilient in light of the significant tightening of financial conditions. We therefore increased our growth outlook for 2023 to 0.9% (from 0.4%) and expect some increases in growth in 2024 (1.1%).
- The lifting of the zero-tolerance policy by the Chinese government opens the perspective of an economic rebound once the sizeable Covid-wave, that was triggered by the policy change, dies down. The disruptive impact of Covid-infections will likely fade out by the end of Q1 and make way for a normalisation of economic activity. Our upwardly revised growth outlook for 2023 (4.4%) reflects both the difficult Covid transition and the strong reopening effects after Q1
The Good, the Bad and the Ugly
As cinephiles may be enjoying the latest Avatar movie, the world economy seems to follow another classic’s script: “The Good, the Bad and the Ugly”. Strongly decreasing energy (in particular gas and electricity) prices provided good news to the European economy. However, this positive development does not necessarily put an end to (the impact of) the energy crisis. In Europe, industry and households are still facing significantly higher energy prices than before the pandemic as it takes time for prices on European gas markets to feed through to consumer prices. In addition, the crisis caused a substantial fall in confidence and purchasing power and will continue to weigh on activity going forward. Combined with still high inflation and increasing (real) interest rates, the headwinds for European growth remain significant. In the US, the Fed stars in the role of Bad cop as it is determined to bring inflation down, no matter the (economic) costs. Restrictive monetary policy is therefore likely to stay until significant decreases in structural inflation provide sufficient reassurance that inflation will converge back to target. In China, the Chinese government has effectively abandoned zero-Covid policies after nationwide protests. The lifting of restrictions is leading to an Ugly Covid wave. The surge of infections is expected to have negative growth effects in the first quarter of 2023. However, going forward, the reopening of Chinese economy is poised to generate strong positive growth effects as consumers can tap excess savings and pent-up demand is unleashed. The reopening of the Chinese economy will have positive effects on the global economy. All in all, these developments are clearly instrumental in avoiding a deep global recession and are more in line with our scenario in which we pencil in a global slowdown or stagnation, potentially combined with (mild) technical recessions in some advanced economies. A global economic slowdown remains the most likely scenario, but risks are tilted to the downside.
European natural gas prices back at pre-war levels
Mild weather conditions in Europa, structural savings in gas consumption and a continued gas supply caused natural gas prices in Europe to fall significantly. Following these conditions, European gas reserves remained at elevated levels and provide ample buffers to absorb potential energy demand peaks during winter. Recent data from Eurostat shows that European natural gas consumption has decreased by 20.1% in August-November 2022 compared to average gas consumption for the same months over the period 2017-2021. At the end of 2022, the fill rate of European gas reserves stood at 83.3%, compared to 54% end 2021. As a result of these factors, European natural gas prices decreased by 48% in December, to 76 EUR per MWh (see figure 1). These are prices last seen since before the start of the war in Ukraine.
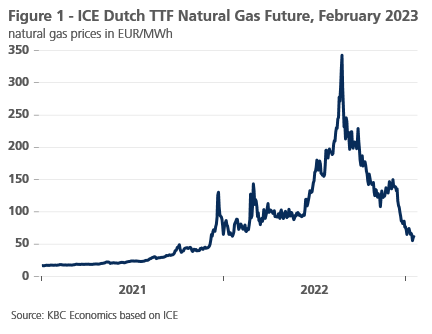
There are no guarantees that the downward trend in gas prices of December will continue over the next months. Harsh winter conditions could still result in a fast depletion of gas stocks and thus drive up prices. If fiscal support measures blur this price signal by limiting the pass-through to retail gas prices, there is an upward risk that industry and household will not adjust their energy demand. The reopening of China will also put upward pressure on prices as energy demand is expected to increase in the coming quarters. In a longer term perspective, ensuring the smooth refilling of gas reserves over the next years and securing the energy transportation network will remain a policy priority as risks of either gas supply disruptions (e.g. further cuts in Russian gas supply) or increased gas demand (Chinese economy) remain.
Meanwhile in the oil market, important developments concerning China’s zero-Covid have affected price developments. Following a long period of decreased Chinese oil demand because of zero-tolerance Covid policies, the recent lifting of many Covid-restrictions is likely to normalise economic activity and raise energy demand once the current Covid-wave dies out. The expected increase in demand is already supporting Brent oil prices at levels close to 86 USD per barrel.
Euro area inflation falls and may have peaked
Euro area inflation fell by almost one percentage point to 9.2% in December. The drop in inflation was almost exclusively due to the fall in energy price inflation, which decreased from 34.9% in November to 25.7% in December. This could mean that inflation in the euro area has peaked. However, specific factors have to be taken into account. The sharp decline in euro area inflation is mainly driven by developments in Germany, where the government made a one-off payment to households and small- to medium-sized businesses to cover their monthly instalment for gas and heating in December. According to the German statistics office, this had a downward effect on prices. The above illustrates how volatile and difficult it is to predict inflation changes.
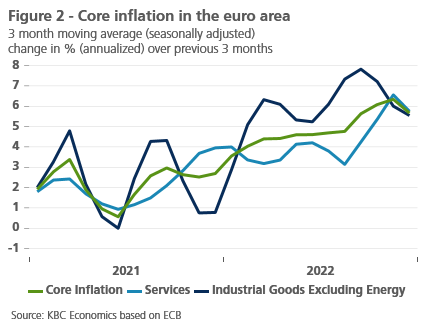
In this context, the development of core inflation, which excludes volatile energy and food prices, is more important than ever. Unlike headline inflation, core inflation has not yet peaked and even increased from 5.0% in November to 5.2% in December. And while core inflation is significantly lower than headline inflation, it is still well above the ECB’s 2% (medium-term) target. Moreover, the acceleration of core inflation illustrates that the (upside) risk of further and longer-term inflation ‘slippage’ has not yet passed.
Yet, we continue to assume that this risk will not materialise. After all, core inflation has accelerated in recent months not only due to the indirect effects of higher energy costs, but also as a consequence of the reopening of the economy after the pandemic and global supply chain disruptions. Those effects should now gradually fade. The month-on-month trend in prices already suggests that the underlying dynamics of core inflation are no longer accelerating, but rather levelling off (see figure 2). If this trend continues, core inflation could soon peak and start to decelerate. However, higher wage growth to compensate for the loss of purchasing power in the recent period does imply that the cooling of core inflation will be rather slow.
If the recent fall in energy prices is not reversed in the coming weeks by higher wholesale prices, there will be an earlier-than-previously-expected downward impact on the overall inflation rate. We therefore lowered our 2023 forecast for average euro area inflation from 6.3% to 5.4%. In 2024, we expect average inflation to fall further to 3.0%. The outlook that inflation will gradually decelerate in the coming months is fairly certain, at least as long as energy prices do not return to last summer’s extreme highs. But for numerous reasons the exact path and pace of the decline remain extremely uncertain.
Slowing US inflation confirms the recent trend, but services inflation should be watched closely
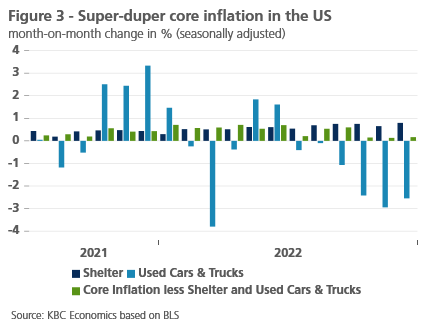
US inflation data for December were fully in line with expectations – headline inflation fell to 6.5% year-on-year and core inflation to 5.7% year-on-year. The details of the CPI inflation print show that the inflationary components that were largely responsible for the 2021-2022 inflation surge – i.e. gasoline and used car prices – continued to fall. Shelter items, on the other hand, continue to generate pro-inflationary impulses as the pass-through from higher rents to the CPI is slow (with a lag of several months to a year) and new pro-inflationary impulses are generated by rising services prices. Solid wage growth and a rebalancing of consumption towards services support these recent service inflation dynamics.
Even after adjusting for used car prices and shelter, core inflation seems to slow down on a month-on-month basis, suggesting that underlying inflation is also slowing. In this respect, it is worth noting that the proprietary inflation sub-index, which Paul Krugman recently dubbed ‘super-duper core inflation’ (i.e. headline inflation less energy, food, shelter and used cars prices), has risen by just 0.14-0.16% month-on-month since October 2022 (see figure 3). These figures would be undoubtedly consistent with the Fed’s 2% inflation target. What remains highly uncertain is the extent to which the very tight labour market will or can be cooled any time soon. This is important as a cooldown could put the brakes on inflation in the services sector via a slowdown in wages. Slow deceleration of core inflation remains the critical feature driving monetary policy. As mentioned by Fed chair Powell, the core services inflation (PCE sub-index) functions as a crucial inflation gauge signalling to the US central bank whether or not its tightening campaign is working. We expect core inflation to remain above the 2% objective throughout the year 2023 as we do not think core services inflation will decelerate quickly over the coming months.
Central banks remain hawkish
The ECB raised its key policy rates by 50 basis points in December, bringing the deposit rate to 2%. The central bank also stuck to its hawkish guidance saying that it aims to significantly raise rates further at a steady pace based on the substantial upward revision to the inflation outlook. The ECB raised its average CPI forecasts for the 2022-2024 period from 8.1%-5.5%-2.3% in September to 8.4%-6.3%-3.4% with the first indication for 2025 at 2.3%. According to the ECB, inflation is thus set to remain above the 2% inflation target over the policy horizon. Underlying core CPI is expected to rise to 4.2% in 2023 before moderating to 2.8% and 2.4% in 2024 and 2025 respectively. Risks remain primarily tilted to the upside, especially in the near term.
At the press conference after the December meeting, ECB president Lagarde clarified further that a steady pace means increments of 50 basis points – a stark difference with the Fed message of a downshift to 25 basis points from early February onwards. Keeping ECB interest rates at restrictive levels will over time reduce inflation by dampening demand and will also guard against the risk of a persistent upward shift in inflation expectations. Higher interest rates will from March 2023 onwards be complemented with an end to the reinvestment policy of the roughly 3.2 trillion EUR Asset Purchase Programme portfolio. The decline will amount to 15 billion EUR per month on average until the end of Q2 2023 and its subsequent pace will be determined over time.
The Fed lifted its policy rate by 50 basis points to 4.25-4.50% at its final policy meeting of 2022. The slowdown from the previous four 75 basis points rate hikes was communicated well in advance. December’s statement was an exact copy of the November one and reiterated that ongoing increases in the policy rate will be appropriate.
The new forecasts included an upward revision in PCE inflation, both headline and core. The Fed now assumes 3.1% headline price growth (3.5% core) in 2023, 2.5% (2.5%) in 2024 and 2.1% (2.1%) in 2025. GDP growth forecasts were lowered to 0.5% in 2023 and 1.6% in 2024. The unemployment rate was revised higher to (an admittedly still relatively low) 4.6% in the next two years. Stubborn and above-target inflation requires more rate hikes, with the central bank pencilling in a 5-5.25% terminal rate through 2023. That is 50 basis points higher than the September forecasts. The distribution in estimates was widely skewed to the upside with 7 out of 19 policy makers expecting the peak (well) above the median and only 2 below that level. In 2024, and not before – as stressed by chair Powell during the press conference – the Fed sees room for rate cuts. The longer-term (neutral) rate was unchanged at 2.5%.
Bond markets sold off following these hawkish central bank meetings. The German 10-year yield closed 2022 at a new cycle top just north of 2.5%. The US 10-year yield closed at 3.9%. At the start of 2023, part (Europe) or all (US) of the post-central bank moves have been retraced. China’s reopening and the drop in energy prices and inflation caused a strong risk-on environment with traditional early January (fund) flows into bonds adding to the rally which is at odds with hawkish central bank guidance. We stick with our view that markets are underpricing the medium-term trajectory of Fed and ECB policy rates.
The euro outperformed since the mid-December policy meetings as markets switched to a risk-on mode. First, the balance of interest rates favoured some strengthening of the euro as the ECB is still catching up with the Fed, pointing to stronger tightening ahead, whereas the Fed has more room for a downshift. Second, as the risk environment played its role, EUR/USD extended its comeback from 1.05 towards 1.085.
A timid bright spot for the euro area economy
The sharp fall in energy prices at the turn of the year is a bright spot in the dark cloud over the European economy. Especially the near future, possibly including the winter of 2023-2024, looks somewhat less at risk. The longer-term energy price message has hardly changed compared to recent months and to the pre-energy crisis period: the European economy will have to live with structurally higher energy prices.
In our baseline scenario for the economic outlook, we have consistently assumed that European economies will not get through the energy crisis unscathed but that the overall impact will be limited to a mild recession during the current winter period. The economies should be sufficiently resilient to largely adapt to the new environment by next winter, allowing for a gradual and moderate economic recovery. A deep recession and/or another recession next winter will therefore be avoided. Nevertheless, the extreme uncertainty, not least as a result of the war in Ukraine, implies significant downside risks to the growth outlook. In this regard, we see the recent developments in the energy market – especially in terms of energy supply and price developments by next winter – as a short-term risk mitigator rather than as a reason to significantly raise the growth outlook.
Recent indicators are in line with our baseline growth outlook. Business confidence indicators – while still in contractionary territory – seem to be stabilizing or bottoming out, especially in the services sectors. A rebound is observed in consumer confidence, although still at extremely low levels and the latest retail figures and surveys indicate that budget constraints are starting to bite, in particular for the more durable consumption categories. Still higher wage growth and government support measures are likely to partially support private consumption.
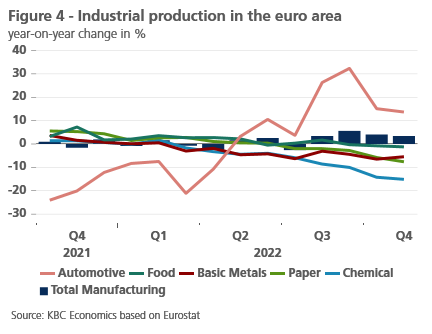
Industrial production seems resilient so far, although the more energy-intensive subsectors are significantly impacted. This is especially true in the chemical sector where production levels in Q4 were 15% lower than in the same period last year (figure 4). Overall, the manufacturing sector saw production increase by 3.4%, mainly due to a rebound in the automotive sector. And while new orders are falling sharply in the manufacturing industry, well-filled order books (partly due to remaining backlogs) will likely help prevent a real slump in activity in the coming months.
Our economic outlook for the euro area has not changed fundamentally. However, falling energy prices and some rebound in confidence indicators have prompted a small upward revision in the short-term outlook. Together with the revision of historical euro area real GDP figures, this raises the expected real average growth rate for 2023 from 0.2% to 0.4%. The moderate growth recovery from the second half of 2023 onwards puts our real GDP growth forecast for 2024 at 1.5%.
A surprisingly resilient US economy
Although soft indicators have been signalling that the US economy is headed for recession, hard data still point to a very resilient US economy. This is especially true for the labour market, which remains very tight. Hence, while business sentiment figures like the ISM and PMI indices have fallen below the key 50-points threshold, both job gains and the number of job openings remain at relatively high levels, indicating that the economy is still moving at a solid pace. On the back of the resilient US economic data, our GDP nowcast for Q4 2022 accelerated to 2.4% quarter-on-quarter annualised. This prompted us to revise up our final real GDP forecast for Q4 2022 and the whole 2022 year accordingly.
Moreover, we project that the relatively tight labour market and the fall in gasoline prices will continue to support real personal incomes and household consumption. Also, despite significant tightening of financial conditions, non-residential investment still supports overall domestic demand in the US economy. All in all, we have upgraded our outlook for real GDP growth in the first quarter of this year, but we still see a very mild technical recession later – triggered by the Fed tightening.
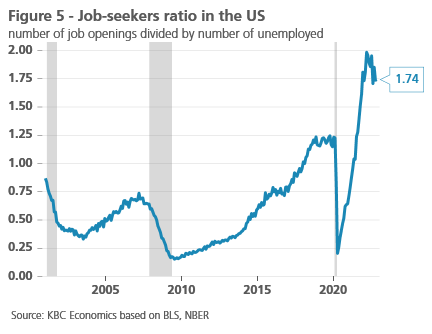
Obviously, the persistent labour market tightness complicates the calibration of monetary policy, which aims for a soft landing. Key labour market metrics such as the unemployment rate, the number of job openings relative to the number of unemployed (see figure 5) or the trend in initial or continuing jobless claims for welfare, suggest that even tighter financial conditions will be required to bring the economy to equilibrium. Higher real interest rates for a longer period of time could be necessary to bring about the desired labour market cooling, which in turn will ensure that wage pressures will not become persistent.
Political turmoil in Brazil
Only a few days after the inauguration of Lula Da Silva as Brazil’s new president, protesters – on pretext of fraudulent elections – aimed for several official buildings, including the Supreme Court, the Congressional building and the presidential palace. In response to the uprise, President Lula declared a federal security intervention in Brasilia that will remain in place until the end of January.
Maybe even more surprising than the attack itself was the speed at which financial markets shrugged off their concerns considering the incident as a one-off. Investor confidence in the months to come is likely to depend more on the usual external factors, like commodity markets movement and Fed policy decisions, and also on Brazil’s fiscal position. The latter has gained importance as President Da Silva’s transition team pushed a 32 billion USD expansion of public spending through parliament in December 2022. The government is expected to announce measures to offset this spending increase in the course of January 2023. If it fails to deliver on these offsetting measures and its promise to balance the budget, this could support fears of persistent inflation and financial instability.
Covid runs rampant in China
China is facing an overwhelming growth in Covid-cases as the government decided to lift its zero-tolerance-Covid policy at the beginning of December 2022 in response to the mounting social unrest. Testing requirements and travel restrictions have been relaxed or abolished, and infected people with only mild or no symptoms are now allowed to self-isolate instead of being held in centrally managed facilities. Official statistics on Covid-cases and deaths are increasingly unreliable as China has effectively stopped counting or introduced too stringent case definitions. However, indirect information suggest an overwhelming pressure on the medical infrastructure.
In view of this policy change, China faces the risk of a severe Covid wave. Following almost three years of strict containment measures, the overall population still has a relatively low natural immunity to the virus. The low (triple) vaccination rate (especially with the elderly) and the assumed lower effectiveness of the Sinovac-vaccine are cause for concern. With the Lunar New Year (Spring Festival) travel rush at the end of January on the horizon, many fear that an additional large infection wave is on its way.
A significant economic slowdown is therefore likely in the near term as surging infections and hospitalizations dampen consumer spending, affect consumer confidence and disrupt production. The combination of strict lockdowns in October and November and the chaotic abandonment of most containment measures in December after widespread protests have resulted in a low seasonally adjusted real GDP growth rate of 0% quarter-on-quarter in Q4 2022. This brought the average annual growth figure to 3%, a far cry from the government’s 2022 growth target of 5.5%.
Going forward, we expect economic activity to still be under pressure in Q1 2023 as surging infections and hospitalizations dampen consumer spending and disrupt factory activity. By the end of Q1, infection rates will die down and activity will start to rebound as the economy reopens and a series of policy measures supporting the real estate markets and project developers (including the shelving of the Three Red Lines policy) rebuild economic confidence. Important headwinds, including continued weak external demand, the historic property market slowdown and tighter global financial conditions, will continue to weigh on activity throughout the year. We therefore pencil in a still relatively modest real GDP growth figure of 4.4% in 2023.
All historical quotes/prices, statistics and charts are up-to-date, through 16 January 2023, unless otherwise stated. Positions and forecasts provided are those of 16 January 2023.