

Economic Perspectives February 2022

Read the full publication below or click here to open the PDF.
- The fourth-quarter GDP data signal that major economies remain on the recovery path, though there are notable regional differences in underlying growth dynamics. The latest high frequency data nonetheless point to some loss of momentum in early 2022, reflecting the rapid spread of the Omicron variant. In addition, the short-term Omicron drag interacts with a significant squeeze on purchasing power due to elevated inflation. At the same time, rising geopolitical tensions between Russia and Ukraine have come increasingly into the spotlight, threatening to upset global commodity markets.
- Euro area real GDP increased by 0.3% qoq in the final quarter of 2021, which puts full-year growth at a multi-decade high of 5.2%. Country-level Q4 GDP data reveals significant heterogeneity, with particularly boomy growth in Spain vs. an economic contraction in Germany. The softness in activity is expected to persist in the current quarter before growth visibly re-accelerates in the second quarter once the Omicron drag fades. Overall, we maintain our forecast for euro area real GDP growth of 3.5% in 2022 and 2.4% in 2023.
- The US economy expanded 1.7% qoq (6.9% annualised) in the fourth quarter, driven largely by inventory rebuilding. This led to annual average growth of 5.7% in 2021, the strongest annual pace in 37 years. Both pandemic- and inflation-related drags are set to put consumer spending on a weak trajectory, implying a material slowdown in growth in the first quarter of 2022. In contrast, the US labour market showed remarkable resilience to the surge in Omicron cases in January. All in all, we have downgraded the US growth outlook for 2022 from 3.6% to 3.3%, while keeping our 2023 growth outlook unchanged at 2.3%.
- Chinese GDP figures for the fourth quarter came in close to expectations at 4.0% year-over-year, leading to annual average growth of 8.1% for 2021. A decline in business sentiment indicators in January and an uptick in Covid cases that led to localized restrictions suggest activity is off to a sluggish start in Q1 2022. The policy stance has started to turn toward moderate easing, though authorities are unlikely to fully open the floodgates. Rather, the targeted measures are likely to be just enough to help GDP stay above 5% in 2022, which is close to most estimates of Chinese potential growth.
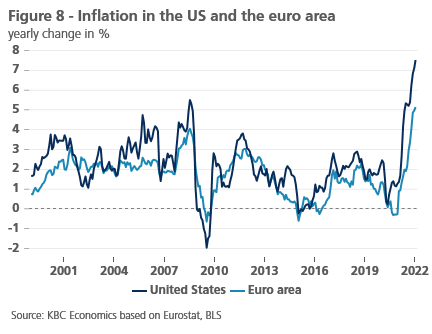
- Inflation has now reached the highest level in decades in many advanced economies. Inflationary pressures are particularly strong in the US, where supply-side forces are accompanied by significant demand-driven price pressures. In contrast, inflation in the euro area has so far been driven largely by high energy prices, and there is little evidence of elevated inflation feeding into wage growth. Overall, we maintain the view for a gradual deceleration of inflation in the course of 2022. However, tighter energy markets – consistent with our upgraded oil price outlook – are likely to keep inflation elevated for longer than previously envisaged, and risks are still tilted to the upside.
- We have upgraded our oil price outlook on the back of constructive fundamentals, highlighted by a sharp decline in global inventories. Since the start of the year, Brent crude has increased to $90 a barrel and we see a solid chance that oil could hit $100 a barrel for the first time since 2014. Altogether, we forecast oil prices to average $90 a barrel in 2022, with risks skewed to the upside.
- The march toward monetary policy normalisation continues amid elevated price pressures. The ECB communication turned more hawkish at its February policy meeting, which led us to bring forward the timing of lift-off. We now expect the ECB to hike its deposit rate by 25 bps by the end of 2022, followed by four 25 bps rate hikes in the course of 2023. Meanwhile, the Fed has pivoted toward an even more hawkish stance, implying a first rate hike already in March. In total, we pencil in five 25 bps rate increases this year, followed by four 25 bps hikes in 2023. We also expect the balance sheet run-off to start in June.
In 2021, the global economy staged a strong comeback from the Covid-19 recession . The latest fourth-quarter GDP data signal that major economies remain on the recovery path, though there are notable regional differences in underlying growth dynamics. In the US, economic growth re-accelerated towards the end of 2021, while the euro area witnessed a sharp slowdown in activity. For the full year, all major economies recorded impressive growth performances, largely reflecting the recovery from unusually low growth rates in 2020 due to the outbreak of the pandemic (figure 1).

A short-term Omicron drag in early 2022
The latest high frequency data nonetheless point to some loss of momentum in early 2022. The rapid spread of the Omicron variant has weakened business and consumer sentiment, suggesting a moderate drag on economic activity – mostly concentrated in the services sector – from late last year into the current quarter. At the same time, we expect the drag on activity to be relatively short-lived, since the Omicron wave has already peaked, or is about to peak across much of Europe and the United States (figure 2). This should set the stage for an economic rebound from the second quarter onwards, assuming a respite from further Covid-19 waves amid the evolution from the pandemic towards endemic.

Admittedly, with some parts of the world being still early in the Omicron wave, we remain concerned about the possibility of longer-lasting/more intensified supply chain disruptions weighing on activity in advanced economies. Global supply chains are particularly vulnerable to pandemic-related restrictions in Asia where some countries continue to pursue a zero-tolerance policy. Most recently, we have seen tentative signs that supply chain disruptions have peaked, yet the risk of negative spillovers from Asia – where some of the key manufacturing hubs are located – to other regions of the world economy remains significant.
Elevated inflation squeezing purchasing power
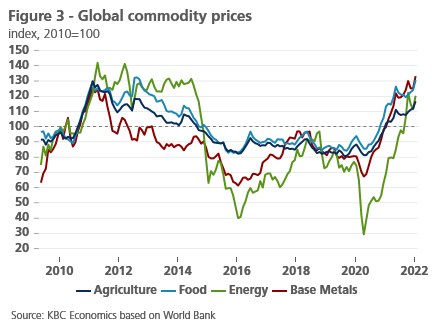
The Omicron wave interacts with a substantial squeeze on purchasing power due to elevated inflation in the past months, exacerbating a pullback in consumer confidence and weighing on household spending. Indeed, inflationary pressures have become more pronounced and broad-based than expected, though rising energy prices remain an important driver of the high rate of inflation across advanced economies. More specifically, Brent crude has now surged to a 7-year high of $90 a barrel, while European natural gas prices remain elevated, both reflecting the lowest inventory levels in many years.
In addition, agriculture prices have risen sharply due to poor harvests and increasing costs for fertilizer and transportation, leading to higher food price inflation across the global economy (figure 3). With agricultural prices now at the peak last seen during the Arab Spring in 2011, this has become especially relevant for many low- and middle-income emerging markets, where rapidly rising food prices are not only threatening to intensify mounting inflationary pressures but also social and political stability.
Geopolitical tensions in the spotlight
At the same time, rising geopolitical tensions between Russia and Ukraine have come increasingly into the spotlight, threatening to upset global commodity markets. It is hard to foretell how the situation will evolve in the coming weeks as multiple scenarios, ranging from a diplomatic de-escalation to a large-scale military conflict, are possible. If an escalation should occur, economic sanctions against Russia would likely to be at the forefront of Western allies’ response, further strengthening the sanction regime in place since 2014. A broad array of severe sanctions could be considered, including those against Russian government officials, sectoral sanctions (e.g. energy and financials), as well as the possibility of the exclusion of Russian counterparties from the international payments system SWIFT.
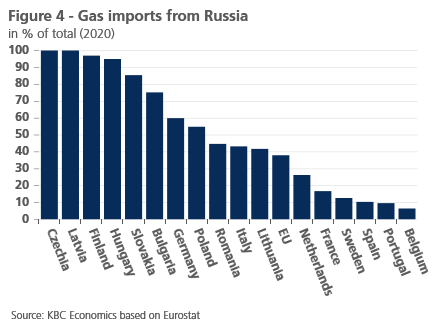
With Russia being a commodities powerhouse, a military conflict in Ukraine could lead to a significant tightening of commodity markets. Natural gas supplies are most exposed to any disruptions, not least due to the exceptional tightness of European gas markets. Russia has historically been the EU’s largest supplier of natural gas, making up around 40% of gas consumption, though the exposure varies markedly across member states (figure 4). In an unlikely scenario of a complete halt of Russian flows to Europe (e.g. in retaliation to sanctions), the EU would need to resort to a combination of increased LNG imports (to the extent possible given the size of the global LNG markets and the EU’s import capacity) and emergency demand-side measures, such as industrial gas curtailments, implying substantial disruptions and costs for the economy.
Euro area: output back at pre-virus level
The preliminary flash estimate showed that euro area real GDP increased by 0.3% qoq in the final quarter of 2021, which puts full-year growth at a multi-decade high of 5.2%. As a result, euro area GDP has now recovered back above the pre-pandemic level of output, though there remains significant cross-country variation. The fourth-quarter GDP data nonetheless marks a sharp slowdown compared to the boomy 2.3% qoq growth seen in the third quarter, reflecting the resurgence of Covid-19 (and renewed mobility restrictions), together with persistent supply bottlenecks dampening industrial output.
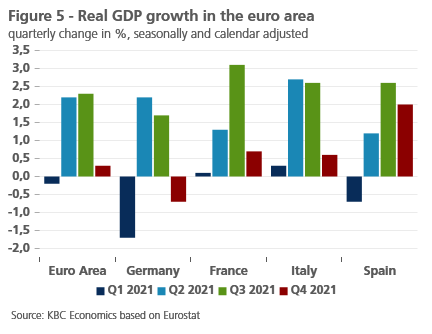
Country-level Q4 GDP data reveals significant heterogeneity, which is consistent with the differences in the timing and severity of the latest infection wave (figure 5). Real GDP growth surprised to the upside in Spain and France at 2.0% qoq and 0.7% qoq, respectively. Still, Spain remains the main laggard in the recovery with its output at 96% of the pre-virus level. Meanwhile, the Italian economy expanded by 0.6% qoq, while real GDP growth in Germany disappointed and contracted by 0.7% qoq, owing not only to the adverse pandemic developments but also to the high exposure to global supply chain disruptions.
The softness in activity is expected to persist in the current quarter before growth in the euro area visibly re-accelerates in Q2 once the Omicron drag fades. Indeed, the recent survey data signal weak activity, highlighted by another pullback in consumer confidence in January. However, the overall decline was moderate, leaving the index only a touch below its pre-pandemic level and indicating that the hit to households from the Omicron wave and elevated inflation has so far been rather modest.
In addition, the January PMIs confirmed that Omicron is weighing on business activity, especially in the services sector. Still, services are holding up relatively well given the fact that, on balance, less stringent mobility restrictions are put in place. Moreover, we believe that the services sector is well positioned for a rebound once restrictions are gradually relaxed amid a more favourable health situation. Meanwhile, activity in manufacturing remains well established in expansionary territory, and even accelerated moderately in January, suggesting some easing of supply chain bottlenecks.
Overall, our growth outlook for the euro area remains largely unchanged. A somewhat higher carry-over into 2022 is offset by moderate downward revisions to the near-term growth dynamics. The latter reflects our view of a moderate drag on consumer spending from elevated inflation. On an annual basis, we maintain our forecast for euro area real GDP growth at 3.5% in 2022 and 2.4% in 2023.
US: strong growth boosted by inventories
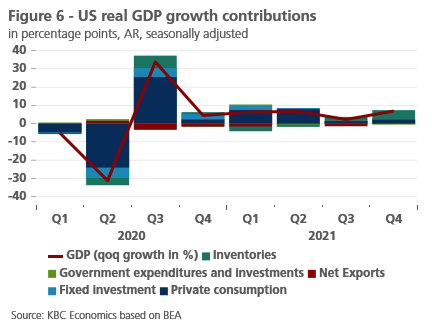
The US economy expanded at a 6.9% annualised rate in the fourth quarter, significantly beating market expectations and leading to an annual average GDP growth rate of 5.7% in 2021 (the strongest annual pace in 37 years). The acceleration in headline growth in the fourth quarter was largely driven by inventory rebuilding, which added 4.9 percentage points to overall GDP growth. Growth was also supported by services-led personal consumption, and to a lesser extent by business fixed investment. Finally, government spending was the sole significant drag on fourth-quarter growth (figure 6).
Looking at the first quarter of 2022, there are early signs of a slowdown in the US economy, though hard data so far remains limited. The Omicron variant hit activity already in December and this carried through into January, putting consumer spending on a weak trajectory. In addition, the recent rise in energy prices, together with the expiration of the expanded child tax credit indicate a substantial squeeze in purchasing power. Both pandemic- and inflation-related drags are reflected in the January readings of consumer confidence, with the sentiment barometer reported by the University of Michigan slipping to its post-pandemic low.
Business sentiment indicators in the US also suggest that real GDP growth is poised to moderate substantially in the first quarter. Activity in the services sector weakened more than expected in January, with the services PMI index hitting its lowest level since July 2020. On a similar note, the ISM services index moderated further from November’s record high amid a rapid rise in Omicron infections, though it remained well above the 50-point mark indicating expansion. Sentiment in the manufacturing sector also took a step down in January, with the headline PMI index now down for six straight months.
Meanwhile, the US labour has shown remarkable resilience to the surge in Omicron cases in early 2022. The economy added 467,000 jobs in January, well above consensus expectations of 125,000, and followed massive upward revisions of 709,000 jobs to November and December (related to the benchmark revisions and population adjustments). The headline unemployment rate rose marginally to 4.0% due to higher labour force participation (up 0.3 pp to 62.2%). Importantly, average hourly earnings jumped to 5.7% yoy, signalling particularly strong wage growth amid tight labour market conditions.
All in all, we expect the US economy will hit a soft patch in the early months of the year amid the temporary Omicron drag. Compounded with some unwinding of inventory accumulation, we have therefore downgraded our growth outlook for the first quarter. The US economy is then expected to rebound and maintain strong momentum in the remainder of this year. This has led us to lower the US growth outlook for 2022 from 3.6% to 3.3%, while keeping our 2023 growth outlook unchanged at 2.3%.
China: 2022 growth close to potential
Chinese GDP figures for the fourth quarter came in close to expectations at 4.0% year-over-year, leading to annual average growth of 8.1% for 2021. The year-over-year figure points to a substantial slowdown in Chinese growth particularly relative to pre-pandemic levels. In general, the relative contributions to growth in the fourth quarter reflect the overall trend for 2021 — net exports provided an outsized contribution thanks to strong external demand, while consumption continued to recover but not enough to compensate for weaker investment growth (figure 7).

A decline in business sentiment indicators in January and an uptick in Covid cases that led to localized restrictions suggest activity is off to a sluggish start in Q1 2022. With negative headwinds from the real estate sector still hanging over the economy (residential real estate prices have declined every month from September-December 2021 on a month-over-month basis), the policy stance has started to turn toward moderate easing, both on the fiscal and monetary fronts. While the combination of interest rate cuts, increased issuance of local government bonds, and guidance to financial institutions to improve credit provisioning should bolster economic activity to some extent, policymakers are still keen on tackling financial stability risks and overleverage in the economy. As such, they are unlikely to fully open the floodgates. Rather, the targeted measures are likely to be just enough to help GDP stay above 5% in 2022, which is close to most estimates of Chinese potential growth. Given uncertainties related to the real estate sector, however, risks are tilted to the downside.
Inflation: a surge in energy prices
Inflation has now reached the highest level in decades in many advanced economies (figure 8). Although there are notable cross-country differences in the strength of inflation, a number of global factors, including elevated energy prices and supply chain disruptions, continue to play an important role. Inflationary pressures are particularly strong in the US, where supply-side forces are accompanied by significant demand-driven price pressures. In contrast, headline inflation in the euro area has so far largely been driven by high energy prices and global supply bottlenecks, and there are few signs of elevated inflation feeding into wage growth.
Admittedly, the inflation outlook still remains subject to elevated uncertainty and near-term upside risks. Against our expectations, there is no evidence yet of a turn in inflation momentum in early 2022. Energy prices will largely, albeit not exclusively, determine the course of inflation this year, and while we maintain the view of a gradual deceleration path across advanced economies, tighter energy markets are likely to keep headline inflation elevated for longer than we previously assumed.
This view is consistent with our upgraded oil price outlook, which envisages significantly higher oil prices in 2022. Since the start of the year, Brent crude has increased to $90 a barrel and we see a solid chance that oil could hit $100 a barrel for the first time since 2014. The oil market has been bolstered by constructive fundamentals, highlighted by a sharp decline in global inventories. On the one hand, this reflects robust oil demand, driven by incremental gains in the US, where oil consumption is currently trending at an all-time high, despite rapidly rising Omicron cases. We expect global oil demand to recover further in the year and reach its pre-pandemic level by late 2022.
On the supply side, the OPEC+ alliance maintains its scheduled 400,000 barrels per day output hikes. However, some member states are increasingly unable to keep the pace of output increases due to capacity constraints. At the same time, the US shale response to a higher oil price environment remains relatively subdued, leaving the supply side of the market less flexible. Overall, we expect oil prices to average $90 a barrel in 2022, up from $71 a barrel seen last year. With short-term risks being tilted to the upside, the oil market appears particularly vulnerable to supply disruptions given a low supply cushion.
According to the flash release, euro area headline HICP inflation increased to 5.1% yoy in January, defying our expectations of a meaningful deceleration. The significant upside surprise appears to be driven by energy prices, and to a lesser extent by core inflation (2.3% yoy). This implies that negative technical effects – such as the German VAT effect dropping out – were more than offset by energy shock pass-through (i.e., the receding base effect for energy prices has yet to materialise). Importantly, as the January inflation reading is generally subject to a lot of noise due to changes in administered prices, we look for the final HICP release on February 23 when more details will be available.
Taking on board the January upside surprise and our upgraded oil price scenario, we have lifted our euro area headline inflation forecast from 2.7% to 3.6% in 2022. Our 2023 inflation forecast was revised downward from 1.9% to 1.6%, reflecting the higher base in the previous year. At the same time, we believe the risks to euro area inflation are, on balance, still strongly skewed to the upside. More specifically, these include higher energy prices than we currently pencil in, as well as the possibility of second-round effects from elevated headline inflation to wage growth.
In the US, inflation surprised to the upside again in January, rising to 7.5% yoy on the back of higher energy, food, and housing costs. In month-over-month terms, inflation remained steady at 0.6% after several months of deceleration. Notably, the cost of new cars did not increase month-over-month for the first time in 10 months while used car prices accelerated less than in December. This gives an encouraging signal that price pressures stemming from supply chain disruptions may begin to ease in the coming months, as the chip shortage has been an important drivers of higher car prices since late-2020. However, risks to the US inflation outlook remain titled to the upside due to energy price developments. Given our revised oil price outlook and the higher January inflation figure, we now expect annual inflation to reach 4.2% in 2022 before trending back down to 2.2% in 2023.
Central banks: the march toward policy normalisation
The march toward monetary policy normalisation continues amid growing price pressures. At its first policy meeting of the year, the ECB marked the start of the central bank’s U-turn on inflation. Hints are subtle for now, but financial markets appear to read them well. In the policy statement, the ECB changed its readiness for two-sided policy action into a focus on ensuring that inflation stabilises at the 2% target over the medium term. The governing council was unanimously concerned about the latest euro area HICP readings and, for the first time since 2014, shifted the risks surrounding its inflation forecasts from balanced to tilted to the upside, especially in the short-term.
All this suggests a thorough review of inflation dynamics at the March policy meeting at which new ECB inflation forecasts will be available. Special focus will be placed on the 2023 inflation outlook which could be raised from 1.8% (as projected in December 2021) to above 2.0%. Another two years of above headline inflation could then be the go-ahead for the official policy turn. Interestingly, President Lagarde on two occasions refused to rule out policy rate hikes this year. Simultaneously, she stressed the importance of the sequencing principle: first end net asset purchases, next hike policy rates.
The combination of both indicates that the ECB contemplates accelerating the taper process in order to be able to hike interest rates this year. At the December policy meeting, the ECB announced that net asset purchases under the Asset Purchases Programme (APP) would run at least until the end of 2022, and that they would be raised in Q2 (to EUR 40 billion/month) and Q3 (to EUR 30 billion/month) to compensate for the termination of the Pandemic Emergency Purchase Programme (PEPP) in March.
Against this backdrop, we are bringing forward the timing of the lift-off and now expect the ECB to hike its deposit rate by 25 bps by the end of 2022, followed by four 25 bps rate hikes in the course of 2023, bringing the deposit rate to 0.75% at the end of 2023.
In recent months, the Fed has pivoted toward an even more aggressive path to exit its ultra-accommodative monetary policy stance. At the January policy meeting, Fed Chair Powell sounded a lot more serious about fighting elevated inflation, and the central bank signalled that an interest rate lift-off ‘will soon be appropriate’. This is consistent with our view that the Fed will start hiking policy rates at its March meeting, although the jury remains out on the size of that first hike.
We stick with our 25 bps rate hike call but acknowledge the upside risk of a 50 bps move. In total, we pencil in five 25 bps rate increases this year, followed by four 25 bps hikes in 2023. This implies a bold and sharp tightening cycle, resulting in a peak policy interest rate of 2.5% (upper bound) already next year. The Fed has also published some high-profile guidelines on the roll-off of its balance sheet, but the central bank has not committed to a specific timing or pace yet. We now expect the run-off to start in June and assume that the balance sheet normalisation will not derail the tightening cycle.
All historical quotes/prices, statistics and charts are up to date, through February 7, 2022, unless otherwise noted. The positions and forecasts provided are those of February 7, 2022.