Overhang effect masks 'real' growth of Belgian economy


According to the flash estimate by the National Accounts Institute (NAI), Belgian economic growth slowed to 0.30% in the first quarter of 2022 from 0.43% in the last quarter of 2021. This is the percentage change in real gross domestic product (GDP) compared to the previous quarter (so-called quarter-on-quarter growth). The slowdown in growth was expected (our estimate was 0.20%) against the background of the outbreak of war in Ukraine in the second half of the quarter. After the still positive figure in Q1, KBC Economics expects quarterly growth to fall back to -0.10% and 0.0% in Q2 and Q3 respectively, before rebounding to 0.20% in Q4.
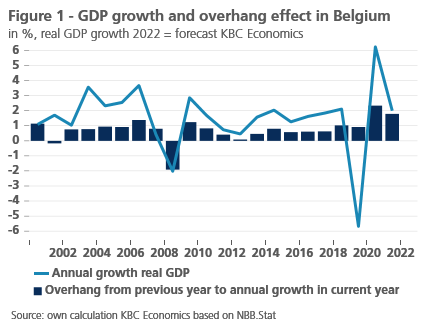
If our forecast for the quarterly growth path in 2022 holds, GDP growth for the full year 2022 will be 2.0%. This annual growth rate is the percentage change in real GDP realised in a full year compared to that of the previous year. At first glance, this figure is not too bad and gives the impression that the overall impact of the war in Ukraine on the economy will be limited. After all, the average annual growth rate of the Belgian economy in the period 2000-2021 was only 1.6%. Yet the expected 2.0% growth rate for 2022 does not measure the real pulse and dynamism of the economy. This is because the figure is largely distorted and inflated (by 1.8 percentage points) by a large carry-over effect from 2021.
It is not what it seems
This statistical carry-over (also called overhang) reflects how much of the current year's annual growth has already been 'acquired' purely as a result of quarterly GDP dynamics during the previous year. In other words, even if quarter-on-quarter growth in all quarters of the current year were to be 0% each time (i.e. GDP in the four quarters is maintained at the level of the fourth quarter of the previous year), annual growth in the current year will still be positive or negative if there were GDP fluctuations (e.g. a positive or negative quarterly growth path) in the previous year. The overhang reflects the size of this effect. When there are large movements in the quarterly GDP path in the previous year, this may generate a large (upward or downward) carry-over effect, which obscures the information value of the annual growth measure for the current year.
In normal circumstances, the overhang does not change that much from year to year and does not distort the picture painted by the annual growth figures as much. Over the period 2000-2021, the overhang in Belgium averaged 0.8 percentage points (see Figure 1). Around crisis periods, such as during the dotcom crisis, the financial crisis, the EMU-debt crisis and the covid crisis, the effect often deviates strongly from that average. The carry-over effect from 2021 to the annual growth rate in 2022, which we already know, is also relatively high at 1.8 percentage points. The reason why this already acquired growth is so high is that quarterly growth picked up strongly through 2021. The high overhang for growth in 2022 is not typical of Belgium: for the euro area as a whole, it is 1.9 percentage points.

The message of this article is that we should put the expected 2.0% annual growth rate for the Belgian economy in 2022 into perspective. Indeed, the figure gives the impression that the economy is still doing (above average) well, despite the deteriorating conditions due to the war in Ukraine. Indeed, underlying this overall still good figure is weak 'real' growth, which is reflected in the expected weak quarterly growth path throughout the year. A few quarters of negative or zero growth are likely (see above). If our scenario comes to pass, the average of the four quarterly growth rates in 2022 will be just 0.1%. This compares with 1.4% in 2021 and an average of 0.4% for the years 2000-2021.
