
Regional economic growth in Belgium: looking back at 2024 and forecast 2025-2026

Content table:
- 1. Introduction
- 2. Regional growth before 2024
- 3. Regional business cycle in 2024
- 4. Outlook regional growth in 2025 and 2026
Read the publication below or click here to open the PDF.

The growth rates published annually by the National Accounts Institute (NAI) for Flanders, Wallonia and Brussels lag behind the publication of the Belgian growth rate. So, for the time being, we do not know to what extent growth in 2024 (which for Belgium was at 1.0%) differed between the three regions. In this report, we first briefly discuss the regional growth trends in the years before 2024. To estimate regional growth in 2024, we rely on regional business cycle and labour market indicators that are available for 2024. We also estimate regional growth in 2025 and 2026, and more specifically the impact the regions may experience from the tariff war and from the European fiscal stimulus (from Germany as well as through the EU Readiness 2030 plan). Our analysis shows that growth in Flanders and Wallonia in 2024 may not have been so different. In Brussels, lower production at the Audi plant in Forest may have caused growth in 2024 to again be lower than in the other regions. Looking ahead, we think that, in the shorter term, Flanders will be affected more than Wallonia by the tariff war and related uncertainty. Moreover, the Walloon traditional arms industry may benefit somewhat faster and more in the short term from higher defense spending. As a result, growth will likely be higher in Wallonia this year (around 1.0%) than in Flanders (rather towards 0.5%). The Brussels economy will be affected by the closure of the Audi factory in 2025, contributing to a lower growth rate (around 0.5%). Once the German budgetary stimulus gains momentum and the more high-tech Flemish defense industry also begins to benefit more from higher spending, growth in Flanders is likely to outpace that in Wallonia.
Early this year, the National Accounts Institute (NAI) published new figures on the Regional Accounts in Belgium. These give a picture of how the three regions - Flanders, Wallonia and Brussels - have performed in recent years in terms of economic growth, or the growth of their "real gross regional product". These regional growth figures are only available on an annual basis (so no quarterly figures) and lag far behind the publication of the national GDP figures. For Belgium as a whole, we now know that real GDP grew by 1.0% in 2024. For the three regions, the historical figures (including the recently published update) extend only to 2023 and, for the time being, it is not clear to what extent economic activity grew there differently in 2024.
Based on the already known national growth rate and various regionally available business and labour market indicators for 2024, we can try to estimate regional growth last year. In section 2 of this report, we first highlight the historical growth trajectory of Flanders, Wallonia and Brussels in the years before 2024. The NAI makes the regional growth figures available on the NBB website for the period 2003-2023. The older growth rates before 2003, which we will show in the figures in section 2, come from KBC Economics' database and are based on older systems of accounts than the current ESA 2010 (European System of Accounts) standard. In section 3 of the report, we discuss the evolution of available regional business and labour market indicators in 2024. That analysis allows us to estimate growth in the three regions in 2024. In section 4 we look ahead and make a rough forecast of regional growth in 2025 and 2026. The question here is to what (different) extent economic activity in the three regions will be impacted by the prevailing tariff war and related uncertainty on the one hand and the European fiscal and military stimulus on the other.1
2. Regional growth before 2024
Flanders increases growth lead in 2020-2023
In the period from 2000 to 2019, the year before the outbreak of the pandemic, the systematic growth lead recorded by Flanders versus Wallonia in the second half of the last century narrowed. In the first decade (2000-2009), the average growth differential of Flanders versus Brussels also narrowed, but in the second decade (2010-2019) that differential widened again (see figure 1). On balance, in 2000-2019, real gross regional product in Flanders, Wallonia and Brussels grew at an average annual rate of 1.9%, 1.7% and 1.3%, respectively.2
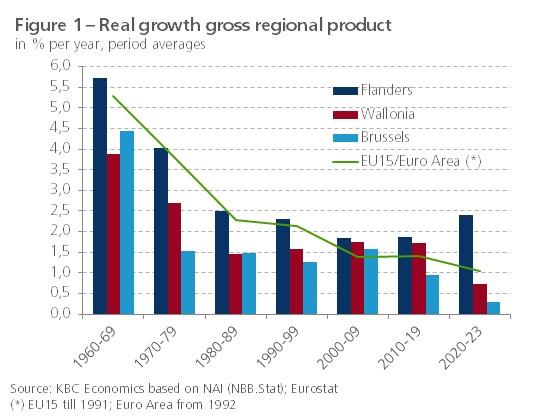
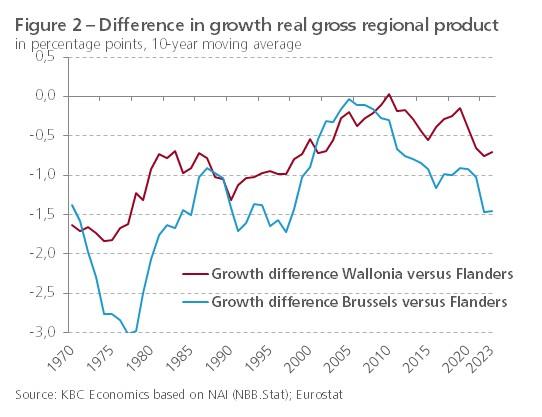
Since the 2020 pandemic year, the growth lead that Flanders recorded before 2000 compared to the other two regions came back strongly. In the years 2020-2023, growth in Flanders averaged 2.4% per year, compared with only 0.7% and 0.3% respectively in Wallonia and Brussels. That the regional growth differentials have deepened again in recent years is also illustrated in a slightly different way in figure 2, which shows the annual growth differentials of Wallonia and Brussels respectively with Flanders, calculated as the 10-year moving average to remove the volatility in the annual figure series. Especially striking is the increasing growth differential between Flanders and Brussels.
Different dynamics during crisis periods
Figure 3 shows the evolution of regional economic activity by index using 2008 as the base year. The series illustrate how the regions experienced the different crises during the past decade and a half and the recovery that followed. Brussels, compared to the other two regions, emerged less firmly from the Great Recession in 2009. Most striking regarding Brussels is its much lower average growth than Flanders and Wallonia during the period of economic recovery between 2014 and 2019, following the European sovereign debt crisis of 2012-2013. Part of the explanation lies in the March 2016 terrorist attacks at Zaventem airport and in the Brussels metro. These then hit the hospitality, retail and leisure sectors hard, resulting in negative growth in the Brussels economy that year.
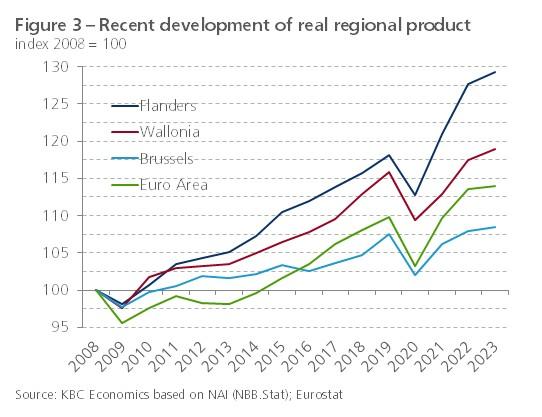
The growth differential between Flanders and Wallonia in the period 2008-2019 is partly explained by different dynamics of economic activity during the sovereign debt crisis of 2012-2013. Flanders then continued to grow at a limited rate, while the Walloon economy stabilised and continued to perform weaker in the following years. That Walloon growth did not differ much from that in Flanders on average in 2008-2019 is due to the relative growth spurt Wallonia experienced in the years just before the pandemic. The Walloon economy grew 3.0% and 2.6% in 2018 and 2019, respectively, while Flemish growth was 1.5% and 2.1% at the time.
More recently, the pandemic caused economic activity to contract less in Flanders (-4.5%) in 2020 than in Wallonia and Brussels (-5.5% and -5.1%, respectively). The recovery in 2021-2022 was also significantly stronger in Flanders than in Wallonia and Brussels. Growth in that region even reached record highs in 2021 (7.2%) and 2022 (5.5%), driven in part by vaccine production in the pharmaceutical industry. As a result, economic activity in Flanders was already well above pre-pandemic levels by 2021. This was not the case in the other regions until a year later. In 2022, Walloon growth (4.1%) was only slightly below Flemish growth (5.5%), while Brussels in particular again lagged behind (1.7%). This also remained true in 2023 (the latest regional growth figure available). That year, growth slowed noticeably in all three regions, mainly due to a normalisation of activity after the pandemic. The slowdown was greater in Flanders and Wallonia, although growth there remained higher than in Brussels (0.5%) at 1.3% and 1.2%, respectively.2
Regional employment and productivity growth
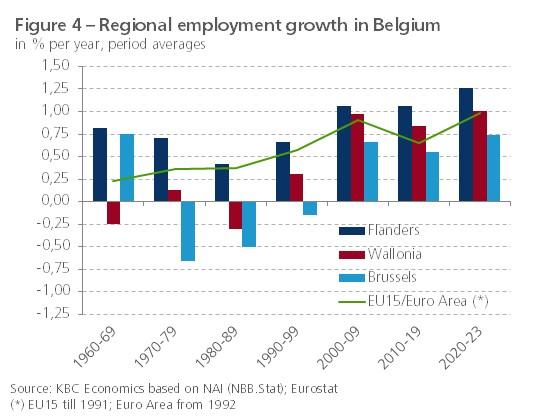
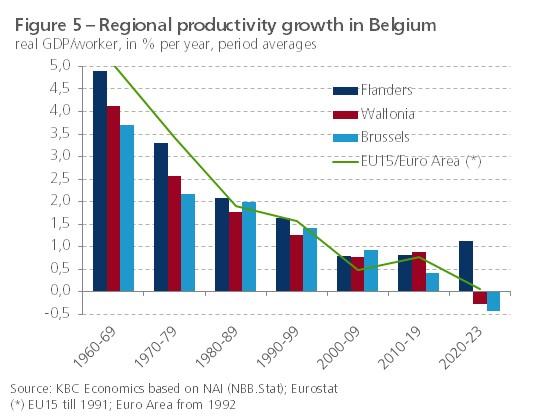
Simply put, economic growth is the sum of employment growth and labour productivity growth (expressed per person employed). Both employment and productivity growth contributed to Flanders' relatively stronger economic growth in the recent period (2020-2023). At an average of 1.3% per year, employment growth in Flanders was higher than in Wallonia (1.0%) and Brussels (0.7%). This further confirmed the regional gap in job creation that already existed in previous decades (see figure 4). More than employment growth, the relatively stronger growth in Flanders since 2020 was due to the relatively strong growth in labour productivity in that region (see figure 5). This manifested itself especially in 2021-2022. In Wallonia and Brussels, productivity growth was even negative on average in 2020-2023. In Brussels, productivity growth was significantly weaker earlier, in 2010-2019, which helps explain the significantly weaker economic growth in the capital region since 2010.
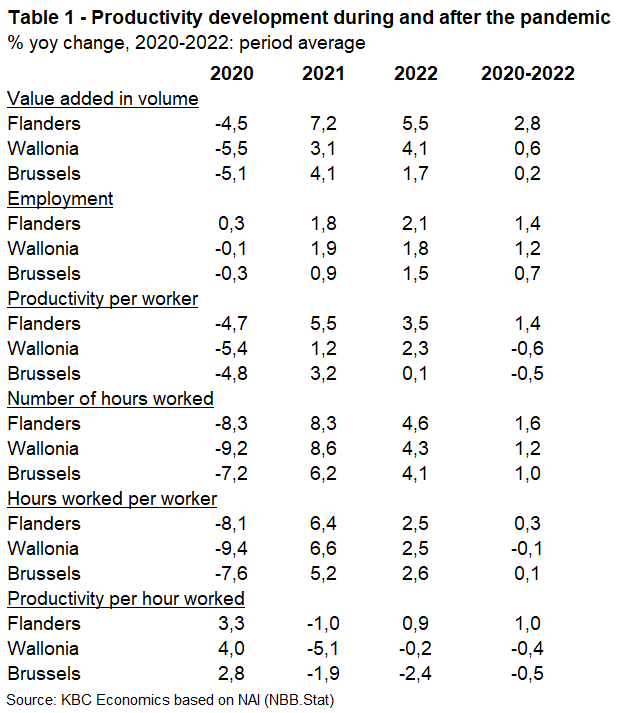
The pandemic and the recovery that followed had a major impact on productivity rates. The sharp loss of economic activity in 2020 was mainly associated with a particularly pronounced decline in the number of working hours, much less in an adjustment in employment, which was well preserved thanks to relaxed access to the temporary unemployment system. While labour productivity per worker fell sharply due to the limited reduction in the number of workers, there was a marked increase in labour productivity per hour worked (see table 1). This was somewhat stronger in Wallonia than in Flanders and Brussels. This trend experienced a reversal in 2021. Especially in Wallonia, hourly productivity fell sharply. While Flanders recorded productivity gains again in 2022, hourly productivity continued to decline in the other two regions that year.3 Due to temporary shifts in the sectoral composition of economic activity and employment during the pandemic period, as well as the temporary effect of vaccine production in Flanders, the evolution of productivity figures since 2020 should be interpreted with caution.
3. Regional business cycle in 2024
Growth in the Belgian economy slowed to 1.0% in 2024, coming from 1.2% growth in 2023. Despite the slowdown, Belgium continued to outperform the euro zone, where growth was at 0.7% in 2024. With three consecutive years of stronger growth compared to the euro area, Belgium's performance was relatively good. That said, 2024 was another tough year for Belgian industry. Activity in the sector contracted by 1.0% in real terms, while that in services and construction grew by 1.4% and 0.6%, respectively. Continued weak housing investment did keep the residential construction subsector in the slump in 2024. Broadly speaking, Belgian growth throughout 2024 was supported by final domestic demand, while net exports did not contribute and inventory change weighed heavily on growth.
Because no regional growth figures are yet available for 2024, for the time being we do not have a clear view of how the three regions have performed in relative terms in that year. In order to sketch out a picture, we make use of various economic and labour market indicators for which 2024 figures have been published on a monthly or quarterly basis. We discuss the regional figures for consumer and producer sentiment, the labour market, and industrial and construction activity.
Regional confidence indicators
Consumer and producer confidence are traditional business cycle indicators that are also available at the regional level for Flanders, Wallonia and Brussels on a monthly basis. Because there are important, long-run level differences between the raw time series for the three regions, we rescaled both confidence indicators for each region as standard deviations from the long-term average.
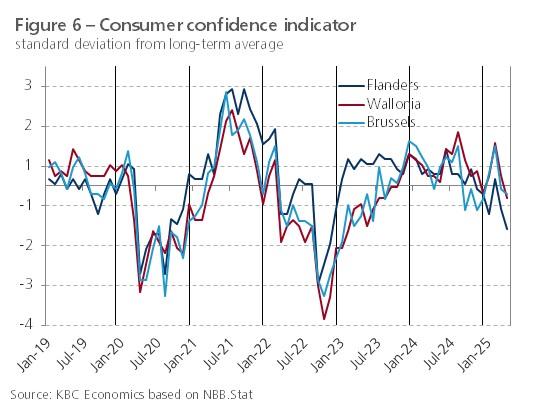
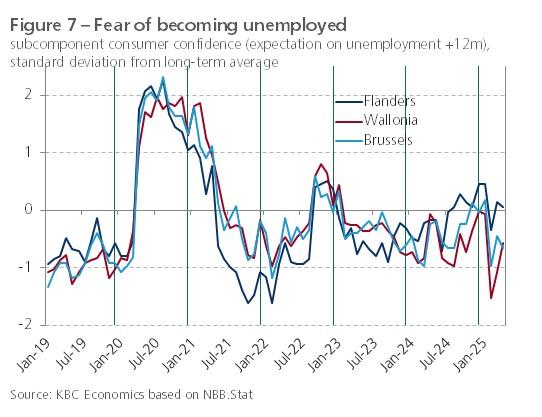
Figure 6 shows that consumer confidence in Flanders not only climbed faster out of the pandemic in 2020-2021, but also continued to record higher than that in Wallonia and Brussels during the downturn in 2022 following Russia's invasion of Ukraine. More recently, in 2024, after peaking in the summer, the indicator fell back in all three regions. In Flanders, it was slightly earlier. By the end of 2024, consumer confidence was below its long-term average in all three regions. Similarly, the subcomponent reflecting unemployment expectations for the next 12 months toward the end of 2024 indicated increased fear of unemployment among citizens everywhere (see figure 7). The all in all fairly similar trends in regional consumer confidence figures suggest that consumption dynamics may not have been so different for the three regions in 2024.
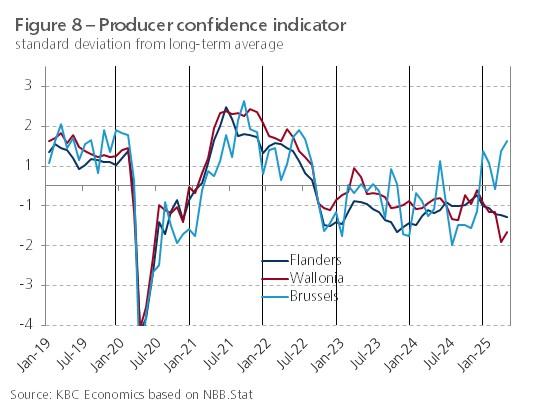
The relative course of producer confidence has not mirrored that of consumers in recent years (see figure 8). This time, the confidence of Brussels businesses in particular lagged somewhat during the recovery from the pandemic. In recent years, producer confidence in Brussels has been very volatile, which complicates the interpretation of the indicator in the region. The confidence of Flemish and Walloon companies climbed out of the pandemic fairly evenly, but from mid-2021 to mid-2024, producer confidence in Wallonia did register above that in Flanders. The fact that the confidence of Flemish companies was affected by the Ukraine and energy crisis more than that of Walloon ones may have to do with the fact that Flanders has a more open and energy-intensive economy than Wallonia. Producer confidence remained below its long-term average in both regions in 2024. Towards the end of the year, however, there was a noticeable difference between Flanders and Wallonia on the one hand, where confidence began to deteriorate, and Brussels on the other, where confidence rebounded sharply.
Regional labour markets
We can check the evolution of effective unemployment in the three regions on the basis of the dynamics of the number of non-working job seekers registered with the regional employment services (VDAB, Forem and Actiris). Figure 9 shows the annual change of that group, so that seasonal effects are removed. During the pandemic, it peaked slightly higher in Flanders in the spring of 2020 than in Wallonia. In Brussels, that peak fell later and was also much more limited. During the economic recovery in 2021, the number of unemployed job seekers did fall much more sharply in Flanders than in Wallonia and Brussels. In early 2022, the dynamics in all three regions turned negative again in the wake of the Ukraine and energy crises. In Flanders and Brussels, the year-on-year change in the number of job seekers only turned positive again later in 2022. In Wallonia, it was as early as May of that year. In 2023, there was a remarkably strong climb in the year-on-year change dynamics in Flanders, but it stopped again during 2024. At the end of 2024, the annual increase in the number of unemployed in Wallonia was still close to 7%. In Flanders and Brussels, that rate was significantly lower.
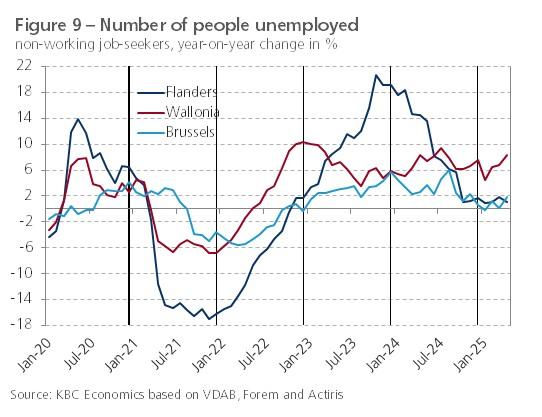
Apart from possibly different cyclical influences, the regional differences in the dynamics of the number of non-working job seekers have been influenced in recent years by changed regulations in registration in the regions. For example, in Flanders, a number of measures were taken that expanded the VDAB's scope of action, including the mandatory registration as a job-seeker of tenants of social housing (since January 2023). More generally, the strong increase in the Flemish figures in 2023 was due to the registration as a job-seeker of more and more people who were not previously professionally active. These include people on a living wage or sickness benefit, or those who have integrated. This creates a distortion in the dynamics of the unemployment figures, so that care must be taken to use them as a business cycle indicator.
Monthly figures on regional unemployment rates are also available, published by the regional employment services and also based on non-seasonally adjusted administrative data. Figure 10 shows that the unemployment rate climbed higher in every region since mid-2022 (a bit later in Brussels). In Flanders, the rate rose from an average of 5.7% in 2022 to an average of 6.6% in 2024, in Wallonia from an average of 12.9% in 2022 to an average of 14.5% in 2024, and in Brussels from an average of 14.2% in 2022 to an average of 14.6% in 2024. Note that, like the administrative figures on the number of unemployed, the administrative figures on the unemployment rate are also distorted by policy measures. Therefore, it is useful to also look at regional unemployment rates based on the Labour Force Survey (LFS, see figure 11). Based on this different definition, the rate rose in recent years in Flanders, from 2.9% in 2022 to 3.3% in 2024, while in Wallonia, after a jump in 2021, it fell to 7.1% in 2024.
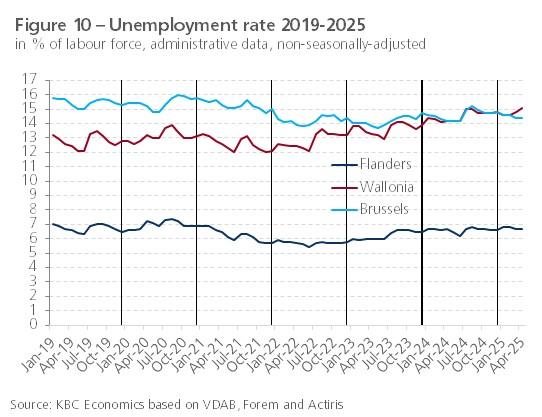
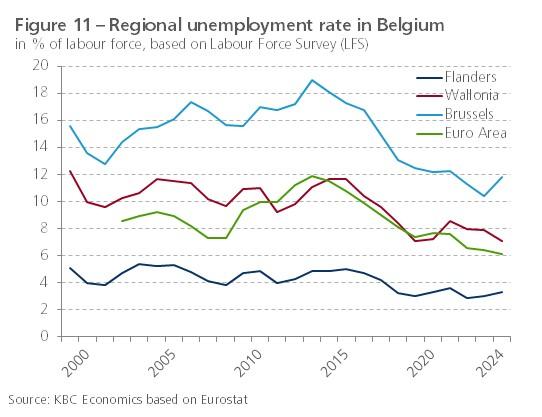
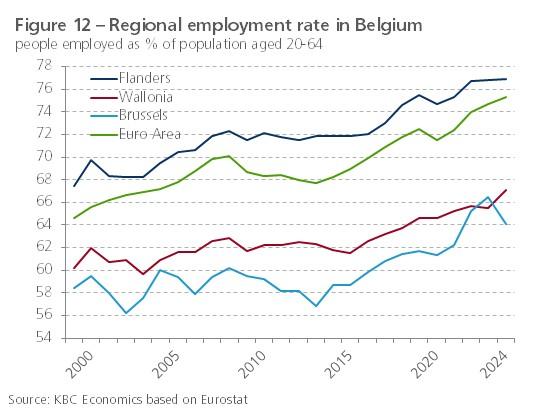
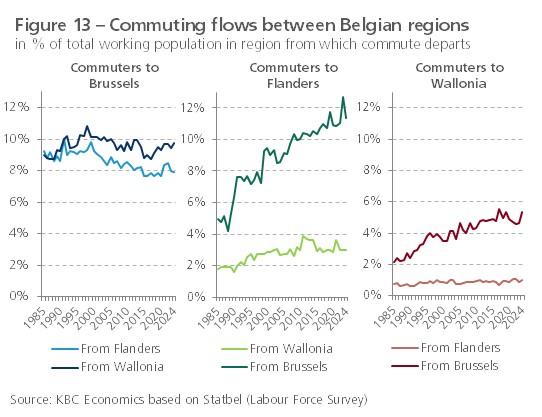
The Brussels figures showed a striking evolution over the past decade and a half. The lower average employment growth in Brussels in 2009-2022 compared to the other two regions also translated into relatively worse dynamics of the unemployment rate and employment rate (i.e. the share of employed people within the working-age population) in that region until 2013 (see figures 11 and 12). During the 2008-2013 financial crisis, both rates deteriorated more there. Remarkably, the labour market situation in Brussels did improve significantly since then, allowing the gap with Flanders and Wallonia to be reduced. In terms of employment rate, Brussels even beat Wallonia in 2023. Against the background of the continuing relatively weak economic growth, more specifically also employment growth, in Brussels this indicates that recently more and more Brussels residents have found a job outside their own regional border. Figure 13 shows that an increasing proportion of Brussels residents commute to Flanders. This number peaked in 2023, followed by a decrease in 2024. The striking new reversal in 2024 contributed to a negative nod in the Brussels unemployment and employment rate that year.
Regional activity in construction and industry
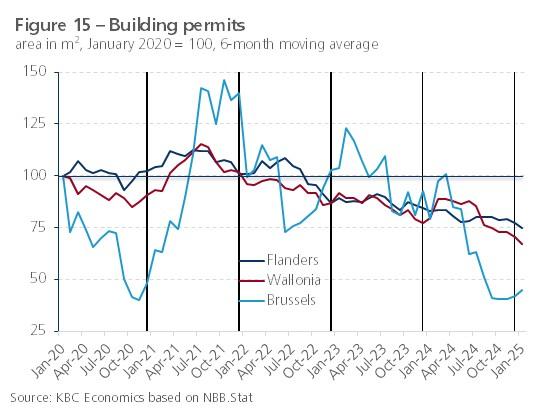
GDP growth across Belgium was held back in 2023 and 2024 by the cooling housing market. Specifically, higher interest rates sharply inhibited housing investment by Belgian households. They were on average 4.8% lower in real terms in 2024 than in 2023, after also falling by 2.5% and 3.2% in 2023 and 2022, respectively. To get an idea of the extent to which this correction was different in the regions, we look at regional figures on the number of building permits granted (see figure 15). We have to be careful here because usually it is only later after the permit is granted that house construction or renovation actually starts. Because the monthly figures are rather volatile, we show the 6-month moving average in the figure. In recent years, the dynamics of the number of permits was quite similar in Flanders and Wallonia and relatively volatile in Brussels. In 2024, that number was on average 8.5%, 5.5% and 34.0% lower in Flanders, Wallonia and Brussels, respectively, than in 2023. This suggests that the construction and renovation correction in 2024 was greatest in Brussels, followed by Flanders and then Wallonia.
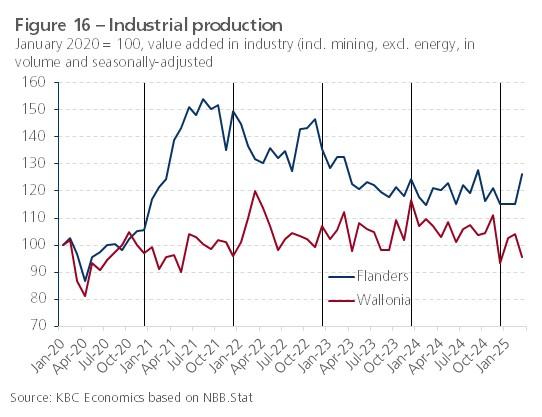
Figures on industrial production do exist for the regions in volume terms and seasonally adjusted. Figure 16 shows its dynamics for Flanders and Wallonia over the past three years. In Brussels, with its typical service economy, the share of industry is only a good 2%, while for Flanders and Wallonia it is around 20%. Compared to the service sectors, industry in Belgium rebounded quickly and strongly once the economy reopened after the pandemic. The resilience of industrial activity was particularly reflected in Flemish production figures. In Wallonia, figures remained rather flat after the initial climb out of the pandemic. The relatively strong rebound of Flemish industry was related to the recovery of international trade, from which Flanders was able to take full advantage. In Wallonia, the export recovery only took shape later. More specifically, the pharmaceutical industry recorded very good results in 2021. This industry benefited from the huge demand for vaccines and its production was massively exported. This strong growth in the pharmaceutical industry originated mainly in Flanders with corona vaccine producer Pfizer.
From the summer of 2021, industrial activity was increasingly hampered by bottlenecks in the supply of essential inputs and by personnel shortages. Added to this, from early 2022 onwards, was the Ukraine and energy crisis. Especially in Flanders, this caused a significant industrial downturn, with a temporary recovery towards the end of the year. In Wallonia, there was an exceptional peak in industrial activity in early 2022, attributable to the manufacture of computer and electronic products, followed by a normalisation. Through 2023, production in Flanders fell considerably, before remaining fairly stable in 2024. In Wallonia, there was some recovery in 2024. In 2023, industrial production in Flanders and Wallonia contracted on average by 9.6% and 0.6%, respectively. In 2024, it shrank further in Flanders by 3.4% on average, while in Wallonia it grew very slightly, by 0.1% on average.
From the summer of 2021, industrial activity was increasingly hampered by bottlenecks in the supply of essential inputs and by personnel shortages. Added to this, from early 2022 onwards, was the Ukraine and energy crisis. Especially in Flanders, this caused a significant industrial downturn, with a temporary recovery towards the end of the year. In Wallonia, there was an exceptional peak in industrial activity in early 2022, attributable to the manufacture of computer and electronic products, followed by a normalisation. Through 2023, production in Flanders fell considerably, before remaining fairly stable in 2024. In Wallonia, there was some recovery in 2024. In 2023, industrial production in Flanders and Wallonia contracted on average by 9.6% and 0.6%, respectively. In 2024, it shrank further in Flanders by 3.4% on average, while in Wallonia it grew very slightly, by 0.1% on average.
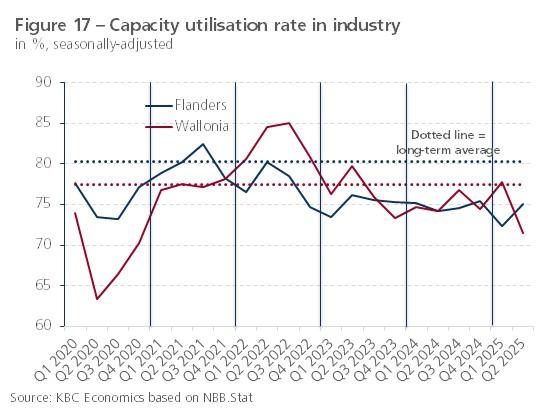
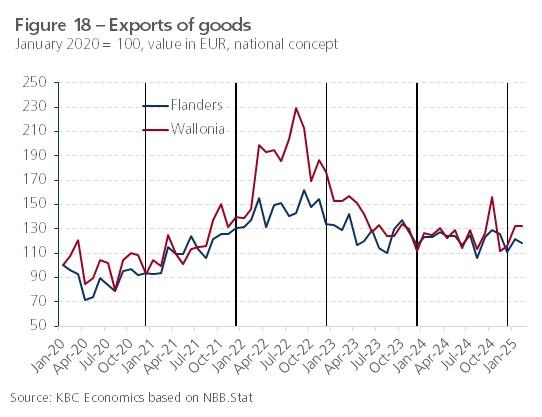
Capacity utilisation rates in industry remained below the respective long-term average in 2023-2024 in Flanders more than in Wallonia (see figure 17). Export dynamics were quite similar in Flanders and Wallonia, with a higher peak in Wallonia in 2022, though (see figure 18). Partly as a result of that peak, the percentage average decline in 2023 and 2024 was stronger in Wallonia (-26.7% and -8.5%, respectively) than in Flanders (-13.4% and -3.2%, respectively). These are nominal export figures which, especially given the past large fluctuations in inflation, do not necessarily give a good picture of volume trends in international trade.
Estimate regional growth in 2024
For Belgium as a whole, real GDP growth in 2024 was at 1.0%. For the three regions, the historical growth rates only extend to 2023 and it is not clear for the time being to what extent, and for what reasons, economic growth there deviated from national real GDP growth in 2024. The numerical information available to estimate regional growth in 2024, discussed above, is rather patchy and surrounded by many technical limitations. Moreover, fewer regional indicators are available regarding the relatively important service sector, giving us an incomplete picture of the dynamics of the entire economy. Also, the signals that emerge from the various indicators available are far from unambiguous, making it difficult to draw conclusions regarding regional growth in 2024.
A more quantitative approach is to check econometrically to what extent the regionally available indicators have been able to properly explain the annual growth in the three regions in the past. If so, then we can plug the already available figures from those indicators for 2024 into the mathematical equation to quantify regional 2024 growth as an estimate. One problem with this is that the past regional growth figures are annual figures and thus for the considered indicators (mostly monthly figures) we also have to calculate a annual average, which makes the number of data observations in the econometric exercise small.
We have the longest time series for the regional and Belgian growth rates (1960-2023). A very simple regression consists of explaining for each region its own growth over that period only by Belgian growth. This produces an extremely significant coefficient each time. If we bring the already known 2024 growth for Belgium (1.0%) into the three mathematical equations, we obtain an economic growth for Flanders, Wallonia and Brussels of 1.4%, 0.7% and 0.6% respectively in 2024. These are figures consistent with the 1.0% growth rate for Belgium as a whole. In that exercise, past growth ratios (with Flanders showing a clear growth lead) are simply carried forward to 2024. Such an approach is short-sighted and does not take into account other available regional indicators for 2024.
Including additional regional business cycle indicators in the regression equation creates not only a problem of short(er) time series (fewer observations) but also a problem of multicollinearity. Since the (annualised) regional indicators are often (highly) correlated with the Belgian GDP growth series, including them together in the mathematical equation would make the regression results less accurate. If we do so anyway, the different regional indicators do not appear to provide a significant additional explanation (no significant t-value, also no significant increase R2). If we omit Belgian GDP growth from the equation, producer confidence and export growth do offer significant explanations for regional growth. We still have a fairly long time series available for both of these (namely 1985-2024, only for Flanders and Wallonia, not Brussels. We capture the exceptional growth decline during the 2020 pandemic year by a dummy variable. When we bring the known values of both variables for 2024 into the comparisons, we obtain an economic growth for 2024 of 0.6% in Flanders and 0.5% in Wallonia. The (small) difference is due to difference in export growth (-8.6% in Wallonia versus -3.2% in Flanders).
The low quantified estimate for economic growth for Flanders and Wallonia in 2024 mainly reflects the weak industrial business environment and is inconsistent with the higher (now known) 1.0% growth rate for Belgium as a whole. The quantitative exercise thus brings little comfort. Indicators with quite long time series (unemployment rate 1960-2022, building permits 1996-2022, capacity utilisation rate 1988-2022) do not appear to provide significant explanatory power for past regional economic growth. For other regional indicators (consumer confidence 2003-2022, producer confidence Brussels 2008-2022), the available time series is too short to include them meaningfully in an econometric regression. That the growth estimate that emerges from our single regression exercise does not differ greatly between Flanders and Wallonia is in line with the Regional Economic Outlook published by the Federal Planning Bureau in mid-July 2024. At that still early date, real GDP growth for all of Belgium in 2024 was estimated to be quite high at 1.4% (1.0% realised). For Flanders, Wallonia and Brussels, the Planning Bureau then projected growth for 2024 at 1.4%, 1.3% and 1.4%, respectively.4
Perhaps the 2024 growth rate in Flanders and Wallonia will not have been very different and thus will have been around 1.0%. The Brussels economy was affected in 2024 by sharply lower production at the Audi plant in Forest, which dropped to only one-third of that in 2023. In 2023, the share of transport equipment production was 0.6% of the total value added generated in the Brussels economy. The lower production at the Audi plant in 2024 is estimated to have depressed growth in the region by several tenths of a percentage point, so it may well have been well below 1.0% there. For final results, we will have to wait until early 2026, when the National Accounts Institute (NAI) will publish 2024 figures on regional growth in Belgium.
4. Outlook regional growth in 2025 and 2026
Recent confidence indicators
Earlier in this report, we noted that the regional confidence indicators (excluding product confidence in Brussels) deteriorated toward the end of 2024. It is notable that consumer confidence continued to slip in Flanders in January 2025, while it improved somewhat in the other two regions (see figure 6). In February, the indicator improved sharply in all three regions, with that in Wallonia and Brussels even reaching levels well above the long-term average. The improvement was due to a significant drop in unemployment expectations. It is striking, since that subcomponent of consumer confidence had indicated an increased fear of unemployment among citizens the six months before (see figure 7). Perhaps many survey responses (in Wallonia and Brussels more than in Flanders) were positively influenced by the reforms announced by the new federal government, including the plan to reduce the duration of unemployment benefits. In March and April, however, consumer confidence again deteriorated significantly, completely reversing the rebound in February.
Producer confidence continued to deteriorate in the first months of 2025 in Flanders and Wallonia. In fact, the indicator's decline was very pronounced in Wallonia in March. In contrast, although very volatile, there was a marked improvement in Brussels since the end of 2024, with the indicator moving above its long-term average in the first months of 2025. The deterioration in Flanders and Wallonia, which are more dependent on merchandise exports, strongly reflects the current turbulent external environment. In particular, there is growing concern about US import tariffs, which could stifle economic recovery in the short term.
To get a view of regional growth in 2025 and 2026, we need to estimate the extent to which the three regions are affected by Trump's tariff war on the one hand and they can reap the benefits of German and European fiscal stimulus on the other. US import tariffs, and uncertainty about further developments on this front, weigh on shorter-term growth prospects, but solid fiscal expansion (spillover effects from the strong German stimulus and the impact of EU Readiness 2030) will support economic growth in 2026 and beyond.
Rate impact and uncertainty
Figure 19 shows the exports of the three Belgian regions to the US. For Brussels, its economic importance (i.e., expressed as a percentage of gross regional product) is relatively small. This is mainly because the region has a relatively more service-oriented economy with few general goods exports. In Wallonia, the share of its exports to the US in total regional exports (11.1% by 2024) is higher than in Flanders (7.2%). But because Flanders has a more open economy compared to Wallonia, the economic importance of those exports is greater there. In 2023, exports to the US accounted for 5.8% of gross regional product in Flanders, compared with 4.5% in Wallonia
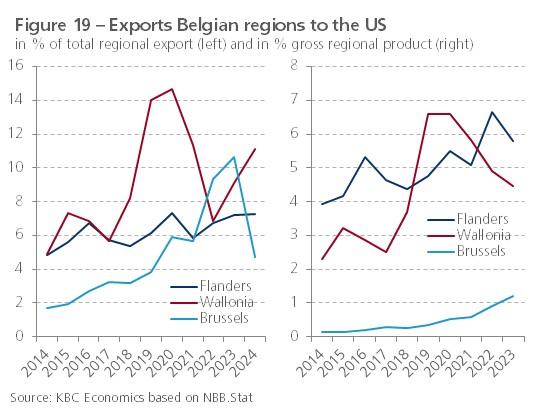
Although relatively small in importance, exports from the Brussels region to the US did increase considerably over the past decade. One important explanation concerns the production and export of electric Audi cars made at the Forest plant. This was partially stopped in 2024, which helps explain the sharp drop in exports to the US in 2024. In 2024, vehicles and transport equipment still made up 61% of exports from Brussels to the US; in 2023 this peaked at 74% (see table 2). With the closure of the Audi plant in Forest earlier this year, the sensitivity of the Brussels economy to the tariff war has been sharply reduced, although this closure in itself obviously has an impact on Brussels economic activity.
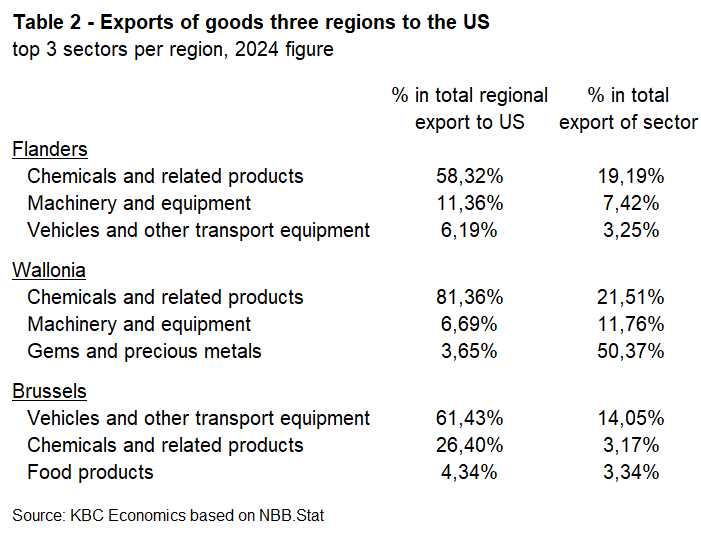
For Flanders, and more so Wallonia, goods exports to the US consist mainly of chemicals and related (especially pharmaceutical) products (see table 2). In both regions, that sector relies on the US for about one-fifth of its exports. In addition, the machinery and equipment sector in both regions also exports quite a bit to the US, although in comparison to chemicals, its share of total regional exports to the US is significantly lower.
Of course, the extent to which the regions will be effectively affected depends very much on how the tariff war will evolve in the coming months and, more specifically, what the outcome of the negotiations between the US and the EU will be. Since 5 April, a tariff of at least 10% has been in place on all goods entering the US. Goods coming from the EU would in principle be subject to a 20% tariff, but on 9 April Trump announced a 90-day pause (until 9 July). On 23 May, Trump threatened a 50% tariff on imports from the EU, but that too was delayed from 1 June to 9 July. Furthermore, it remains unclear whether pharmaceuticals, which have remained out of bounds for the time being, will be affected finaly anyway. The US is a very important export market for both the Flemish and Walloon pharma sectors.
European fiscal stimulus
The substantial additional military and infrastructure spending recently decided by Germany and the EU (as part of the Readiness 2030 plan, previously called ReArm Europe) could support economic growth in Belgium via spillover effects and own defense spending. For the country as a whole, we estimate the impact of the total stimulus at roughly 0.8% of GDP, spread over several years. Due to the time required to implement the stimulus, it is likely to take some time before the additional fiscal spending takes effect. We see a first visible impact of it on growth only from 2026 onwards, with the largest impact earlier in the years thereafter (i.e. 2027-2028).
Which region will benefit most economically from the additional military spending will depend on the nature of the investments and the extent to which they will go abroad less than in the past. Probably the first step will be to build on what already exists in the defense industry in Belgium. In Wallonia, these are mainly the traditional weapons companies (FN Herstal, John Cockerill, Mecar,...) with production of firearms, bombs and grenades. Although Flanders also has limited such companies (FN Zutendaal), the defense industry there is more specialised in the production of defense-related high-tech parts (screens, night vision, radar and communication systems,...), often by SMEs. To the extent that the additional (Belgian and European) investments are prioritised towards the upscaling of existing production of classic weapons, the Walloon defense sector would probably benefit somewhat faster and more than the Flemish one.
On the other hand, the Flemish defense (related) industry as supplier of components will probably benefit more from the German military stimulus. The additional infrastructure investments planned by the German government are also likely to benefit Flanders more via spillover effects, given the greater economic importance of exports to Germany in that region. Over the past decade, Flemish exports to Germany have averaged 13.3% of gross regional product. The corresponding Walloon and Brussels figures are lower at 9.5% and only 2.0%, respectively. Moreover, Flemish exports to Germany are more diverse than Walloon exports, which consist mainly of chemicals, pharmaceuticals and mineral products.
Growth forecast 2025-2026
For Belgium as a whole, we currently assume real GDP growth of 0.7% in 2025 and 0.8% in 2026 (see our May 2025 Economic Perspectives publication). Perhaps, in the shorter term, Flanders will be affected somewhat more than Wallonia by the tariff increase and related uncertainty. Moreover, in the short term, Wallonia will be able to benefit somewhat faster and more than Flanders from higher defense spending. As a result, economic growth will probably be higher in Wallonia this year (around 1.0%) than in Flanders (rather towards 0.5%). The Brussels economy will be affected by the closure of the Audi factory in Forest in 2025, contributing to a lower growth rate (around 0.5%) in that region. Once the German fiscal stimulus gains momentum and the more high-tech Flemish defense industry also begins to benefit from increased spending, economic growth in Flanders is likely to outpace that in Wallonia. For 2026, we therefore expect Flemish and Walloon growth to be slightly above and slightly below, respectively, the expected growth for Belgium as a whole (0.8%).
The scenario presented is subject to a high degree of uncertainty. Downside risks relate mainly to the environment for international trade. Higher import tariffs and uncertainty about (US) trade policy could weaken regional economies (especially the Flemish one) more than expected. In addition to the direct impact on foreign trade, indirect effects such as a loss of confidence could ultimately magnify the negative impact on economic activity. A positive risk is that the major turn on fiscal policy in the EU and Germany could support regional growth (especially Flemish growth) more than expected through the confidence channel.
1 Gross regional product is the gross domestic product (GDP) of a region within a country and corresponds to the total value added generated on the territory of that region.
2 With the latest publication of the Regional Accounts, regional statistics from 2020 onwards were already updated in line with the five-year benchmark revision in line with Eurostat recommendations. The NAI will update the figures before 2020 only later, in the third quarter of 2025, in line with that methodological revision. As this creates a break in the regional figure series, in this report we use the unadjusted 2020 figure to calculate the 2020 vs 2019 annual change and the adjusted 2020 figure to calculate the 2021 vs 2020 annual change. .
3 Regional 2023 figures are not yet available for the number of working hours. Therefore, hourly productivity growth cannot be quantified for that year either.
4 The Federal Planning Bureau makes an annual update of its regional growth forecasts. The estimate made in the summer of year t for regional growth in t-1 is largely based on regional data already available at that time regarding year t-1 at the National Social Security Office (NSSO).