

Belgian labour market experiences weaker period but no dramatic deterioration

Read the publication below or click here to open the PDF.
According to new Eurostat figures, the Belgian harmonised unemployment rate rose quite a bit since the summer of 2024. In April 2025, it even climbed above the euro area rate for the first time in almost 20 years. At first glance, the development seems to indicate that the labour market situation, having held up well during the past crises, is now seriously deteriorating. However, it contrasts with other recent labour market indicators that on balance remain good. For instance, net job creation picked up somewhat in the latest quarters. The contrast is explained by the fact that, in addition to the unemployment rate, the participation and employment rates have also rebounded in Belgium in recent quarters. The participation rate increased more than the employment rate, which fuelled the rise in the unemployment rate. Increasing labour market participation is a good thing in itself and is a public policy objective. But this requires sufficient job creation and, in light of the still high vacancy rate, reducing the existing mismatch between labour supply and demand.
1. Introduction
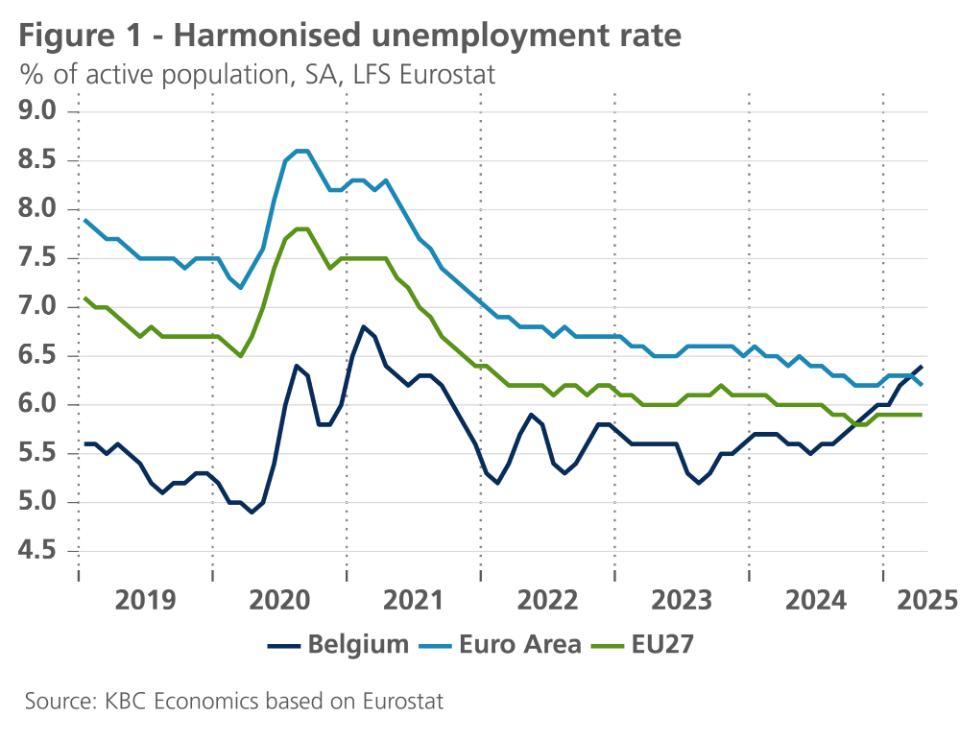
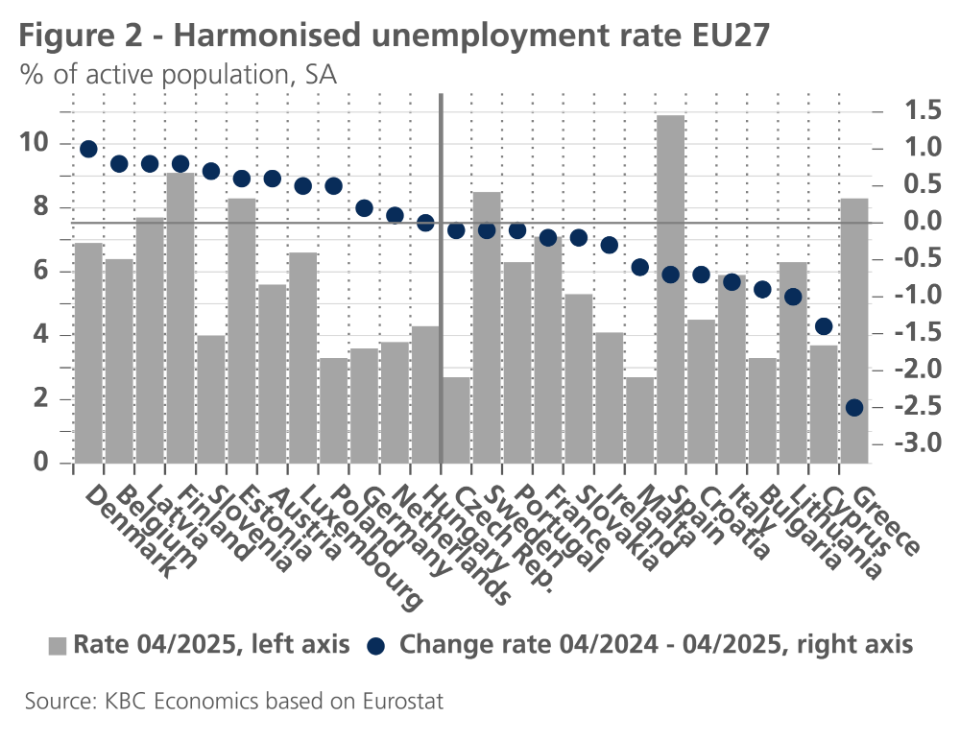
The reason for writing this research report is the recent update of Eurostat figures on the harmonised unemployment rate. These showed that, partly due to an upward revision of previous monthly figures, the Belgian rate has risen considerably since the summer of 2024. After recording around 5.5% for a while, the unemployment rate rose to 6.4% in April 2025 (latest available figure). The Belgian rate was thus above that in the euro area and the wider EU27 for the first time in almost 20 years (see figure 1). Compared to a year earlier, the increase in the unemployment rate in the EU27 was larger only in Denmark (see figure 2).
The increase in the harmonised unemployment rate suggests that the situation in the Belgian labour market, which had overall held up quite well during the past pandemic and energy crisis, is now deteriorating. In this report, we bring more clarity around the observed increase and also look at other labour market indicators, including alternative unemployment measures and hard and survey data on (recent and expected) employment trends.
2. Eurostat’s labour market indicators
The Eurostat unemployment rate shown is based on the Labour Force Survey (LFS). It refers to persons who meet the ILO definition of unemployment, namely all those who are not working, immediately available for a job and actively seeking it. An unemployed person must meet the three conditions simultaneously, if not he or she belongs to the employed or inactive. The advantage of the Eurostat figures is that they allow for cross-country comparisons and are seasonally adjusted. Because the series is survey-based, it does not concern an 'exact' measurement. Moreover, problems arise in the practical implementation of each of the ILO conditions. For instance, one can discuss what is considered 'working', what time period corresponds to 'immediately' and what 'active search' precisely means. Moreover, there are regular revisions of previously published data. All this means that the measure should be interpreted with caution and supplemented with other labour market indicators.
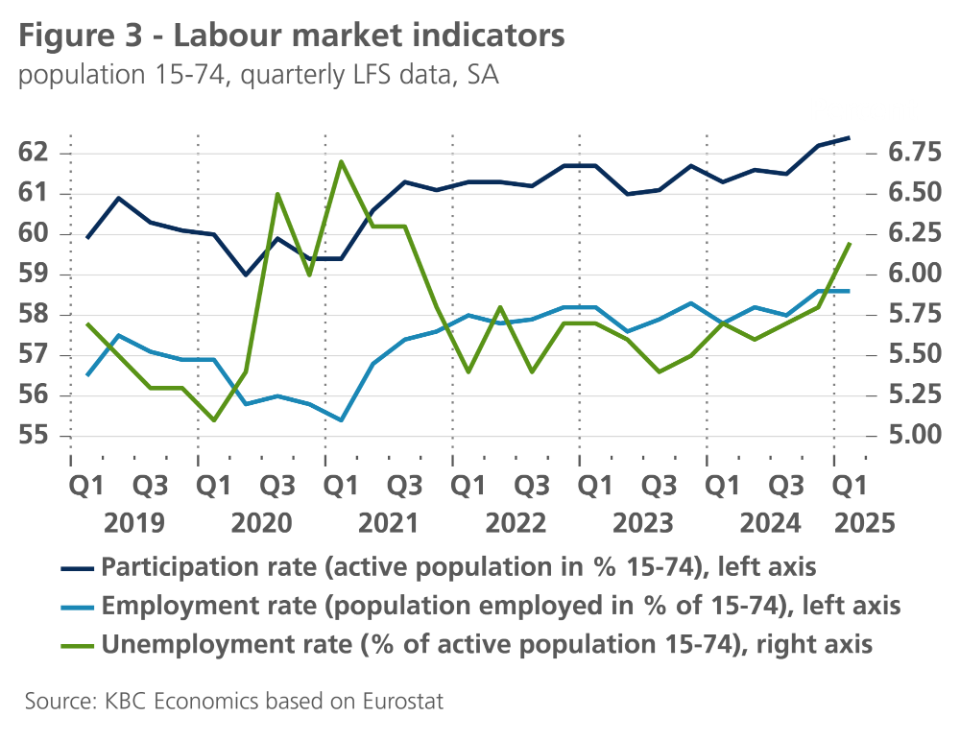
Besides figures on the harmonised unemployment rate (available on a monthly basis), Eurostat also publishes quarterly data on the participation rate and employment rate, also based on the LFS. The first indicator concerns the active population (often also called labour force) as a percentage of the population aged 15-74. The second concerns the employed population as a percentage of the population aged 15-74. Figure 3 shows both indicators together with the unemployment rate (unemployed as a percentage of the active population, this time as a quarterly series). It is notable that, in addition to the unemployment rate, recently the participation and employment rates have also risen substantially. Between the first quarter of 2024 and the first quarter of 2025, the increase in the participation rate (+1.2 percentage points) was stronger than that in the employment rate (+0.8 percentage points), which fuelled the rise in the unemployment rate (+0.5 percentage points). Expressed in absolute numbers, the population between 15 and 74 increased by 46,000 over the period. This was accompanied by a 78,000 decrease in the inactive population and a 124,000 increase in the active population. 91,000 more went into work and 33,000 more ended up in unemployment.
3. Administrative unemployment rate
Besides the survey-based Eurostat figures, there are also unemployment rate figures resulting from an administrative count of the number of unemployed. The NEO/RVA (National Employment Office) calculates the unemployment rate as the ratio of the number of unemployment benefit recipients (the so-called 'benefit recipients fully unemployed', in Dutch: 'uitkeringsgerechtigde volledig werklozen', UVW) to the number of people insured against unemployment. This is a narrow measure because it includes only the unemployed with benefits. There is also an unemployment rate that relates registrations with the regional employment services (VDAB, Forem and Actiris) to the labour force. In essence, this is the so-called 'non-working jobseekers' (in Dutch: ‘niet-werkende werkzoekenden’, NWWZ), which includes a number of additional categories of jobseekers (e.g., freely registered jobseekers, jobseekers at the expense of the PCSW (Public Centres for Social Welfare), jobseekers excluded from benefits, etc.) in addition to the unemployed on benefits.
In practice, the unemployment rate based on administrative censuses often differs significantly from that according to the Eurostat definition, both in terms of level and trend. This is mainly due to definitional differences, but also because the former is not seasonally adjusted while the latter is. Figure 4 shows the unemployment rate based on the NEO/RVA definition. It is striking that the recent sharp rise that was visible in the Eurostat figures does not show up here, neither for Belgium as a whole nor in the three regions (Flanders, Wallonia and Brussels).
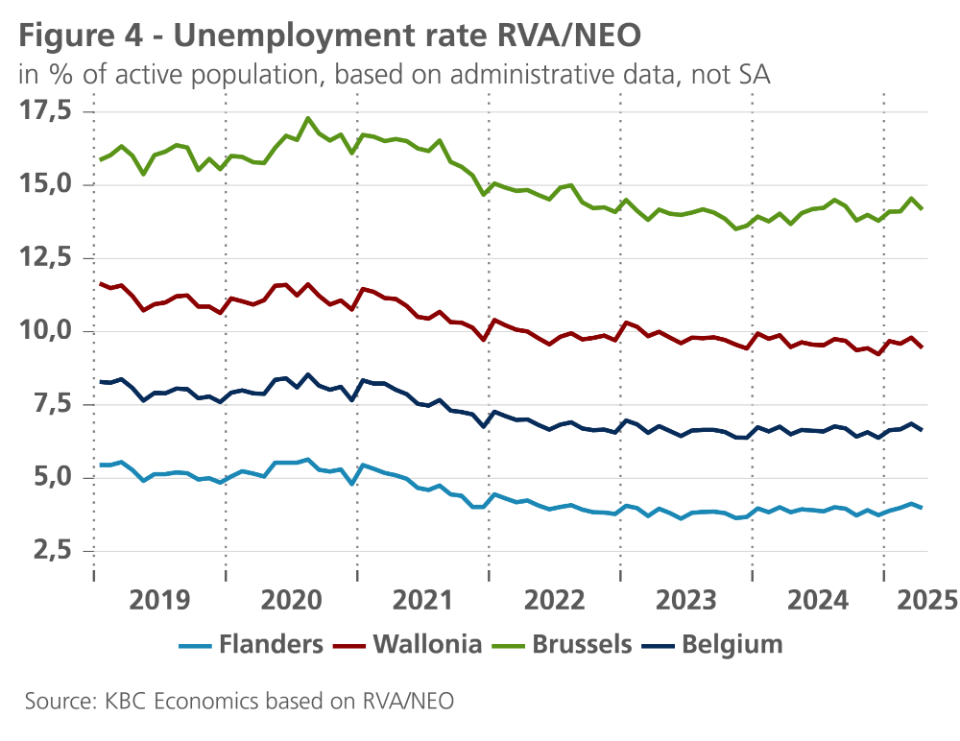
Figure 5 shows the administrative unemployment rate published by the regional employment services (not available for Belgium as a whole). Again, no significant increase is noticeable during the past year. Only in Wallonia did the rate increase on balance. Between May 2024 and May 2025, according to this (broader) definition, the rate there increased by 0.9% percentage points, while it stabilised in Flanders (+0.0%) and Brussels (+0.1%). A similar relative picture emerges in the dynamics of the absolute number of non-working jobseekers (NWWZ).
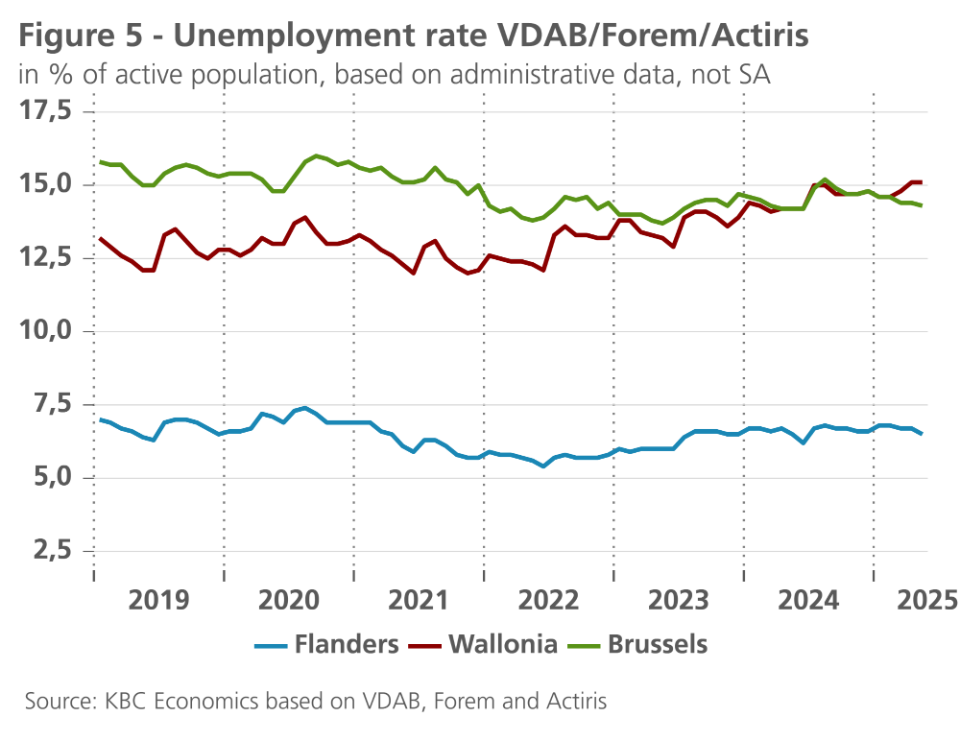
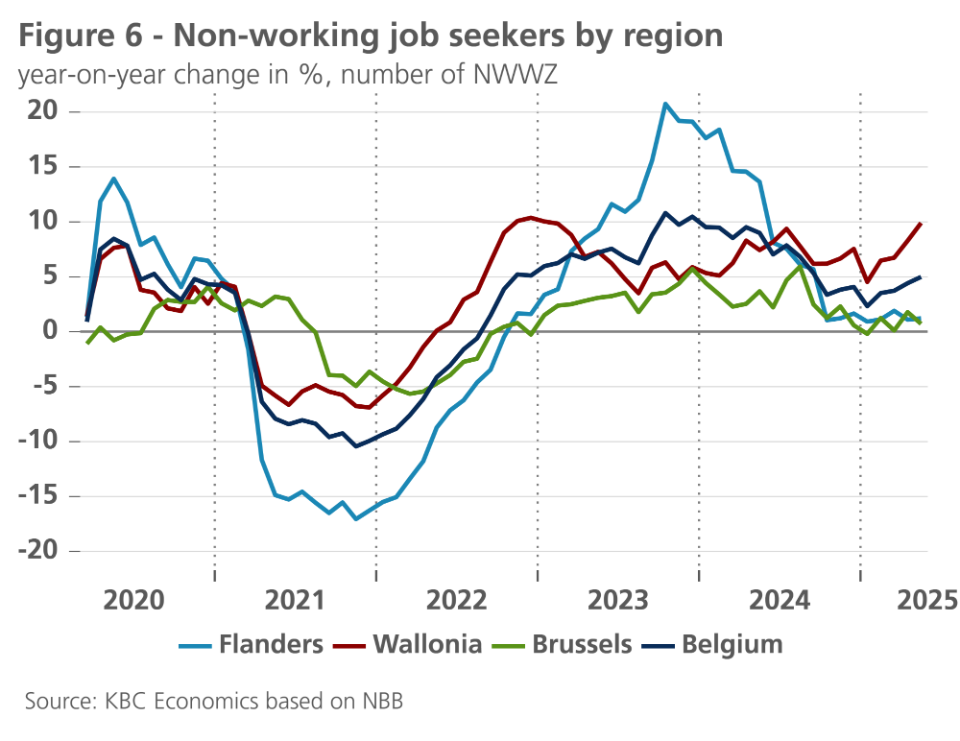
Figure 6 shows the year-on-year change of that group, clearing out seasonal influences. In Wallonia, that number in May 2025 was 9.9% higher than a year earlier, in Flanders and Wallonia only 1.2% and 0.7% respectively. The fact that the unemployment rate in Wallonia did not increase according to jobseekers on unemployment benefit (UVW, figure 4) seems to indicate that the increase there is mainly in the additional categories of unemployed.
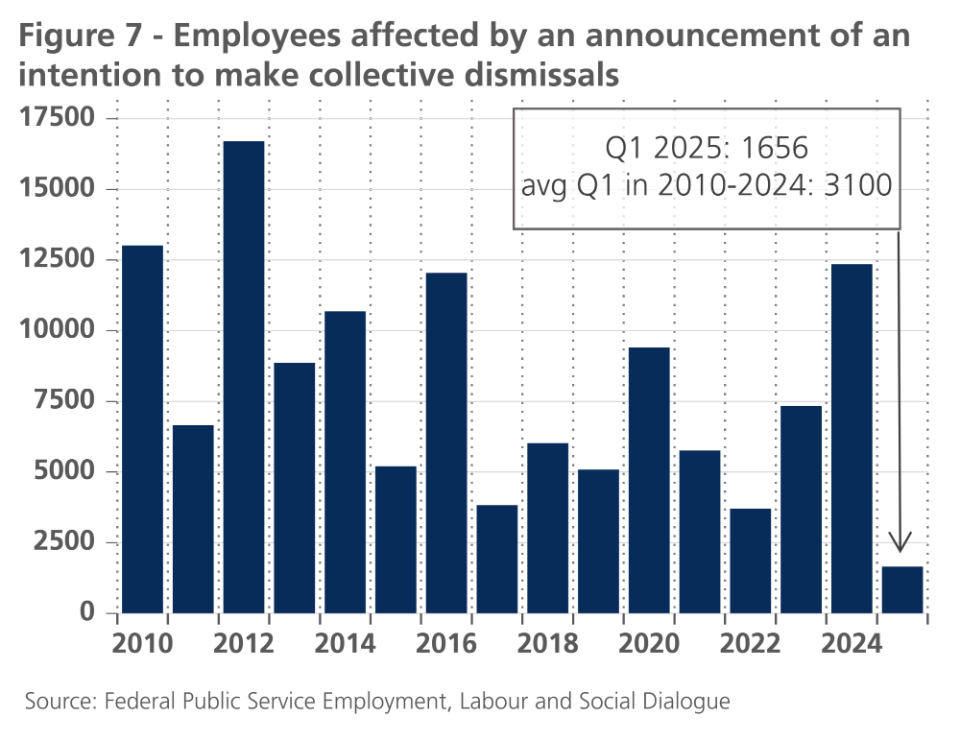
How the unemployment situation is evolving can also be seen from figures on the number of workers affected by an announcement of an intention to make collective dismissals. There were 12,354 in 2024, which is significantly more than in previous years and above the long-term average (some 8,500 in 2010-2024). We have to put the figure in perspective, though, since it involved some large companies (including Van Hool in Lier and Audi in Forest Brussels). In number of companies affected, the 2024 figure (103) was not significantly higher than the long-term average (97 in 2010-2024). Moreover, in the first quarter of 2025, the situation regarding affected workers already appeared not to deteriorate further (see figure 7). Then, 'only' 1,656 workers were affected by the announcement of a collective redundancy. That is roughly half the average of the four quarters in 2024 and also half the average of the first quarters in the period 2010-2024.
4. Employment dynamics
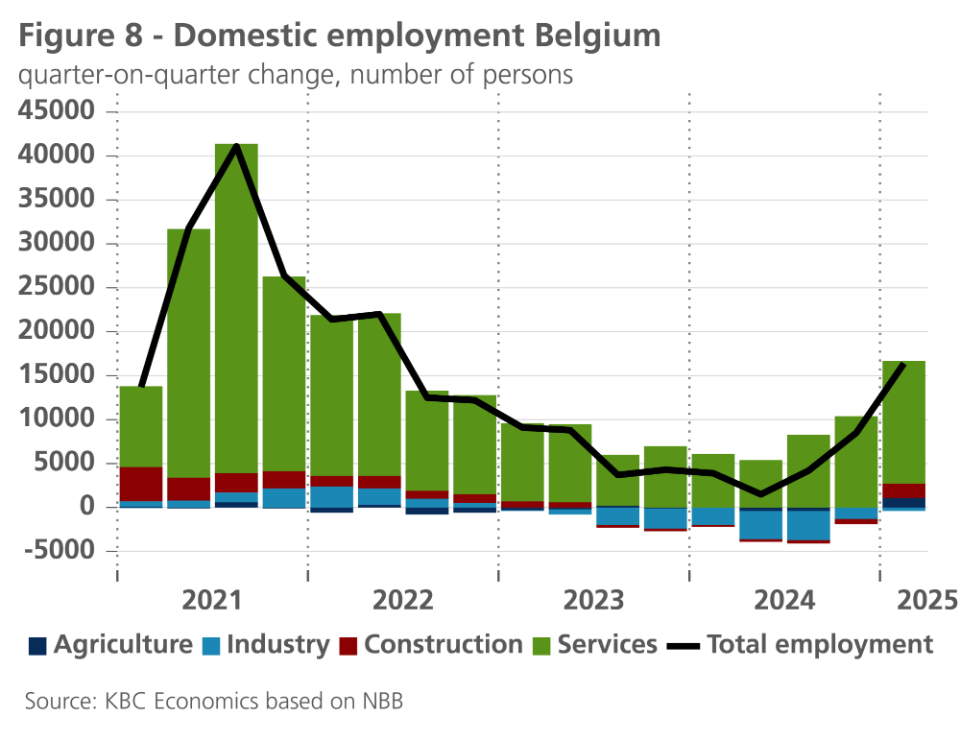
Unemployment is only one, albeit an important, measure of the labour market. To get a broad picture of the current labour market situation, we also need to look at employment trends. The aforementioned LFS data (which look at the situation from the citizens' point of view) already indicated that quite a few additional persons started working last year, resulting in a jump in the employment rate. From the point of view of businesses, it is also notable that the dynamics of net job creation have picked up in recent quarters, after a previous cooling off (see figure 8, National Accounts data). Services added more jobs again in the first quarter of 2025, construction stopped losing jobs and manufacturing lost fewer.
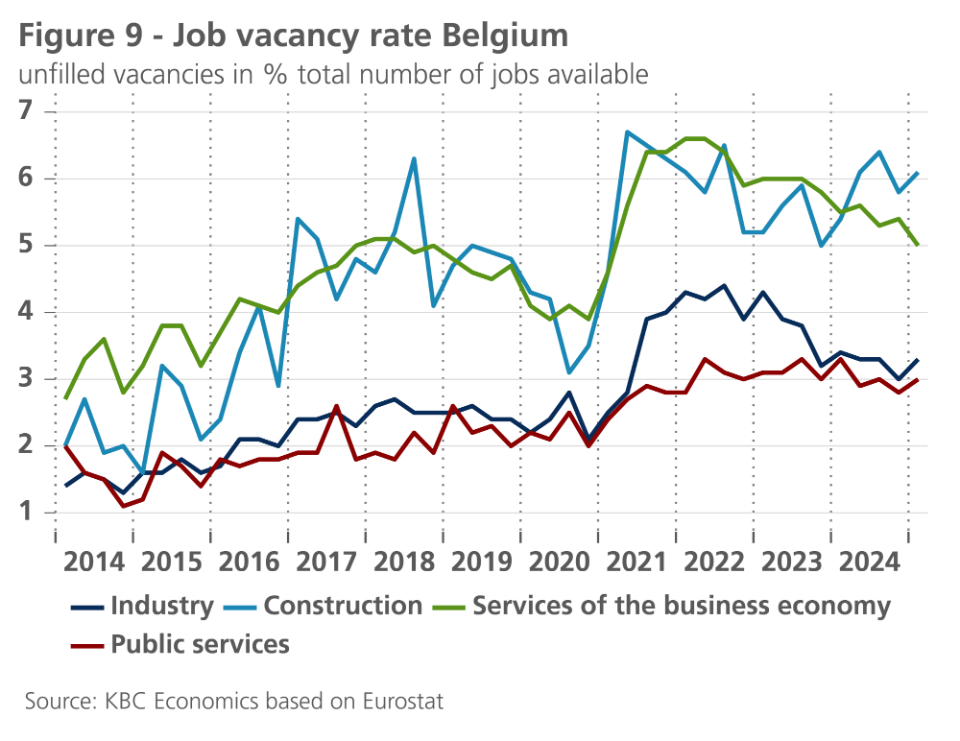
Another indicator on labour supply is the vacancy rate. This shows the number of unfilled vacancies in relation to the total number of jobs available (i.e. sum of filled jobs and unfilled vacancies). Figure 9 shows that the vacancy rate, although past its peak, is still well above the pre-pandemic level despite the decline. In the first quarter of 2025, the Belgian job vacancy rate was still 4.1%, the second highest figure in the EU27 after the Netherlands. In absolute figures, it concerned rounded 170,000 vacancies, i.e. 15,000 fewer than in the same period a year earlier. The structurally high vacancy rate is partly due to demographic trends. The working-age population is increasing less strongly, making it more difficult for companies to find workers.
5. Labour market expectations
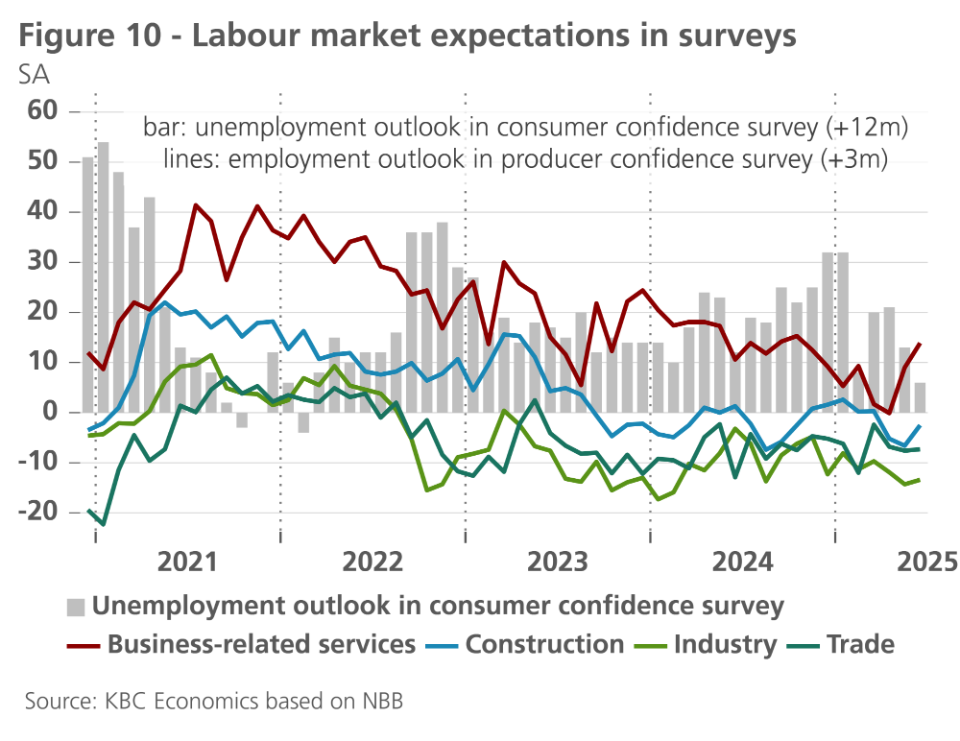
In addition to the LFS survey that gauges the current status of citizens (employed, unemployed, inactive), we also have surveys that provide information on expected developments in the labour market. The NBB consumer and producer confidence surveys contain a subcomponent that gauges consumers' unemployment prospects (for the next 12 months) and firms' employment prospects (for the next 6 months), respectively. Figure 10 shows that cosumers’ unemployment prospects worsened during 2024, but returned to slightly more optimistic levels in recent months. Along the business side, the employment outlook worsened in services to businesses, although there has recently been some improvement again in this data series. In the other sectors, the outlook had been relatively less favourable for some time, but remained rather stable overall, regardless of short-term fluctuations.
More generally, all economic forecasters (EC, IMF, OECD, NBB, Federal Planning Bureau,...) are also assuming at most a limited increase in the Belgian unemployment rate in 2025, followed by another decline in 2026 and/or 2027. Employment growth would also remain positive, albeit limited in 2025 but also followed by a strengthening thereafter. KBC Economics also assumes that the harmonised unemployment rate could increase further to a limited extent, from 6.4% in April to 6.6% by the end of 2025, but will then fall back somewhat, partly due to demographic pressure on the working-age population.
Box - Impact of shortening the duration of unemployment benefits on the unemployment rate
The unemployment rate figures may also be impacted from early 2026 by the shortening of the duration of unemployment benefits to two years. A lot of unemployed people will then disappear from the official unemployment figures. How strong the impact on the unemployment rate will be is not clear a priori and depends mainly on its definition. The administrative unemployment rate based on unemployment benefit recipients (UVW), as calculated by the RVA/NEO, will decrease as those affected find work. However, if they end up in inactivity, the number of unemployment benefit claimants (numerator) as well as the number of those insured against unemployment (denominator) will fall. In that case, the RVA/NEO unemployment rate falls less.
Some of those who lose their unemployment benefits will be forced to rely on a living wage. At least a proportion of them will remain jobseekers, reducing the UVW but not the NWWZ. They will become jobseekers at the expense of the PCSW and remain in the labour force. This means that, in principle, they will not reduce the unemployment rate as calculated by the regional employment services. This is only the case for the part that claims a living wage but (for various reasons) is no longer available for the labour market. This group falls into inactivity and then falls out of both the numerator and denominator of the unemployment rate calculated by the regional employment services.
The Eurostat unemployment rate, which is based on the LFS, may be less impacted by the unemployment benefit reform. To the extent that those who will lose their benefits also indicated earlier in the survey that they were not (or no longer) actively looking for work (in the four weeks prior to the survey according to the ILO definition), nothing changes: they were already not in the Eurostat unemployment and labour force and therefore will not leave it. If they did previously indicate that they were actively looking for work, the effect on the Eurostat unemployment rate will depend on their new situation (found work, still looking for work, ended up in inactivity).
On balance, we can say that the Belgian labour market is experiencing a weaker period but not a dramatic deterioration, this in line with the moderate GDP growth (expected at 0.8% per year in both 2025 and 2026). The latter is linked to increased international trade and geopolitical uncertainty. Apart from the ability to create additional jobs, the extent to which the unemployment rate rises further in such economic scenario also depends on behavioural factors and policy measures (see also box above). If the increase in labour market participation continues at an even higher rate (which is a good thing in itself), this will require sufficient further job creation and, at least equally important, reducing the mismatch between labour supply and demand that still exists.