

American labour market less tight than it seems
At first glance, US labour market indicators suggest a tightness that should quickly translate into a pick-up in wage growth. The historically very low unemployment rate is particularly striking. However, there has not yet been a significant acceleration in wage growth. A possible explanation for this paradox lies in the participation rate in the US labour market. Calculations by the Congressional Budget Office show that there was a cyclical dip in the participation rate after 2008, which has not yet been completely eliminated. Only when that available labour potential is again mobilised will wage growth in the US also accelerate.
In October, the US unemployment rate fell to 4.1% of the labour force. The unemployment rate has not been this low since December 2000. The current level is below the long term expectation by the US central bank (Fed). This suggests that the US labour market is becoming increasingly tighter and that the US economy is close to full capacity utilisation. This picture is also confirmed by other labour market indicators, including the broad measure of unemployment and the vacancy and hiring rates. Most labour market barometers have now recovered to their levels before the outburst of the Great Recession.
The mystery of the missing wage increases
The good health of the American labour market has not yet translated into significant wage increases. On the contrary, the most recent year-on-year change in the average hourly earnings in the private sector fell in October to 2.3%, from 2.4% in September. The link between falling unemployment rates and rising wage growth, the so-called Phillipscurve, therefore appears to be less strong than in the period before the Great Recession.
The weaker link between labour market tightness and wage developments in the US may be due to international factors affecting not only the US but also, for example, Europe. The Bank for International Settlements (BIS) has repeatedly empirically supported this hypothesis. In this respect, it refers in particular to the Chinese overcapacity. Through downward pressure on Chinese export prices, it also dampens inflation and nominal wage increases in the importing countries. This hypothesis boils down to the globalization of the Phillipscurve. In other words, the links between labour market variables within a single national economy have weakened.
How much slack is there left?
An additional explanation for the weaker than expected wage increases may lie in the real tightness of the US labour market. Perhaps it is not at all as tight as the low unemployment rate suggests.
An indication of this can be found in the participation rate. That is the proportion of the population at working age who work or are unemployed. Since the Great Recession, this participation rate in the US fell sharply from 66% in 2008 to 62.8% in 2017 (see Figure 1). In the period 2000-2008, this participation rate rate was still remarkably stable at an average of 66.3%. The cause of the subsequent fall in the participation rate was the subject of intense discussion. Was the decline mainly driven by cyclical (and therefore rather temporary) factors in the aftermath of the Great Recession, or more by structural (and therefore rather permanent) factors? The answer to that question is relevant for the future development of the participation rate and hence for the future available labour supply.
Figure 1 - Participation rate still has room to recover (Projections after 2017, in % of (adjusted) working-age population)
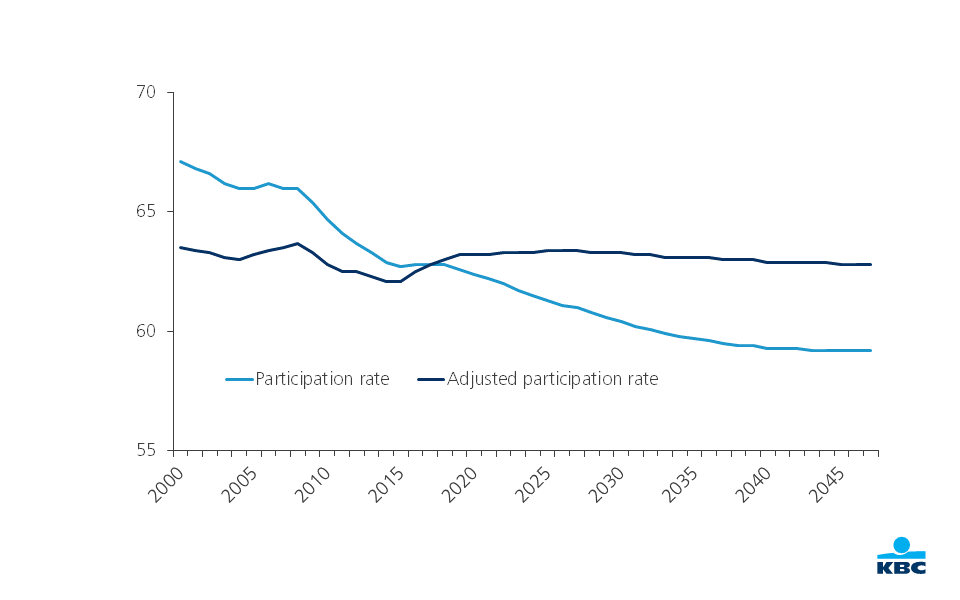
Source: Congressional Budget Office
Research by the Fed and the US Congressional Budget Office (CBO) suggests that the decline after 2008 is mainly driven by the demographic factor of ageing. The CBO draws attention to the increasing number of pensioners from the baby-boom generation and therefore also expects that the participation rate will continue to fall structurally in the coming years. As far as the labour market is concerned, this would mean specifically that we should not expect any significant increase in the participation rate and thus in the labour supply in the coming years.
The American definition of the participation rate exacerbates this conclusion. In most economies worldwide, the unemployment rate is expressed in terms of the ratio between the labour force (workers and unemployed) and the working-age population (generally defined as 15-64 year olds). In contrast, in the US, the participation rate is expressed as a proportion of the total population aged 15 and over. However, when this population group is increasingly made up of people of retirement age, the reported participation rate automatically decreases along the same lines.
In order to facilitate economic interpretation, the CBO therefore also calculates an ‘adjusted’ participation rate. In these calculations, the CBO keeps the composition of the population by gender and age constant in its ratios in 2017. Changes in economic variables are thus not directly influenced by purely demographic developments.
The so ‘adjusted’ participation rate remained remarkably stable in the period since 2000. There was no large trend decline in the period after 2008. The CBO also expects the outlook for the medium term to remain virtually stable. After the start of the Great Recession in 2008, however, we did see a moderate drop in the participation rate. At its lowest point in 2014-2015, it was 1.6 percentage points lower than in 2008. Since then, there has been a recovery movement, but it is still 0.9 percentage points below its pre-crisis level. This further recovery is therefore still likely, together with the associated increase of labour supply.
The slack in the US labour market is therefore still greater than initially apparent from labour market indicators. Against this background, it is not surprising that the average wage growth does not yet pick up more strongly. Once the cyclical dip in the participation rate has also been completely eliminated, the Phillips curve will resurface again and finally generate the long-awaited wage growth.