

Economic Derby of the Low Countries: Belgium-Netherlands 0-5


Op 16 oktober spelen de Belgische Rode Duivels een vriendschappelijke voetbalinterland tegen het Oranje-team van Nederland. België en Nederland voetbalden tot op heden 126 keer tegen elkaar. Nederland won 55 keer, België slechts 41 keer. De laatste winst van Nederland dateert wel al van 1997 en de jongste matchen kon België almaar meer overtuigen. Daarom onze voetbalprognose: 5-0 voor België. Aan de hand van de - overigens uit Nederland afkomstige - ‘magische vijfhoek’ zouden we de economische Derby der Lage Landen evenwel kunnen beslechten met een 0-5 forfait score in het voordeel van Nederland. Al vergt die cijfermatige uitslag nuancering.
Magic pentagon
On the playing field of the economy, a comparison between countries is often based on the ‘magic pentagon’. The concept was conceived in the Netherlands in the 1950s. It calls for measuring the success of five important objectives of economic policy: (1) high economic growth, (2) full employment, (3) a fair distribution of income and low poverty, (4) price stability and (5) a balanced balance of payments. We can measure performance in these areas on the basis of real GDP growth, the employment rate (the number of 20-64 year-olds in employment), the risk of poverty (we use the European indicator: people at risk of poverty or social exclusion, as a percentage of the population), inflation (the annual change in the consumer price index) and the current account balance (as a percentage of GDP), respectively.
Figure 1 illustrates the relative performance in 2008-2017 of Belgium and the Netherlands for each of these objectives in the form of the pentagon. This period covers a complete economic cycle, starting from the financial crisis and the Great Recession, over the European debt crisis to the recent years of economic recovery and upturn. The extremes on the axes (and the figures presented here) give the average of the three worst scoring EU countries on the one hand and the three best scoring EU countries on the other. The figure thus shows the relative strengths or weaknesses of Belgium and the Netherlands against these extremes.
Figure 1 - The magic pentagon of Belgium and the Netherlands in an EU perspective (period averages 2008-2017) (*)
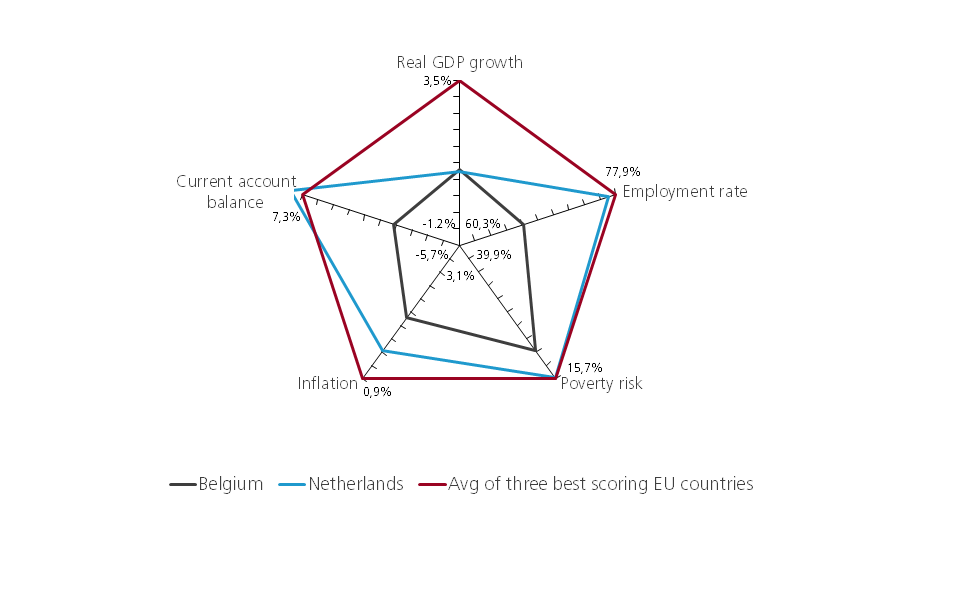
(*) As the observation is further away from the centre, the better the score was for the criterion concerned, and vice versa.
Orange above
Over the period under review, the Netherlands clearly outperformed Belgium on four of the five objectives. For three of them (employment rate, poverty risk and current account balance), the Netherlands even ranks among the best pupils in the European class. In terms of GDP growth, the Netherlands and Belgium appear at first sight to draw, with only an average score in an EU perspective. However, this picture requires a nuance. The Belgian economy withstood the crisis years relatively well, but the Dutch economy was hit hard, partly as a result of a crisis in the housing market. This was followed by a much stronger recovery in the Netherlands. In 2014-2017, with an average real GDP growth of 2.3% per year, the Netherlands also scored significantly better than Belgium in terms of growth (1.5% per year). In 2017, Dutch growth even peaked at 3.2%, almost double that of Belgium (1.7%). The growth prospects (e.g. EC, IMF and OECD) also remain consistently better for the Netherlands.
The different growth performances between the two countries can be explained, among other things, by the relatively greater reform and restructuring efforts of the Dutch in the past. Thanks to its increased competitiveness, the Netherlands has benefited more from the international economic boom in recent years, while the earlier consolidation of public finances has created room for an expansionary fiscal policy, which has been eagerly used for a number of years and until now.
The ‘0-5 gain’ for the Netherlands would indeed be even greater if we were to include public finances in this exercise. The ‘magic pentagon’ does not usually take this into account as such, but considers balanced public finances as an important precondition for policy. This metric has been much better for the Netherlands than for Belgium. Before the crisis, the public debt ratio was much lower and after the crisis, fiscal consolidation was much faster. Despite the stimulating fiscal policy, the Netherlands, therefore, still had a budget surplus of 1.1% of GDP in 2017, while Belgium still had a deficit of -0.7% of GDP. The difference in the debt ratio is even more extreme. The Dutch government debt fell below 60% of GDP in 2017. Belgium, on the other hand, is still one of the worst pupils in the European classroom, with a debt of 103% of GDP in 2017.
All that glitters is not gold
The simple numerical comparison in the pentagon, however, does not tell the full story. For example, the very large current account surplus in the Netherlands also reflects a low level of investment. This hampers long-term wealth creation and nuances the point that the Netherlands scores on that axis. Moreover, in the context of the European currency union, the large surplus is an imbalance, for which the Netherlands accumulates penalty points. The Netherlands achieves its excellent score in terms of employment because of the existence of more part-time work. In 2017, 47% of Dutch workers were part-time. That is the highest figure in the EU and double that of Belgium. There may be fewer Belgians at work, but they work on average more hours. The top score on poverty risk also requires nuance. Although the Dutch poverty rate is still among the lowest in the EU, it has risen sharply over the past decade, including during the recent period of strong economic growth. In Belgium, on the other hand, the relatively weaker growth in the past five years has been accompanied by a reduction in the risk of poverty. Not all Dutch people therefore benefit from the economic success. Risk groups are increasingly trapped in poverty. In other words, the Dutch economy is less ‘inclusive’ than the rough figures suggest.
The ‘magic pentagon’ only contains objectives for the real economy. It dates back to the time when the financial sector was much less developed. Today the financial sector is completely different and financial stability deserves a place in an exercise like this. In this respect, the Dutch economy has proved to be much more vulnerable than the Belgian economy. As mentioned above, the bursting of a real estate bubble and a very high level of household debt were also at the root of the stronger economic contraction during the crisis years.
So, settling the economic derby of the Low Countries with a 0-5 score in favour of the Netherlands may be an exaggeration (just as our reverse football forecast of ‘5-0 for Belgium’ may be, ;) ). Belgium can find inspiration with its northern neighbours not only for better economic performance, but also for avoidable developments. The fact that on balance the Netherlands is in a better economic position than Belgium nevertheless holds up as a conclusion.