
Why is the US economy withstanding the pressure from monetary policy – for now?


Abstract
The US economy continues to withstand monetary pressure. In Q3 2023, its GDP grew by 1.2% quarter-on-quarter. Though it is well known that monetary policy takes time to affect the economy, the current lag between monetary policy and the economy appears longer than usual. This can partly be explained by structural shifts, such as the lengthening of loan maturities and the increasing importance of services. Covid-related effects, such as the easing of supply chains, the built up of excess pandemic savings and student debt forbearance further explain the increased lag. Nonetheless, we expect that the US economy will eventually slow as a result of monetary tightening.
Introduction
The US economy continues to surprise on the upside. In Q3, US GDP increased by 1.2% quarter-on-quarter, thanks to strong consumption. This was even higher than the strong Q2 figure of 0.6% quarter-on-quarter growth. The resilience is all the more surprising given the rapid pace of monetary tightening. From March 2022 till today, the Fed raised its policy rates by a staggering 5.25% while shrinking its balance sheet. Why is this not visible in the current GDP figures?
Monetary policy lags
It is well known in economic literature that Fed tightening takes quite some time before it truly affects the economy. Economic transactions involving both prices and quantities are often agreed upon months before the execution and will not be adjusted when interest rates unexpectedly rise. Homeowners e.g. might sign an agreement for a housing renovation, which will take several months, if not years, to complete. Similarly, lags exist in contracts between manufacturers and retailers. Large firms and government agencies also typically define their budgets and pricing plans on an annual basis. Firms also tend to delay laying off employees until the costs become unbearable. Their investment plans are also set months or even years in advance and unlikely to be changed when rates rise (though some firms might opt for using cash buffers, rather than loans to finance these investments).
Monetary lags were studied extensively by economists. A few decades ago, Milton Friedman estimated that it took around 16 months for monetary policy to affect GDP and inflation. That view still holds today. Fed Governor Waller explained in a recent interview that monetary policy lags are expected to be between 12 and 18 months. He suggested that the lags could have dropped somewhat recently as banks adjust their rates more rapidly today when policy rates rise or fall.
When did the Fed start tightening?
Estimating when the Fed started tightening has become harder. Prior to the Global Financial Crisis, the tightening cycle started when the Fed funds rate increased. Nowadays, forward guidance on the future path of the Fed funds rate allows financial markets to react earlier. Furthermore, the central bank can now tighten monetary conditions by changing the size of its balance sheet (quantitative tightening), even if it leaves its policy rate unchanged, with a decompression of risk premia as a result. To better capture this broader stance of monetary policy, the San Francisco Fed created the proxy funds rate, which uses a combination of 12 financial variables, including Treasury rates, mortgage rates and borrowing spreads. The proxy funds rate was broadly in line with the Fed funds rate prior to 2009 but has diverged since then (see figure 1).
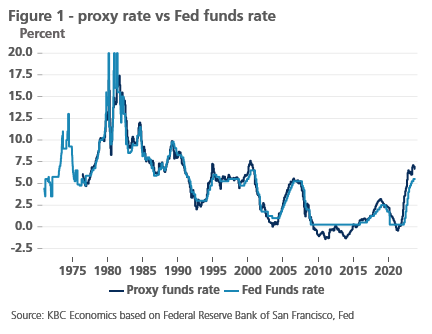
The proxy funds rate suggests tightening already started in June 2021. From then till now, the proxy funds rate increased by 7.5 percentage points (vs a 5.25 percentage point increase in the Fed funds rate). The most rapid pace of tightening took place in Q1 2022, according to the proxy funds rate.
Structural changes and covid increase the lag
Given rapid tightening in monetary conditions in Q1 2022 and an expected lag of 12 to 18 months, why aren’t we seeing a severe slowdown in Q3 2023? Several factors could be at play here.
A first factor relates to lending maturities. US households increasingly take on mortgages at fixed rates and the maturities of their mortgages are getting longer. The average single family mortgage maturity increased from 24.8 years in early 2000 to 28.2 years today. In a similar vein, consumer lending maturities increased from 5.2 to 5.5 years in the last decade. Indebted households will thus only feel a limited impact of rising rates for now.
A second factor is the long-term shift away from manufacturing to services. Since 2005, the value added generated by services as a percentage of GDP increased by 4.6 percentage points. Services are far less vulnerable to rate increases as they are less capital-intensive. This lesser vulnerability is clearly visibly in the current business confidence figures. Though monetary tightening has pushed manufacturing PMIs into contraction territory since Q3 2022, services PMIs remain firmly in expansionary territory today.
Finally post-pandemic effects are increasing the lag. On the supply side, supply chain disruptions limited the post-pandemic recovery in 2021 and 2022, but they are providing a positive boost to GDP in 2023 as the constraints are easing. Hence, goods consumption made negative contributions to GDP throughout 2022, but positive ones in 2023. On the demand side, US households accumulated an estimated 2.4 trillion USD in excess savings during the pandemic. This gave them a considerable buffer to weather the cost of rising rates and inflation. Households already drew down around half of these excess savings1. The forbearance of student loans further boosted consumption in the post-covid years, but this forbearance will end in October.
Conclusion
Structural changes and post-covid effects have allowed the US economy to withstand monetary pressure thus far. However, that does not mean that the Fed’s monetary tightening will not weigh on the economy eventually. As more companies and households take on new loans, the benefits of easing supply chains fade, excess savings diminish and student loan repayments restart, the economy will eventually weaken. We thus expect much slower growth in H2 2023 and 2024.
1“The Rise and Fall of Pandemic Excess Savings”, 2023, Hamza Abdelrahman and Luiz E. Oliveira, Federal Research bank of San Franciscio