

The housing market in the three Belgian regions


Abstract
Most economic analyses of the Belgian housing market focus on developments in the country as a whole. In this report we are concerned with the housing markets in the three Belgian regions (Flanders, Wallonia and Brussels Capital Region). In the first section we discuss relative price trends in the regions over recent decades. Overall, the trend in house prices has been broadly similar in Flanders, Wallonia and Brussels. This suggests that there were key common elements in the strong regional trend in prices, for example the robust increase in incomes and the sharp fall in interest rates, but also above all the favourable tax treatment of home ownership which was common to all the regions until a few years ago, in the form of the housing bonus. Yet there are also a number of specific regional price determinants. For example, the bigger average price rise in Flanders compared with Wallonia is partly due to the relatively stronger increase in Flemish land prices. According to our analysis, the recent regional reforms in the tax treatment of home ownership, which ushered in the end of the housing bonus, have had no significant effect on prices. The Covid-19 crisis impacted on the number of property transactions in Flanders especially, but also led to a weakening of the upward trend in prices. In Wallonia, and even more so in Brussels, prices continued to increase more robustly in 2020. However, there are also some indications that in these two regions, too, the upward trend in prices softened at the start of 2021. Taken together, the evidence suggests that all three regional housing markets are heading for a soft landing in 2021.
Whether or not the regional housing markets become overheated and run the risk of sooner or later undergoing a (sharp) correction depends on the degree of overvaluation. The analysis in the second section of this report suggests that the Flemish housing market is more overvalued than its counterparts in Wallonia and Brussels. The regional differences are however fairly small, which means there is evidently also a common component in the degree of overvaluation. Our simple econometric exercise also shows that the extent of overvaluation in the Flemish housing market (around 10%) is not yet genuinely problematic. The third section of this report focuses on the question of whether the increase in construction activity in recent years will lead to an oversupply of housing stock. The number of new homes in all three regions has been rising faster than the number of households for several years now, which could indicate an (imminent) oversupply. Wallonia has seen the sharpest increase in new housing units relative to the number of households. In Brussels, the increase in this ratio reversed an earlier reduction, suggesting that there is little or no oversupply in this region. This section of the report also compares the degree to which households in the three regions have to go into debt in order to be able to buy a home at current prices. Households in Flanders have to borrow relatively less than households in the other two regions. Levels of arrears are also lower in Flanders. There are more households with a home loan in Flanders, but that is due to the higher level of home ownership in the region.
1.House price trends 1973-2020
Analysis of regional differences
To illustrate the regional differences in house price trends, we draw on data from the Belgian statistical office, Statbel. That data is based on deeds of sale executed before a notary-public and registered by the Land Registry. Since virtually all transactions are included, these are the most reliable figures available. Moreover, long time series are available which facilitate analysis over an extended period. The figures do however only include sales of existing homes (the secondary market), because the Land Registry database does not enable us to create an accurate picture of total new-build sales. To gain an oppression of the trend in prices across the entire regional housing market, we calculate the transaction-weighted median price across the different dwelling types for each region.1 The median price is a more suitable criterion than the average price, because it is not influenced by extreme values.

Figure 1 shows that there have been consistent differences in the level of house prices between the three regions over recent decades. Since 1973, homes have almost always been most expensive in Brussels and cheapest in Wallonia. In 2020, the median price of homes sold in Brussels was 8.5% higher than in Flanders, and in Wallonia 30.3% lower.2 The variation coefficient of regional prices has been slightly above its long-term average in recent years. This suggests that the regional spread in prices has recently been slightly greater than the average in the period 1973-2020. Outliers in the price spread in recent decades have mainly been caused by Brussels Capital Region, where price trends have been more volatile than in Flanders and Wallonia. That is due to the urban character of Brussels and its more limited size compared with the two other regions. This results in greater sensitivity to certain changes (see below). Over the whole period 1973-2020, the average annual price increase was strongest in Flanders (+6.1%), followed by Wallonia (+5.8%) and Brussels (+5.5%)
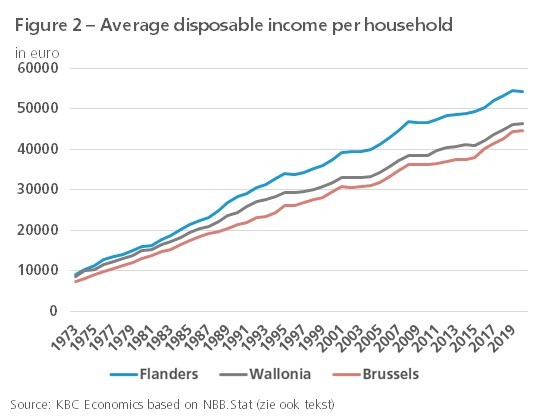
House prices are determined to a large extent by household borrowing capacity, which in turn depends on their disposable income and the level of interest rates. Interest rates for households were the same across the three regions over the period under consideration. The fact that prices in Flanders have been consistently higher than in Wallonia over recent decades has much to do with the average higher income levels in the former region (figure 2).3 The relatively stronger price trend in Flanders compared with Wallonia is also partly explained by the relatively steep rise in household income. The much stronger rise in the price of building land in Flanders compared with Wallonia has also played a key role. The reason for this disparity is the relatively greater scarcity of building land in Flanders due to the higher population density. According to a study by the National Bank of Belgium (NBB) in 2018, approximately three-quarters of the rise in house prices in Flanders since 1973 is attributable to the increase in land prices; the comparable figure for Wallonia is only around half.4

It is notable that, despite having the lowest disposable income per household, Brussels has the most expensive homes in Belgium. One explanation for this is the region’s function as the national capital; in other countries, too, house prices in the capital city are generally higher, and have also generally risen more sharply than elsewhere in the country, often driven by strong population pressure.5 The relatively steep rise in prices in Brussels since the start of the 2020s is particularly striking. Like the other regions, Brussels has seen strong population growth since the turn of the century (figure 3). This has been driven partly by the extensive presence of international institutions such as the European Commission, NATO, national embassies, etc.. This has resulted in strong demand for housing, especially in the higher-and segment of the market, but the cascade effect means this has also impacted indirectly on prices of other dwelling types. As the more desirable neighbourhoods, which gradually became unaffordable, could no longer satisfy demand for housing, demand spread to other, less expensive areas, where prices then soared too.6
Common price component
All in all, the trend in house prices has been broadly similar in all three regions, in contrast to the generally divergent trend in prices between European countries. For example, each region saw a sharp increase in prices from the mid-1990s until the financial crisis in 2008. There were no meaningful corrections anywhere during the crisis, and prices subsequently continued to rise strongly in all three regions. The broadly parallel trend in house prices suggests that, in addition to the different regional price determinants, common national factors also played a significant in the regional price trends. Those factors include the sharp fall in interest rates, the operation of the mortgage market and (since 2014) macro-prudential policy, and above all the tax treatment of home ownership, which until a few years ago was almost identical in all three regions. In particular the housing bonus, which was introduced in 2005 and substantially increased the tax breaks for home ownership, boosted prices across the whole of Belgium. Another, more specific policy intervention at federal level was the tax amnesty introduced in 2005, referred to as the One-Time Full Relief Declaration (EBA). This opened the way for repatriation of savings held abroad, some of which ended up being invested in the property market throughout Belgium.
During successive state reforms, housing policy increasingly became a regional competence. The fifth state reform (the Lambermont Agreement of 2000-2001) devolved competence for property registration duties to the regions. Those duties were subsequently lowered in Flanders and Brussels, in 2002 and 2003, respectively, but not until 2009 in Wallonia, which may partly explain the slightly less robust price trend in that region prior to the crisis.7 During the sixth state reform (2012-2014), tax relief for home loans was made a regional competence. The regions began reforming this tax system since 2015. The conditions for and timing of the reform of the housing bonus diverged between the regions, but in general the intention was to reduce and ultimately scrap the tax relief on new mortgage loans for households owning their own homes. Studies had shown that the housing bonus had an (inefficient) effect in pushing up prices on the housing market.8
The housing bonus for new mortgage loans was initially reduced in Flanders in 2015, and only scrapped entirely from the start of 2020. To compensate for this, the registration duties on the purchase of a home were reduced. Brussels took this step much earlier, in 2017, while in 2016 Wallonia opted to replace the housing bonus with a tax credit which was linked to household income. As the reforms were not implemented simultaneously in the three regions, and since the details differed somewhat, it was to be expected that the regional differences in house price trends would be greater after 2015 than before that date. Figure 1 shows little indication of this: the variation coefficient was not significantly higher after 2015 than the average for the period 1973-2020. The housing bonus reform had a clearly visible impact on the housing market in each region. There was some effect on home purchases in anticipation of the change, but once it came into force prices continued to rise at a substantial pace (see also the econometric exercise later in this report). This may be because there were other common factors in recent years which had a more dominant impact on the price trends in the different regions; specifically, those factors included the ultra-low interest rates and the strong labour market performance prior to the onset of the Covid-19 crisis.
Recent trend during Covid-19 pandemic
According to the house price index published by Statbel, house prices across Belgium as a whole rose by 4.2% in 2020. That is slightly above the 4.0% recorded in 2019, largely due to the strong rise in the fourth quarter of 2020 (+5.7% year-on-year). The index, which is calculated in accordance with European regulations and is submitted to Eurostat, measures price trends based on the assumption that the characteristics of the sold property remain unchanged. The Eurostat index is not available for the regions. The figures for the regions, also published by Statbel based on deeds of sale, are currently only available for the first three quarters of 2020. The transaction-weighted median price across the different dwelling types increased in Flanders, Wallonia and Brussels over the period by 2.6%, 4.7% and 8.1%, respectively, compared with the same period a year earlier. These figures are an underestimate for the full year 2020, since we already know from the Statbel house price index referred to that the price increase in the last quarter was very steep.
The continuing robust price rises in 2020, despite the economic shock presented by Covid-19, took place against the background of a sharp downturn in the number of sales transactions. This was largely due to the lockdown measures, which put a major brake on sales. It is interesting in this context that the number of transactions shrank much more sharply in Flanders (-24.6% in the first three quarters compared with a year earlier) than in Wallonia (-11.0%) and Brussels (-14.3%). It is likely that the relatively weaker demand for real estate also played a bigger role in Flanders than in the other two regions. That weaker demand was due on the one hand to the exceptional peak in sales activity in 2019, before the scrapping of the housing bonus, while on the other hand the pandemic appears to have hit Flanders harder in 2020, which could have dampened housing demand more.9 Both factors also offer an explanation for the relatively more muted price rises in Flanders in 2020. Prices of houses, in particular, lagged behind in Flanders, rising by 2.8% in the first three quarters compared with +4.5% in Wallonia and +8.2% in Brussels. Prices of apartments, probably driven in part by strong interest from investors, continued to rise fairly strongly in Flanders, up by +5.8% over the first three quarters, compared with +5.5% in Wallonia and +8.0% in Brussels.
The Federation of Belgian Notaries recently published an initial estimate of the price change in the first quarter of 2021. The figure (+2.0% year-on-year for Belgium as a whole) suggests that the upward price trend is easing and that the housing market is heading for a soft landing in 2021. Broken down by region, the slowing price growth is now much more pronounced in Wallonia and Brussels. Prices of houses and apartments in Wallonia actually fell slightly (-0.2% and -0.8%, respectively) compared with a year earlier. In Brussels, the drop in prices of houses was even greater, at 3.0%, though prices of apartments still rose by 1.9%. The upward trend in prices held up better in Flanders in the first quarter (+2.5% for houses and +3.1% for apartments). However, differences of definition mean these figures are not directly comparable with those published by Statbel.10
2.Housing market valuations
Traditional measures
The literature still frequently uses simple measures to ascertain whether homes are expensive, and the housing market therefore overvalued. The best known technique is to relate the trend in house prices to the trend in average household disposable income. The current value of this price-to-income ratio is then compared with the long-term average that is assumed to correspond with an equilibrium level.11 If the ratio rises too much above its long-term average, that is an indication that the capacity of households to finance the purchase of a home is in jeopardy and that house prices have probably risen too far. In this sense, the ratio measures the affordability of home ownership for the average household.
In order to be useful as a valuation measure, this ratio needs to be calculated over the longest possible time horizon. Regional figures on household income are however only available in the Regional Accounts for the years 1995-2018. For the years before 1995 and for the year 2019, we have therefore compiled our own estimate of disposable income by adjusting the gross regional product of the different regions, for which we do have a long time series of data, for commuter flows.12 This approach is not suitable for 2020, because incomes were heavily supported by the government during the coronavirus crisis, while economic activity was badly hit. At present, figures for disposable household income for Belgium as a whole are only available for the first three quarters of 2020. Based on our estimate of the nominal disposable income of all Belgian households (+0.9%), and taking into account our estimate of regional economic growth in 2020 (see footnote 9), we estimate the growth in the nominal disposable income of Flemish, Walloon and Brussels households at 0.8%, 1.0% and 1.1%, respectively.
Figure 4 shows a very similar trend in the price-to-income ratio in the three regions, and suggests a fairly substantial overvaluation in each region in 2020. However, the ratio has been somewhat higher in Flanders in recent years than in Wallonia and Brussels, where it fell after the financial crisis before later rebounding again. The degree of overvaluation indicated by this measure for 2020 was 61% in Flanders, 56% in Wallonia and 59% in Brussels. In practical terms, these figures express the degree to which the ratio was higher in that year than its long-term average in the period 1980-2020.

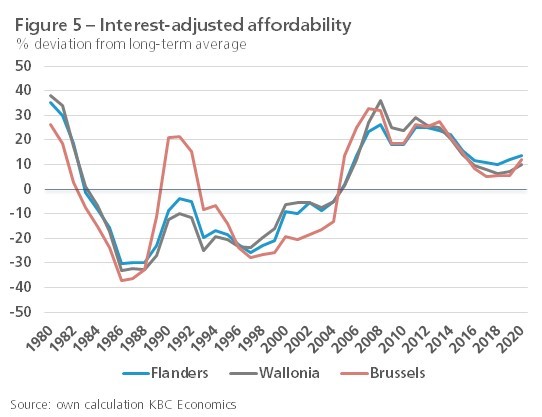
The advantage of the price-to-income ratio is its simplicity. However, a major drawback is that it only measures one aspect (income) and ignores other determinants of price. For example, the affordability of real estate depends not just on income, but also on the trend in mortgage interest rates, which determine the repayment burden and thus the borrowing capacity of buyers. If we adjust the price-to-income ratio for the trend in interest rates, this gives us the interest-adjusted affordability. Here, the annual amount that mortgage borrowers have to repay each year (both capital and interest) is compared with the disposable income per household.13 The greater the divergence between the annual payment and income, the more difficult it becomes to finance the purchase of a home. As with the price-to-income ratio, this more extensive measure of affordability is expressed as a percentage deviation from its long-term average. Calculated in this way, the overvaluation peaked in the regions in 2008, but then fell in response to the subsequent fall in interest rates (figure 5). Once again, the regional differences are not very large, with Flanders showing the greatest overvaluation in 2020 (13.4%), followed by Wallonia (9.9%) and Brussels (12.0%).
Econometric approach
The traditional valuation ratios described above are hampered by the shortcoming that the result is highly sensitive to the period chosen to calculate the long-term average. In our calculation, that period is 1980-2020, but if we had only included figures since, say, 2000, the calculated overvaluation would have been lower. More specifically, the problem (especially for the price-to-rent ratio) is that the values of the ratio do not oscillate around the average. As a consequence, the long-term average cannot really be used as an equilibrium level. To make up for this shortcoming, we can try to explain the price trend in econometric terms based on a series of fundamental demand determinants.¬ As well as income and mortgage interest rates, these also include factors such as the demographic trend or changes in the tax treatment of real estate ownership. Because long time series relating to supply variables (e.g. investments by households in residential property) are not readily available, and especially not at regional level, supply factors are generally not included in such calculations.
The aim is then to look for a long-term equilibrium relationship between regional house prices and these determinants. The degree to which the actual house prices in the three regions deviate at a given moment from the equilibrium value estimated using regression analysis, can then be seen as a measure of over or undervaluation.15 Our estimated equation for each of the three regions is as follows:
log(wptg) = a0 + a1.log(bitg) + a2.hrt + a3.log(famtg) + a4.dwbt + a5.dfhtg + ut
where:
wptg = house prices in region g
bitg = average disposable household income in region g
hrt = the mortgage interest rate (identical for each region)
famtg = the number of households in region g
dwbt= dummy variable from 2005 representing the housing bonus (identical for each region)
dfhtg = dummy variable which expresses the recent housing market tax reforms in region g
As we are forced to work with annual figures for the period 1980-2020, the number of observations is limited. Nominal house price values, the average disposable income and the mortgage interest rate were deflated based on the consumer prices index in order to neutralise the effect of the general trend in prices. All variables, with the exception of the mortgage interest rate and the dummy variables, are moreover expressed in logarithmic form. The dummy variables which express the reform of the regional tax treatment of residential property are binary variables which assume the value of zero/one before/after the reform. For Flanders, we test two dummies: one which expresses the reduction of the housing bonus in 2015, and one which reflects the abolition of the bonus in 2020. For Wallonia and Brussels, the dummy variables relate to the scrapping of the housing bonus in 2016 and 2017, respectively (see also above).
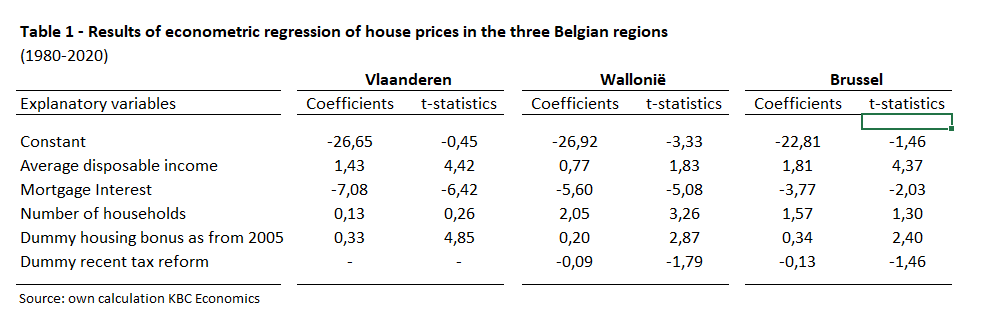
Table 1 summarises the results of the regression analysis. As (most of) the coefficients deviate significantly from zero and also carry the expected sign, we may assume that the variables are fundamental housing price determinants in the regions.16 The first notable observation is that the coefficient of disposable income is highest in Brussels and lowest in Wallonia. These figures represent elasticities, which means that an increase in income of 1% leads to an increase in house prices of 1.4%, 0.8% and 1.8% in Flanders, Wallonia and Brussels, respectively. The results also show that a reduction in the mortgage interest rate of 1% leads to a bigger increase in prices in Flanders (7.1%) than in Wallonia (5.6%) and Brussels (3.8%) (these are semi-elasticites). The model also suggests a significant influence of demography in Brussels, with an elasticity of 2.1, which means that an increase of 1% in the number of households leads to a price increase of 2.1%. For Flanders and Wallonia, the coefficient carries the expected sign, but does not differ significantly from zero. Finally, the introduction of the housing bonus in 2005 is found to have pushed up prices significantly in all three regions, albeit to a greater extent in Flanders and Brussels than in Wallonia. By contrast, the more recent regional reforms in the tax treatment of residential property have had no effect. The coefficient of the relevant dummy variable does carry the expected sign in Wallonia and Brussels, but does not deviate significantly from zero. In Flanders the coefficient actually carries the ‘wrong’ sign (and has therefore been omitted from the regression shown in the table).
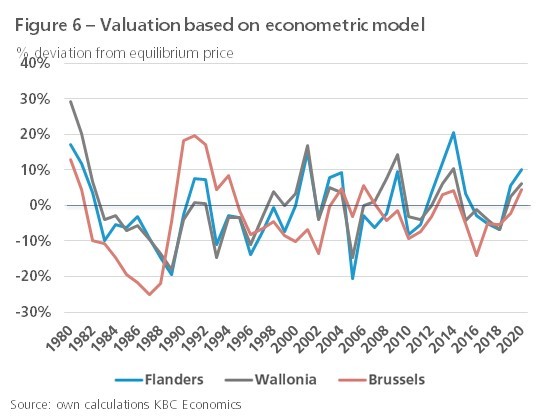
The difference between the actual house prices and the equilibrium price as estimated by the model gives an indication of the degree of over or undervaluation of the housing market. According to the calculations, that difference amounted to 10.0%, 6.3% and 4.5%, respectively, in Flanders, Wallonia and Brussels in 2020, suggesting that their housing markets were overvalued by those percentages during that year (figure 6). As with the traditional valuation measures, the differences between these regional figures are not very pronounced. A key observation is thus that there is evidently also a common component in the degree of overvaluation in the three regions. By way of information, we have for some time used a similar econometric model for Belgium as a whole, and calculated an average overvaluation of 8.0% in 2020. That figure is not directly comparable, however, because the model for Belgian house prices is based on quarterly rather than annual data, and the model specification also differs slightly.
The overvaluation of the regional housing markets in 2020 as indicated by the model must be interpreted with a degree of caution. For example, the valuation figures relate only to the first three quarters of 2020 due to a lack of regional data for the fourth quarter. As stated earlier, the house price index published by Statbel indicates that prices in Belgium as a whole rose very sharply in the final quarter of 2020 (+5.7% year-on-year). To the extent that this effect was mirrored to an equal extent in each of the three regions, the overvaluation in 2020 is likely to have been higher than calculated here. Additionally, the calculation is based on the assumptions discussed earlier for regional disposable incomes in the years 2019 and 2020, for which no official figures are yet available. Finally, some caution is needed with regard to the results for Brussels. As well as the income of Brussels residents, the incomes of citizens outside the region may also play a role in pricing, given that people who do not live in the Capital Region also buy property within it.
3.Other housing market vulnerabilities
Threat of oversupply
The solid sales activity on the secondary housing market in the years before Covid-19 was accompanied by an equally strong uptick in activity on the new-build market. This occurred in each of the three regions and boosted the total housing stock in Flanders, Wallonia and Brussels by 10.1%, 9.5% and 7.7%, respectively, between 2010 and 2020. The housing supply thus appears to have adapted well to the equally sharp rise in the number of households. To estimate whether and to what extent this has given rise to an actual or threatened oversupply in the market, we relate the number of housing units (the sum of all houses and apartments) to the number of households. Figure 7 shows that this ratio has been consistently above one in each region in recent decades. This is because second homes, student rooms, and so on, are also included in the figures on housing units. Partly due to the many second homes on the coast, the ratio in Flanders is higher than in Wallonia and Brussels.
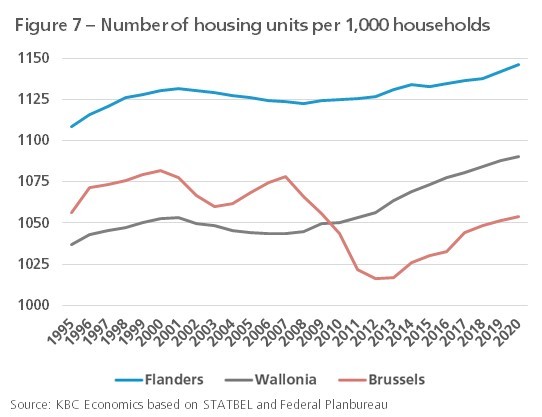
It is not so much the size of the ratio of housing units to households that could indicate the risk of oversupply, but its trend over time. Broadly speaking, in the last decade the ratio has risen more in Wallonia than in Flanders. At local level, too, the districts which have seen the sharpest rise in the ratio are situated mainly in Wallonia (in Flanders, the district with the strongest increase is Ghent, see figure 8). It is however difficult to determine whether there is an actual or threatened oversupply at local level, because the relatively sharp rise in the ratio can also occur if we start from a position of a housing market squeeze. The trend in the ratio in Brussels, in particular, is very striking. The housing stock in Brussels increased much less than the number of households between 2007 and 2012. Although the ratio in the Brussels Capital Region increased substantially thereafter, this did not compensate for the earlier trend, and the ratio in 2020 was still below that in 2007. The atypical trend on the Brussels market can perhaps be partly explained by a more limited supply of building land and stricter urban development regulations.

Household mortgage debt
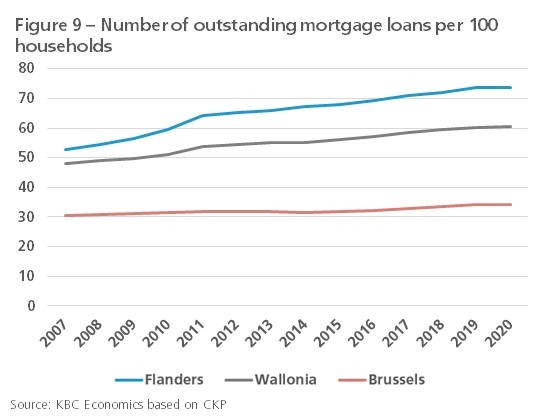
To investigate whether the trend in prices on the housing market is problematic, we also need to look at the extent to which households are forced to take on debt in order to purchase a home at current prices. No regional figures are available on the total mortgage debt position of households. We can however estimate the extent to which households take out loans by relating the number of outstanding mortgage loans (figures from Central Individual Credit Register, CKP) to the number of households. This ratio is not only higher in Flanders, but has also risen faster over the last 15 years than in the two other regions (figure 9). The ratio in Brussels is relatively low and has also been fairly stable.
Regional figures are also available on the average amount borrowed to finance the purchase or construction of a home. If we relate that amount to the regional house price, this gives us the average ‘loan to value’ (LTV).( The LTV in Flanders has been substantially lower over the last 15 years than in Wallonia, where it was in turn lower than in Brussels (figure 10). The average amount borrowed in relation to average disposable household income was also relatively low in Flanders, and relatively high in Brussels especially. The conclusion is that there are more households with mortgage loans in Flanders, a finding explained partly by the higher home ownership in that region, though these home-owners relatively less often need to borrow in order to acquire a home. The situation in Brussels is precisely the reverse, while Wallonia occupies an intermediate position.

The extent to which households are unable or struggle to meet their mortgage repayments also gives an indication of whether there is a problematic trend on the regional housing markets. The EU Statistics on Income and Living Conditions (SILC) also provide useful information on this point. These statistics define ‘excessive housing costs’ as the percentage of people living in a household where the housing costs, including the repayment of a mortgage loan, account for more than 40% of disposable income. According to this definition, 6.0% of the population in Flanders were living in a household in 2019 where housing was considered unaffordable; that is lower than in Wallonia (9.0%) and considerably lower than in Brussels (19.5%). Flanders also scores relatively better when it comes to mortgage arrears. Figures from the Central Individual Credit Register (CKP) show that both outstanding payment defaults as a percentage of the outstanding loans and the number of borrowers in arrears as a percentage of the total number of borrowers is lower in Flanders (figure 11). The figures are however still on the low side everywhere, after falling in earlier years, despite the severe impact of the Covid-19 crisis. That can be explained partly by the mortgage payment holidays offered to households who were pushed into financial difficulties by the Covid-19 crisis.

The steep rise in house prices in Belgium as a whole in recent decades is also reflected in the figures for the three regions. The broadly comparable trend in prices suggests that there were key common elements in the strong regional price trend, for example the sharp fall in interest rates, the general increase in incomes and the operation of the mortgage market, but also above all the favourable tax treatment of home ownership which the regions all pursued until a few years ago in the form of the housing bonus. Yet there are also a number of specific regional price determinants. In this regard, a study by the National Bank of Belgium (NBB) highlighted the fact that the stronger average price rise in Flanders compared with Wallonia over recent decades was partly attributable to the relatively stronger increase in land prices. According to our analysis, the recent regional reforms in the tax treatment of home ownership, which ushered in the end of the housing bonus, have had no significant effect on house prices. The Covid-19 crisis impacted on the number of property transactions in Flanders especially, but also led to a weakening of the upward trend in prices. In Wallonia, and even more so in Brussels, prices continued to increase more robustly in 2020. However, there are also some indications that in these two regions, too, the upward trend in prices softened at the start of 2021. Taken together, the evidence suggests that all three regional housing markets are heading for a soft landing in 2021, provided we do not see an abrupt increase in interest rates.
Whether the regional housing markets are becoming overheated and whether there is the risk that they will sooner or later go through a (heavy) correction, depends on the degree of overvaluation and whether the increased building activity in recent years will result in an oversupply of housing stock. Our analysis suggests that the Flemish housing market is more overvalued than the markets in Wallonia and Brussels, though the differences are fairly small. Our econometric exercise also shows that the extent of overvaluation in the Flemish housing market (around 10%) is not yet genuinely problematic. The number of new homes in all three regions has been rising faster than the number of households for several years now, which could indicate an (imminent) oversupply. Wallonia has seen the sharpest increase in new housing units relative to the number of households. In Brussels, the increase in this ratio reversed an earlier reduction, suggesting that there is little or no oversupply in this region. The degree to which households are forced to take on debt in order to acquire a home at current prices also poses a risk for the housing market. Households in Flanders have to borrow relatively less than households in the other regions. Levels of arrears are also lower in Flanders. There are more households with a home loan in Flanders, but that is due to the higher level of home ownership in the region.
1The median price for each dwelling type is multiplied by the number of sales transactions for that dwelling type. We then add together the total for all dwelling types and divide this figure by the total number of transactions for all dwelling types. Until a few years ago, Statbel recognised three dwelling types: houses, villas and apartments. As the distinction between houses and villas is somewhat subjective, since 2017 Statbel has drawn a distinction between houses based on the number of external walls (two, three and four or more). The dwelling type ‘apartment’ was maintained.
2This is the average over the first three quarters, as figures for the fourth quarter are not yet available.
3We also provide more detail in the text about the calculation of the average disposable income per household in the three regions.
4P. Reusens & Ch. Warisse (2018), ‘Woningprijzen en economische groei in België’ (‘House prices and economic growth in Belgium’), Economisch Tijdschrift (‘Economic Journal’), December, pp. 85-111. Brussels was left out of the analysis because the relative scarcity of building plots means the number of transactions involving plots is limited.
5 See also KBC Economische Onderzoeksrapport (‘Economic Research Report’) dated 30 March 2021: ‘Woningmarkten in de Europese hoofdsteden: welke steden lopen het risico op een vastgoedzeepbel?’ (‘Housing markets in the European capitals: which cities are at risk of a property bubble?’). .
6 Bernard, N. (2008), ‘De impact van de Europese Unie op het vastgoed in Brussel: tussen cliché en onderschatting’ (‘The impact of the European Union on real estate in Brussels: between cliché and underestimate’), Brussels Studies, no. 21
7 In Flanders, this decrease was moreover accompanied by transferability, whereby (young) families were encouraged to invest in their first home comparatively early on, and then buying a larger home at a later stage as their income made this possible.
8 See e.g. A. Hoebeeck (2019), ‘The tax benefit for mortgage payments: incentive effects and implications for house prices’.
9 See KBC Economische Onderzoeksrapport (‘Economic Research Report’) dated 16 February 2021: ‘Regionale economische groei in België’ (‘Regional economic growth in Belgium’).
10 For example, the notarial statistics take no account of luxury villas and investment properties. Moreover, they relate to the moment of signature of the provisional sale agreement, whereas the Statbel figures relate to the moment of entry in the Land Register.
11 Another frequently cited measure is the which relates the house price to the rental price. Over the long term, both should run in parallel. That is logical, because if house prices rise faster than rents, renting a home will become relatively more attractive, and vice versa. As we do not have access to regional figures on rents, however, we are not able to quantify this measure for the three regions.
12 In essence, this adjustment means that the production of commuters who cross the regional borders is assigned to their place of residence.
13 The calculation assumes a mortgage with a fixed interest rate and a term of 20 years. The same mortgage rate is used for all three regions.
14 To use the jargon, this is not a ‘stationary series’
15 In econometric terms, this is a co-integration relationship. The deviation between the actual house price and the estimated equilibrium value corresponds in econometric terms with the residue of the regression comparison.
16 The Augmented Dickey-Fuller test also indicates that the residues in the regressions are stationary (absence of a unit root), so that we can assume a co-integration relationship between the variables.