

The future of (de)globalisation; Challenges for international trade in pre- and post-corona times
Abstract
Since the end of World War II, trends in international trade have varied. The global financial crisis halted a period of deep globalisation marked by high trade growth figures and increasing global integration. The period that followed was characterised by sluggish growth in international trade. Throughout all this, trade protectionism has been present in varying degrees. In recent years, protectionist measures have gained popularity. Not only import tariffs – e.g. in the US-China trade war – but also more hidden trade hampering measures have been increasingly used across the globe in an attempt to protect domestic firms against competition from abroad. Trade policy measures have also been implemented for non-trade purposes related to political issues or technological leadership. The overall macroeconomic impact of this has been negative. The outbreak of the Covid-19 pandemic undoubtedly poses new short-term challenges for international trade via both demand and supply shocks. However, there could be some longer-term consequences as well for the international trade environment. The corona crisis might cause a new wave of deglobalization as economic nationalism is dramatically rising and companies face incentives to relocate their production chains towards closer regions due to global value chain disruptions. Counterintuitively, this may lay the foundation for a renewed upward phase in the globalisation cycle further in the future. After all, regionalisation promotes competition within a region and hence supports microeconomic forces that underpin globalisation. That the short-term outlook for international trade is challenging, however, is far more certain.
Content table
-
International trade dynamics over the years - Trade protectionism: a changeable constant
- From trade war to technology war
- Macroeconomic implications
- Globalisation in the post-corona era
Read the publication below or click here to open the PDF.
'The past few decades have seen different trends in international trade dynamics. Since the Global Financial Crisis in 2008-2009, international trade growth has slowed down significantly compared to pre-crisis years. The rise in trade tensions since US President Trump took office, only reinforced that trend. Questions about the future of trade globalisation have hence presented themselves. What's more, even a reversal of past globalisation trends - so-called deglobalisation - is not impossible. This research report first gives an overview of international trade dynamics over the past decades. The second part focusses on the role of trade protectionism and the drivers behind it. Thirdly, a short overview of the macroeconomic implications of trade protectionism is presented. A conclusion with the prospects for international trade in a post-corona era is added at the end.
1. International trade dynamics over the years
1.1. From deep globalisation…
The end of World War II meant the start of a long period of expansion in international trade flows, well into the 21th century. According to figures from the World Trade Organization (WTO), average annual growth of global merchandise exports, corrected for price changes, reached 8% in the period of 1950 to 1973. Both the US and the EU were the main driving forces behind this substantial growth in exports and imports during this time frame. The US paved the way for a far-reaching globalisation wave. As global economic leader, the US advocated several free trade initiatives, in particular multilateral trade liberalisation within the framework of the WTO. The European Union (EU) supported this globalisation trend too, on top of the strong growth in intra-European trade flows during the European integration process (e.g., the establishment of a European Customs Union in 1968). Apart from trade policy liberalisation, new transportation technologies such as cars, planes and later container ships helped to drive the global increase in trade as well. As such, the world witnessed a long and continuous boost in international trade. It was only interrupted by a temporary dip in the 1970s caused by the oil price shocks and the related jump in inflation.
In the 1980s, international trade continued its growth path thanks to the opening up of various developing and emerging economies, notably Japan and the Asian Tigers. Following the fall of the Iron Curtain at the end of the 1980s, Central and Eastern European countries’ trade integration with Western Europe contributed substantially to further global trade growth. Trade within the Soviet Union and its satellites had been mainly controlled by the state rather than by market forces and was separated from the rest of the world. The creation of the World Trade Organization (WTO) in 1995 marked the biggest reform of international trade in the post-war period. In contrast to earlier multilateral trading systems such as the General Agreement on tariffs and Trade (GATT), the WTO dealt not only with trade in goods, but also with services trade and intellectual property. The Organization stimulated bi- and multilateral cooperation and many countries became part of one or more free trade agreements. In 2001, China became a member of the WTO. For the most part of the 20th century, China had been an isolated economy. Its membership to the WTO turned this around and caused a spike in Chinese exports to the rest of the world and in particular to developed economies such as the US and the EU. Meanwhile, the rise of the internet improved connectivity and supported the deepening of global value chains.
In general, economic policy, even beyond mere trade policies, was a key driver behind the surge in globalisation. This entailed the elimination of restrictions on international trade and financial flows. A lot of countries eased their balance of payments restrictions and/or made their currencies convertible. Large-scale deregulation - including deregulation, liberalisation and privatisation to increase competition - was also part of the policy mix that enabled further globalisation.
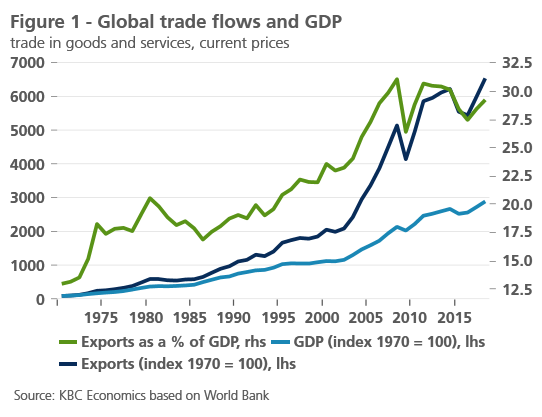
As a result, globalisation became a global economic trend in the 1990s and beginning of the 21st century, which supported economic growth and welfare. Global goods and services exports grew at a much faster pace than global GDP (figure 1). On the eve of the global financial crisis, worldwide exports accounted for more than 31% of global GDP in 2008, the highest share in history. In several countries with high trade openness, total trade was worth more than 100% of GDP. In tandem with the rapid rise in international trade flows, international investment flows also flourished, though their dynamics were more volatile. The global stock of outward foreign direct investments reached roughly 32% of global GDP in 2007.
1.2. …to a sudden stop without return to pre-crisis trends
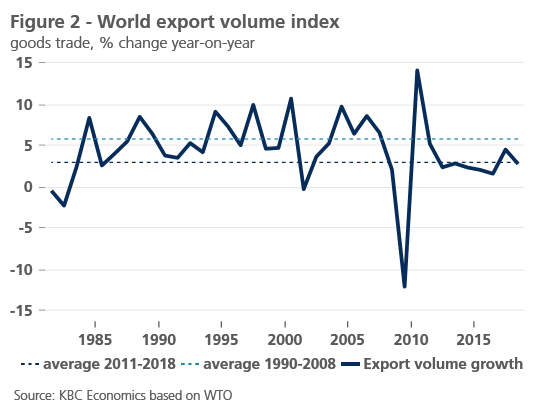
The global financial crisis in 2008-2009 caused the most severe worldwide financial and economic shock since the Great Depression in the 1930s. Unsurprisingly, since the impact of the crisis was shared across the globe, international trade was hit hard by the decline in global demand, a surge in uncertainty and the disruption of global value chains. Both the value and volume of international trade were negatively affected. In 2009, global goods trade volumes declined by more than 12% yoy (figure 2). Because of large price declines, particularly for commodities such as oil, the decline in global trade values was even more severe (-22%). In general, the collapse in world trade was highly synchronised across regions. The magnitude of the fall in export volumes was roughly equal for the US, China and the EU, but much larger for countries with a high export dependence such as Japan and individual EU member states.
Global trade volumes fell more steeply than world GDP. There are several reasons for that. To begin with, GDP components such as investment, inventories and durable goods consumption are very trade-intensive as the process from raw material to finished product involves a lot of cross-border trading. These GDP components also tend to be far more volatile than GDP components that have less tradability such as services and non-tradable goods consumption. Therefore, international trade dynamics are more pronounced than swings in economic activity. The growing importance of global supply chains likely contributed to the higher volatility of international trade flows too. Intra-company trade flows cause additional volatility in trade.
As global economic growth recovered, the sharp drop in global trade flows in 2009 was followed by a swift upturn in global trade volumes growth in 2010 (+14%). However, in the following years, there was no return to the high trade growth pace that was seen before the global financial crisis. Average annual export volume growth between 1990 and 2008 equalled 5.81%. This almost halved to 2.97% average growth in the period between 2011 and 2018, which was even below average annual real GDP growth (3.64%) of the world economy. As a result, the continuous trend of ever more globalisation, as expressed by the ratio of exports to GDP, came to a halt. The world economy entered a period in which globalisation was no longer a fundamental and permanent trend, and some trend reversal became visible.
1.3. Causes of international trade slowdown
Several factors have been identified as the driving forces behind the sluggish performance of international trade since 2011. First, economic trends play an important role. The IMF (2016) found that geographical shifts in economic activity are an important driver of the weaker international trade trends. Emerging economies’ share in global activity has been rising over the past decade. These economies tend to have a lower trade intensity than advanced economies. In combination with their increasing weight in the global economy, this leads to slower overall trade growth globally. The increasing importance of less trade intensive services sectors also contributed to the trend reversal in international trade growth. In addition, more general socio-economic tendencies are at play as well. An increased awareness of the environmental challenges to which international trade contributes and more focus on buying local, add to the declining international trade growth. Technological developments, such as 3D printing, also reduce the need to trade internationally.
Furthermore, company-related strategy trends, such as the declining growth in global value chains and the movement of production closer to places were demand is highest, are cited as reasons for slowing international trade growth. As was the case for the sharp increase in trade before the global financial crisis, economic and trade policies played a role in the recent trade growth slowdown as well, with, especially in recent years, a pronounced resurgence of protectionist policy measures.
1.4. Head-on collisions in recent years
Although always present in some kind of form, trade protectionism has been a dominant economic theme again in the most recent years. It is mainly US trade policy under the Trump administration that has caused this spike in attention to international trade matters and so-called unfair competition from abroad. Already during his election campaign in 2016, President Trump promised to deal with unfair trade practices, in particular by important US trading partners such as China, Canada, Mexico and the European Union. Their policies were held responsible for the structurally negative US trade balance. Since his inauguration in 2017, President Trump has put his money where his mouth is and implemented several of the trade policies he announced during his campaign. Topics like ‘trade war’ and ‘tariffs’ have since been overly present in news headlines and have predominated financial markets.
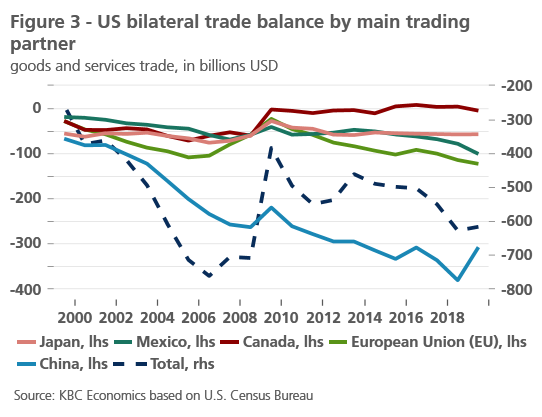
President Trump has repeatedly focused on the US trade balance and in particular bilateral trade balances with US trading partners. The total US trade balance, measuring total US exports minus total US imports, has been negative since the 1970’s already. However, the trade deficit sharply worsened during the years before the global financial crisis of 2008-2009 (figure 3). The global financial crisis abruptly reversed this trend, but the US trade deficit widened again in the past decade. The main contributor to this large US trade deficit over the past twenty years was the bilateral US trade deficit with China that significantly increased since China joined the WTO . The bilateral trade balance with the EU has also been negative and growing over the past years.
China has been the main target of protectionist trade measures implemented by the Trump administration. The first measures taken, among a series of protectionist actions that followed, were safeguard tariffs on $8.5 billion in imports of solar panels and $1.8 billion of washing machine imports introduced in January 2018. Though the tariffs were applied to US imports coming from anywhere, they mainly targeted Asian economies and in particular China. The effective start of the escalating international trade conflict, however, was the implementation of US import tariffs on steel and aluminium later that year based on the argument of national security threats. Mexico, Canada, the EU, South Korea, Brazil, Argentina, and Australia were initially exempted, but that was cancelled after June 2018 - though reinstated for Mexico and Canada in the context of NAFTA renegotiations. Since China is not a major exporter of steel and aluminium to the US, the tariffs mainly hit other US trading partners such as Brazil and South Korea. However, the hidden US intention was clearly to hurt China. The move sparked several retaliation measures across the globe.
A 2017-18 investigation by the US Trade Representative concluded that several Chinese trade practices were “unreasonable or discriminatory and burden or restrict US commerce”. The investigation was about more than trade issues alone and had to clarify whether Chinese rules and measures were harmful for US intellectual property rights or innovation. The results kicked off the direct confrontation between China and the US. Based on the findings of the report, a first set of US tariffs on imports originating from China were implemented in July 2018. As trade negotiations between the two countries went far from smoothly in the following months, several new tariff rounds with consequent Chinese countermeasures followed. Table 1 provides a full overview of all US-China trade war episodes.
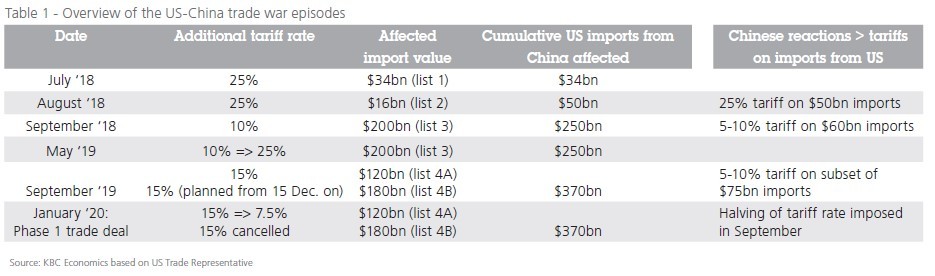
The US-China trade war triggered a slowdown in the global economy and hit, in particular, the manufacturing sector and its tradable goods. The US and China gradually started looking for solutions to their conflict. The escalation of the trade conflict was halted by the signing of the Phase 1 trade deal in January 2020. It was supposed to be a first step in a gradual and longer-term process of normalization in US-China trade relations, taking into account the main US concerns about unfair Chinese economic practises. The trade deal includes China’s pledge to increase US imports by around USD 200 billion over the next two years compared to the 2017 import value. China promises to import more American agricultural products in particular, but also more industrial and energy products, foodstuff and services. Besides, China also commits to better protect US intellectual property and to end the forced transfer of foreign technology to Chinese companies. In addition, China has committed to opening up its financial services more to US companies and to avoiding competitive currency devaluations. The US government has agreed to reverse a number of import tariff increases. In particular, the US halved the tariff rate of 15% that was applied to some USD 120 billion worth of goods imported from China – which had been in force since September 2019 – to 7.5%. In addition, the US is withdrawing its threat to impose additional import duties on products such as laptops, clothing and smartphones. To ensure compliance and to resolve disputes, the deal also includes a dispute settlement mechanism. It sets out procedures to be followed in the event of either party’s failure to comply with the agreement.
The Phase 1 deal does not mean the end of the US-China trade dispute though. For one, it does not remove all the protectionist measures introduced over the past years. In addition, there are many questions about the actual implementation of the agreement. For example the Chinese ability to comply with its sizeable import commitments is rather questionable (also see Box 1 in KBC Economic Perspectives February 2020). There is also little information on potential further reductions in import duties. According to US President Trump, negotiations on a Phase 2 trade deal will start soon, but the Chinese negotiators want to see the Phase 1 agreement implemented first. Negotiating a Phase 2 agreement will moreover be even more difficult than its predecessor, as more thorny issues in Sino-American trade relations - including cybertheft, digital trade and industrial subsidies to state-owned companies - will have to be addressed. If a Phase 2 agreement is a precondition for a further reduction in US import tariffs, it may be a long time coming. Obviously, the global economic consequences of the corona crisis will make it even harder to conclude any new trade deals soon.
1.5. EU: safe outsider or next victim?
Although the Phase 1 deal trade is only partial and far from everything in it is clear, the easing in trade tensions between the US and China was a relief to financial markets and supported global economic sentiment. These positive effects on global sentiment were rather short-lived as a consequence of the Coronavirus outbreak. At first sight, Europe in particular should be able to benefit from the situation, all else equal, since the European economy is more dependent on international trade than the American and Chinese economies. However, an improving US-China trade relationship is not necessarily positive for the European economy. The EU is caught between two fires now and is increasingly becoming the target of more assertive trade policies by both superpowers (also see KBC Economic Opinion of 18/12/2019).
US President Trump accuses the EU of unfair trade practices - including a weak euro, a protectionist agricultural policy and excessive tariffs on car imports. A ceasefire with China increases the likelihood that the US will turn its attention to the EU. Such a direct trade confrontation would cause considerable damage to the European economy. After all, the US remains the main destination for European exporters and many companies are transatlantically integrated. For the time being, the conflict is limited to pinholes such as tariff increases on steel and aluminium, and threats to increase tariffs on German cars and various food products (French sparkling wine, cheeses, olive oil, etc.). These threats have surfaced as a result of the WTO-ruling regarding EU subsidies to Airbus. Up to now, therefore, it has been mainly psychological warfare in the hope that the EU will make more concessions during the ongoing trade negotiations with the US. But small pinholes can, of course, quickly lead to an escalation.
1.6. Trade balance and bilateral deficits
By introducing several tranches of tariffs on imports coming from China, the US intended to decrease imports from the country and hence reduce its bilateral and total trade deficit. Chinese import commitments included in the Phase 1 trade deal also serve this purpose. However, focusing on bilateral trade balances is not a very effective way to reduce total trade deficits. The IMF (2019) found that focussing on particular bilateral trade balances most likely only leads to
trade diversion and offsetting changes in trade balances with other partners. Hence, there will not be a major change in the total trade balance. After all, the IMF study proves that trade balances are mainly determined by domestic and foreign macroeconomic factors such as gross output and spending. The sectoral composition of aggregate demand and supply also play a role for bilateral trade balances. Trade costs – such as bilateral tariffs – however, have a much more limited impact on trade balances. They may lead to changes in bilateral trade balances, but don’t cause a sustained adjustment of the total trade balance. Hence, though the US bilateral trade deficit with China might decline, bilateral trade deficits with other US trading partners, will likely increase.
Even in the case countries wish to close their trade balance deficits, it might be wiser to boost exports rather than to limit imports. Such an approach has always been the credo of EU trade negotiations, i.e. improving market access for European firms on international markets. This is clearly not the approach the Trump Administration took, despite the fact that US exports in many industrial sectors have weakened over time. Hence, focusing on strengthening industrial activities as well as stimulating new economic activities in general, in particular through market-oriented innovation incentives, could be a worthwhile alternative approach to protectionist measures.
2. Trade protectionism: a changeable constant
2.1. Tariffs: diminished but not gone
Throughout the full history of economic and trade growth, policy choices have been an important driver of globalisation. Periods characterised by spikes in trade protectionism are linked with declining trade growth. Conversely, when trade liberalising measures dominate, international trade can flourish. The most popular trade policy instruments to protect domestic producers against foreign competition are tariffs or import duties. Tariffs create a price advantage for domestically produced goods over similar imported goods. Additionally, they raise government revenues, which are not an insignificant source of income for developing countries.
Already from the end of World War II, mainly developed economies started to lower their trade tariffs in order to liberalise international trade and stimulate growth. In the 1960s, the Republic of Korea and Taiwan began to reduce their import protection. From the mid-1980s other developing countries followed this trend, which led to an increased integration of developing economies in world trade. In 1994, the Uruguay Round agreements signed by 123 countries contained, among other things, commitments to further cut tariffs and to limit their tariff rates to certain levels, so-called bound tariffs. China also sharply reduced its trade tariffs in the run-up to and aftermath of its accession to the WTO (figure 4). Though it started at a much higher average tariff rate than developed countries in the early 1990s, China has significantly lowered its tariff rates, which equalled 3.83% in 2017, over the past 30 years. However, this was still markedly higher than the average EU and US tariff rates of 1.79% and 1.66% respectively. The difference with the Chinese 1992 tariff rate (32.17%) is at least remarkable.
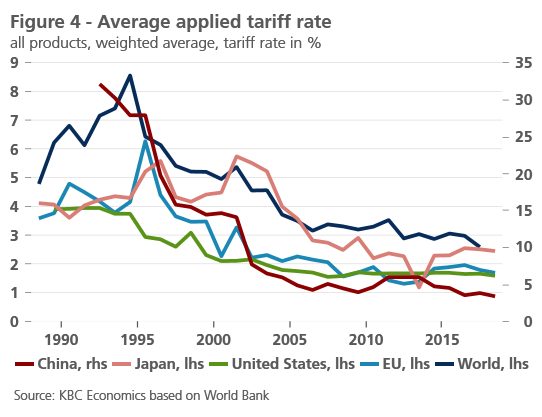
The global average applied tariff rate stood at 3.59% in 2017 and was below 5% for most countries – except for low-income ones. The average tariff rate for all products, however, hides large differences in tariff rates across sectors and products. The WTO tariff profiles show that in the EU and the US, food products – such as dairy, fruit and vegetables – but also beverages, tobacco and clothing are still subject to much higher import tariff rates than the average of all products. Hence, although progress has been made over the past decades, until today mainly protectionist agricultural trade policies with high tariff rates remain an important stumbling block in ongoing trade negotiations. Recent trade disputes – e.g. the US-EU conflict regarding aerospace manufacturers Boeing and Airbus – have also shown that agricultural and food products are often among the first products to be targeted by new or higher tariffs. Therefore, despite the drop in average tariff rates, in some sectors tariffs are still intensively used as a protectionist trade measure.
The dynamics in the global average tariff rate don’t explain why trade growth has been so sluggish since the global financial crisis though. There was a slight uptick in the global average tariff rate in 2010-2011, mainly driven by China, but this was quickly reversed, and the global average tariff rate has been roughly stable since.
2.2. The rise of non-tariff measures
Despite the continued low average tariff levels, other trade policy instruments are being used to affect international trade flows and hence contribute to renewed protectionism. In addition to trade tariffs, there is a whole arsenal of non-tariff measures being used to restrict or even eliminate foreign competition. Sanitary and phytosanitary (SPS) measures are the most commonly used. These measures consist of health and safety standards to which imported food, animal and plant goods have to comply. The measures can take many forms, such as limits on the amounts of pesticide residues or required specific treatments or processing standards. SPS rules lead to trade restrictions, though their general purpose may be justified to ensure food safety etc. However, because of their technical complexity, SPS measures are often abused as a protectionist device. Other popular non-tariff actions are trade defence measures such as countervailing duties, anti-dumping and safeguard measures. They are used to act against perceived unfair trade practices of trading partners. Trade defence policies are perfectly compatible with WTO regulations and are increasingly used by many countries in the world, including emerging markets. Moreover, tariff-rate quotas, export subsidies and quantitative restrictions are additional non-tariff measures that are regularly used.
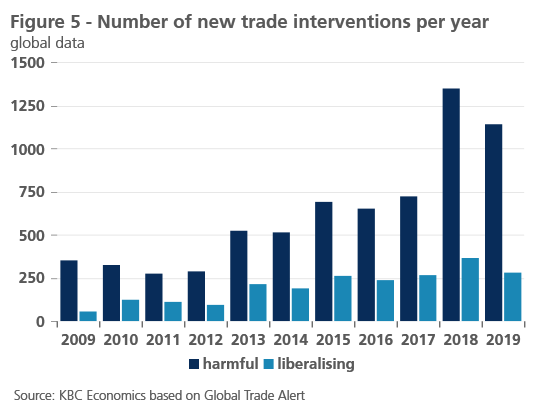
The database of the Global Trade Alert (GTA) contains statistics on the total number of implemented trade interventions per year since the global financial crisis in 2009. They contain both tariff and non-tariff measures. Over the full horizon 2009-2019, tariffs were not the most popular kind of trade hampering measures (only 13.2% of all implemented measures). Hence, also given the fact that global tariff rates didn’t significantly increase over the past decade (see above), the GTA data give a good indication of the dynamics in non-tariff measures.
Figure 5 shows that both trade liberalising and harming measures have risen in popularity over the years. However, the balance between trade restricting and trade liberalising measures has always been in favour of the former. The difference between the two has, moreover, increased. In 2019, 1145 trade harming and 283 trade liberalising actions were reported. There were major differences between countries though. The US, Germany and Japan were the top three countries to introduce the most trade barriers in 2019. The countries which implemented the least trade restrictive measures were Israel, New Zealand and Sri Lanka. China just fell out of the top ten.
Hence, the shift towards a more confrontational and protectionist approach to international trade policy was not – despite their overwhelming presence in the media – confined to the US and China. In its latest report, the Global Trade Alert (GTA, 2019) even speaks of “the Populist” era, defined as the period between the start of 2017 and the end of 2019. More trade protectionism and less trade liberalising measures were implemented across the globe as a consequence of a more critical political tone towards liberal trade. According to GTA data, in the period from 1 January 2017 to 15 November 2019 total newly introduced trade distorting measures worldwide amounted to 2,723 and cumulatively affected 40% of world trade by November 2019. To compare, only 23% of those measures were the responsibility of the US and China.
Despite all the World Trade Organisation’s efforts to lower trade barriers and to foster further declines in average tariff rates across the globe, many countries have never really managed to fully resist the temptation to protect their domestic companies from foreign competition. In a sense, more concealed trade protectionism, mainly in the form of non-tariff measures, was tolerated so that it only increased over the years.
3. From trade war to technology war
The drivers behind the recent rise in trade protectionism are diverse. The most obvious one - as the name ‘trade protectionism’ suggest - is to protect domestic companies from foreign competition. This has been the main driver behind trade hampering policies for decades. The major difference of current trade policy measures compared to the past is that the US and other countries are increasingly using their trade policies for non-trade purposes. Of course, historically, trade and politics have always been closely related. But the openness with which trade policy is currently (ab)used to achieve political goals is unparalleled. One major example of this was the recent clash between the US and Mexico over illegal migrant border crossings.
The problem with such a policy is the high uncertainty it creates for international business. After all, companies make decisions about international investment and trade contracts on the basis of a long-term strategy. Protectionist measures often distort current trade flows, but uncertainty also weighs on future investment (also see below).
One particular feature of the US-China trade war is that it is not trade, but technological and therefore economic leadership in the world that is dominating the American-Chinese tensions. Over the past decades, China has been able to upgrade from the ‘factory of the world’ to a leading player in high-tech sectors with a higher added value. This has been a structural trend in accordance with the official Chinese policy objectives. The global success of Chinese technology companies such as Huawei is often quickly attributed to unfair Chinese practices. The lack of respect for international protection of intellectual property is seen as especially problematic. However, this is only part of the story. China has long left behind the stage of achieving technological progress through imitation and reversed engineering. Structural and substantial investments in research and development have put China on the world’s technological map. Figure 6 shows that research and development spending in China (as a % of GDP) has increased significantly in recent years. China’s research and development
spending even surpassed that of the EU, which, despite many policy intentions, has been barely increasing. Other indicators of innovation also confirm that China is rapidly carrying out its technological upgrading. For example, the number of patents granted to foreign companies in the US show a huge percentage increase in China’s presence in the US technology market.
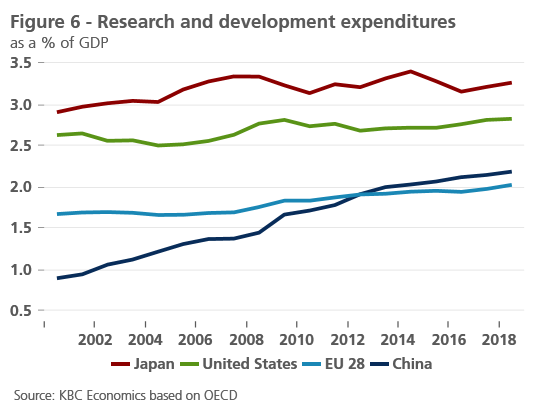
Hence, it is clear that in particular the EU is systematically lagging behind China. Moreover, China is also gradually catching up with the US in terms of R&D spending. The speed by which China is carrying out its technological upgrading is historically unprecedented. Rather than choosing the confrontational approach, the US and other parts of the world have much more to win from international cooperation with China. The intrinsic incentive for lasting innovation that a market economy brings with it, combined with the speed with which a centrally planned economy - such as China - can achieve things, would likely lead to mutual gains. This would, however, require a drastic shift in the general global mindset, which seems unlikely for now.
The impact of increased trade protectionism on economic growth runs via several channels. The first one is the trade channel. Higher import tariffs imply higher trade costs. These may cause a change in the quantity as well as in the quality of goods that are traded internationally. If higher trade costs are not absorbed by producers (through lower profit margins), import prices will rise, thereby increasing production costs of importing firms and foreign consumers. In the end, domestic inflation may even rise, in particular for import-intensive economies. Households’ real disposable income will then be negatively impacted, which will weigh on private consumption, investments and hence, growth. Because global supply chains have become more complex in recent decades, this channel through which protectionism affects economic activity has gained importance. More generally, trade theory shows that trade liberalisation has clear economic advantages ranging from higher efficiency in global production processes to increased choice for consumers. Opening up to international trade may obviously cause economic dynamics with winners and losers, but there is clear theoretical support and empirical evidence that international trade leads to a general increase in welfare, notwithstanding the need for some redistribution of these benefits.
Furthermore, higher trade costs may lead to tighter global financial conditions. Heightened uncertainty about trade policies might trigger an upward shift in risk premia. The magnitude of the impact of trade protectionism on economic growth depends on how many countries are involved, whether trading partners impose retaliation measures and whether imported goods that are subject to tariffs can be substituted by goods from elsewhere or by domestically produced goods.
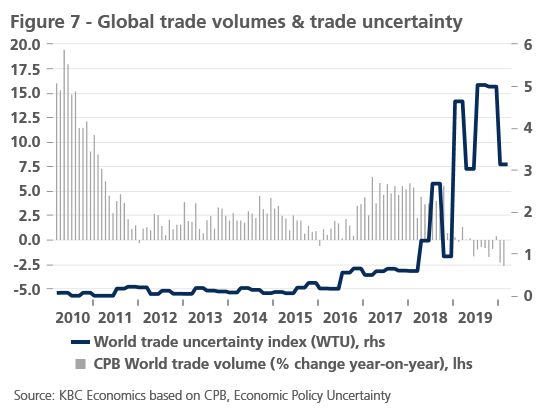
The trade war between the US and China, and in particular the unpredictability of its trajectory, has caused a sharp spark in global uncertainty. Figure 7 shows the World Trade Uncertainty (WTU) index, which is a metric of prevailing global uncertainty, linked specifically to trade. The index is based on the number of times the word ‘uncertainty’ is mentioned in the Economist Intelligence Unit Country Reports in proximity to a word related to trade. The figure indicates that trade uncertainty in the past two years has risen sharply, mainly due to the US-China trade war escalation, after having been stable at low levels for about 20 years. These elevated levels of uncertainty go hand in hand with downward pressures on confidence, both for companies as well as for consumers. Of course, not only trade (policy) developments play a role here, as the downturn in global corporate sentiment was also influenced by the widespread weakness in manufacturing industries, for instance due to technological and ecological transitions. Nevertheless, the escalation of the trade conflict between the US and China and the threat of new confrontations with other US trading partners weighed heavily on business optimism throughout 2018 and 2019 and undoubtedly contributed to procrastination of investment decisions. For example, this was reflected in the rather weak contribution of corporate investment to US real GDP growth in 2019. Besides, figure 7 also illustrates the negative impact of trade protectionism escalation on monthly global trade volumes.
The exact damage to both the global economy and to individual economies from the recent flare-up of protectionist pressures is hard to determine. There are, however, several estimates available. Tax Foundation, an independent US organisation specialised in tax policy research and analysis, developed a model to estimate what the impact is of the US administration’s imposition of tariffs and corresponding retaliatory actions by trading partner on the US economy . According to these calculations the trade disputes led to a reduction of wages by 0.35%, a loss of 394,300 full-time equivalent jobs and a decline of long-run US GDP by 0.51%. The only bright side is the increased US revenue from the imposed tariffs (estimated at $161.67bn). Hence, although the exact figures are subject to uncertainty, the overall impact of the protectionist measures on the US economy has likely been negative and probably not limited to the short-term. Accordingly, the impact on other economies and for the global economy as a whole is also most likely unfavourable.
5. Globalisation in the post-corona era
At the end of 2019, the outlook for global trade conditions began to improve again as the threat of a further escalation of the US-China trade war was waning. Moreover, both sentiment and performance in the industrial sector showed some early recovery signs. On the back of a normalization in international trade, global economic growth was expected to rebound from its temporary, but globally synchronized slowdown in 2019. Unfortunately, the outbreak of the Covid-19 pandemic has had dramatic economic consequences. The expected drop in global economic growth is unprecedented in the post-World War II period. Hence the Covid-19 pandemic, and the related government measures to contain the spread of the virus, abruptly changed the economic outlook. International trade is expected to develop even more negatively during the corona crisis. The WTO projects that global trade will fall steeply in every region of the world and across all sectors of the economy. The expected drop in global trade ranges from 13% to 32% in various WTO scenarios (April 2020 WT0 forecasts), which is substantially more than the expected global economic growth decline. Therefore, similar to the global financial crisis period, trade will be very much affected by the corona crisis.
The Covid-19 pandemic is affecting international trade in multiple ways. First, the lockdown and quarantine measures implemented in many countries has triggered a sudden drop in global final demand. Part of this demand is expected to recover after the lockdown periods, as we currently see happening in China, where some Covid-19 related restrictions have already been lifted. However, the recovery in final demand will be incomplete, in particular for particular services (e.g. restaurant visits, tourism).
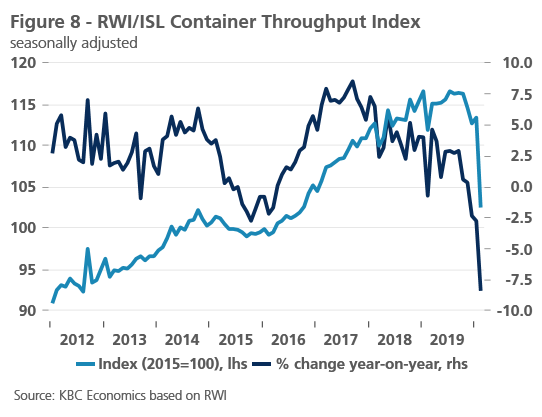
Second, the demand for commodities and intermediate products dropped too. As the Covid-19 virus is affecting the entire world, the global demand for resources in production processes dropped substantially. Third, due to far-reaching restrictions on international travel, the international provision of various services have become impossible, in particular when they require a physical presence of people in foreign countries. Fourth and more in general, disruptions in transportation linkages simply make it harder or even impossible to transport products around the world. Figure 8 shows the Container Throughput Index that measures the container throughput in 81 ports handling 60% of world container throughput and hence gives a good indication of the international trade environment. The first months of 2020 show a clear fall in container throughput which can be attributed mainly to the Covid-19 outbreak in China and later in the rest of the world.
Hence the corona crisis causes a complex supply and demand shock to global trade flows. These disruptions to international trade feed into many other economic activities. As such, trade adds to the economic damage caused by the Covid-19 pandemic.
A substantial part of the shock is expected to be temporary, similar to the temporary nature of the virus outbreak. However, it is likely that the corona crisis will have some long-lasting implications for international trade. As such, the Covid-19 pandemic may cause a new wave of deglobalization that is likely to last for a longer period.
First, during the corona crisis we have already witnessed a dramatic rise in economic nationalism. Countries have imposed restrictions on exports of essential products ranging from particular food products (e.g. restrictions on rice exports in a number of Asian countries) to medical equipment necessary in the fights against the virus. Despite clear calls by the WTO to maintain open trade in vital medical supplies, in practise we see clear restrictions being imposed, even between well-integrated countries like EU member states. One can expect that countries will learn from this negative experience. The call for more domestic production facilities for essential products will be loud and clear. This may weigh on current international trade activities, even if it implies that efficiency gains are lost.
The corona crisis might, moreover, negatively affect the public opinion about international trade and change people’s perceptions on foreign countries. For example, a survey from Pew Research Center shows that the share of Americans having an unfavourable opinion of China has been rising since the outbreak of the virus. The upward trend had already been visible before, but the pandemic likely added to it. In general, this might be an additional tailwind for populist politicians who are against globalisation and argue for (economic) nationalism.
More generally, during the corona crisis companies have been confronted with disruptions in global value chains. The current widespread disruptions of supply chains cause shortages of supplies and bring production to a standstill. This vulnerability of international production chains could stimulate companies to relocate production towards closer regions. They may opt for alternative supply chains in the future, possibly within national borders or at best within the same region. It is likely that regionalization will dominate globalization. Regionalization is obviously a better alternative than economic nationalism, but compared to globalization, it will only be a second-best solution and will lead to macroeconomic welfare losses.
Nevertheless, this regionalisation trend doesn’t necessarily contradict with globalisation. On the contrary, by promoting competition within a region, regionalisation even supports microeconomic forces that underpin globalisation. In that sense, it may lay the foundation for a renewed upward phase in the globalisation cycle going forward. Despite the trends over the last few years, all hope is hence not lost for the international trade environment in the longer term. Given the current economic difficulties, however, the short-term outlook for international trade is far more challenging.
References:
Constantinescu C., Mattoo A., Ruta M. (2015) The Global Trade Slowdown: Cyclical or Structural?, IMF Working Paper WP/15/6
Global Trade Alert (2019) 25th Global Trade Alert Report - Going It Alone? Trade Policy After Three Years of Populism
International Monetary Fund (2016) World Economic Outlook: Subdued Demand: Symptoms and Remedies, October
International Monetary Fund (2019) World Economic Outlook Chapter 4: The drivers of bilateral trade and the spillovers from tariffs, April
Obstfeld M. (2020) Globalization Cycles, CEPR Discussion Paper DP14378
Office of the United States Trade Representative (2018) Update concerning China’s acts, policies and practices related to technology transfer, intellectual property and innovation