

On the employment intensity of economic growth in Belgium

Read the publication or click here to open PDF.

The degree to which economic growth is converted into jobs - the so-called employment intensity of growth - is a labour market indicator that is less frequently discussed in the literature than classic measures, such as the unemployment rate or the employment rate. This is partly because the indicator is more difficult to measure, and its interpretation is also more complex. In this research report, we quantify the employment intensity of economic growth in Belgium and its three regions (Flanders, Wallonia and Brussels) for the years 1960-2023. Throughout this period, it increased systematically. We provide explanations for this increased employment intensity, which was one of the reasons for the relatively favourable development of employment in Belgium in more recent years. More fundamentally, we also examine whether or not the more employment-intensive growth is a good sign for the economy.
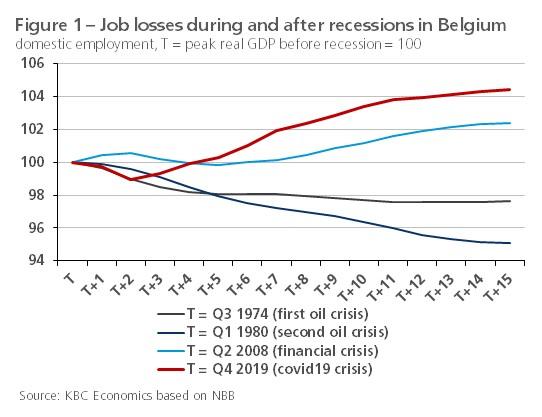
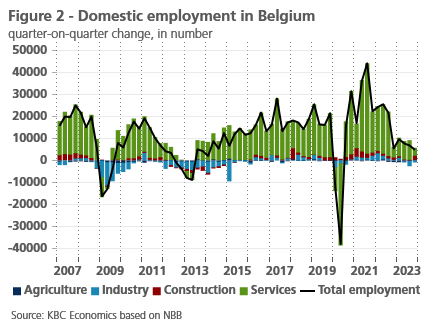
The Belgian labour market held up surprisingly well in recent years amid two crises that followed each other in rapid succession. Job losses remained very limited during the corona pandemic and domestic employment rebounded quickly and strongly compared to previous severe economic recessions (Figure 1). In 2023, job creation weakened in the wake of the energy crisis but remained positive (Figure 2). From a euro area perspective, the Belgian labour market was also relatively resilient. At the end of 2023, total domestic employment in Belgium was 4.5% higher than at the end of 2019, compared with 3.8% in the euro area.
In this research report, we take a closer look at the job creation capacity of the Belgian economy. We not only focus on the recent past, but also place the latest developments in a broader historical perspective. How much extra employment an economy creates (or what it manages to retain during an economic downturn) is related to a multitude of factors, including structural characteristics regarding the functioning of the labour market and measures that are part of labour market policy (think of the extension of the system of temporary unemployment during the pandemic). Yet, first and foremost, the volume growth of economic activity plays a role. Indeed, in most cases, an increase in the production of goods and services also requires an additional use of labour to achieve the additional output.
The extent to which economic growth (in terms of real GDP or value added) is converted into employment growth is called the "employment intensity" of economic growth. In section 2 of this report, we quantify this employment intensity for Belgium, as well as the three regions (Flanders, Wallonia and Brussels), over the past half-century-plus (1960-2023). Two different methods are used. In Section 3, we then offer explanations as to why the employment intensity of growth has changed over time. We also make some reflections on the magnitude of employment intensity and answer the question of whether or not a high value is a good sign of a healthy economy.
2. Quantifying employment intensity
Classic approach
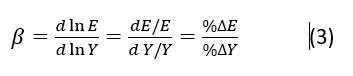
In practice, we can measure the employment intensity of growth (employment intensity for short) as the employment growth, in percentage points over a given period, generated by one percentage point of economic growth. This is a (point) elasticity β that indicates the extent to which the economy is able to convert economic growth into jobs. For example: if one percentage point of additional economic growth results in 0.3 percentage points of additional employment, then the employment intensity of economic growth is 0.3. Specifically, this involves the following formula:

where %ΔEi = the percentage change in domestic employment and %ΔYi = the percentage change in economic activity (real GDP) in year i versus year i-1.
This definition of employment intensity is simple but comes with practical problems that complicate its interpretation. First, the measure for a given year may take on a negative value for several reasons. For example, the labour market often responds to economic developments with a lag, so jobs may still be lost during a recovery from a recession. But equally, a negative value may indicate that during a recession (negative GDP growth), no jobs are lost (yet). It is also possible that although the elasticity is positive, it reflects a situation where jobs were lost (negative employment growth) during a recession (negative GDP growth). Finally, if real GDP growth is (virtually) zero, the elasticity will trend toward infinity.
Figure 3 shows employment intensity in Belgium for each year in the period 1960-2023 calculated according to formula (1). Although we have to be careful with the interpretation, it seems that employment intensity has increased in the more recent years. If we omit values from the exceptional crisis years 2008 and 2020, employment intensity averaged 0.52 in 2011-2023, compared to 0.39 in 2001-2010. Excluding the exceptional pandemic year 2020, it averaged as high as 0.71 in 2016-2023. The higher employment intensity in more recent years is even better reflected when we consider employment growth not in terms of number of people employed but in terms of number of hours worked (Figure 4). It is also noteworthy that the value of employment intensity over the entire period in the figures was almost always (well) below 1, due to the progressive growth of labour productivity (see later in this report for the relationship between the concepts of employment intensity and labour productivity).
Econometric approach
Given the difficulties of interpretation with the classic quantification, employment intensity in the economic literature is often also approximated by means of an econometric regression:1
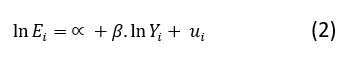
where both variables Ei en Yi are expressed as natural logarithms and β again represents the elasticity of employment with respect to economic activity.
A disadvantage of this alternative approach is that one elasticity is estimated for the entire period for which observations are available.2 In practice, however, structural changes may occur that cause the elasticity to change over time. We can overcome this by including in equation (2) binary variables Dij (so-called 'dummy variables') that split the observations into several subperiods. These then take the value 1 for the years within a given subperiod and 0 in all other years. In equation (4) we consider four subperiods as an example (in the regression we will effectively estimate, there are also four, see below):

The number of binary variables included in equation (4) (three) is equal to the number of subperiods considered (four) minus one, thus avoiding perfect multicollinearity. The introduction of binary variables in the equation allows us to estimate an elasticity (reflecting employment intensity) per subperiod. That relating to the first subperiod is then equal to β1, that relating to the second subperiod β1 + β2, that relating to the third subperiod β1 + β3 and that relating to the fourth subperiod β1 + β4. In the equation, the binary variables Dij also affect α. In this way, not only the employment intensity varies for each subperiod but also the constant term.
We have a long time series (1960-2023) to estimate equation (4), not only for Belgium but also for Flanders, Wallonia and Brussels (for the regions, the time series goes only up to 2022). The best results are obtained by dividing the observations into the following four periods: 1960-1980, 1981-2000, 2001-2010 and 2011-2023. For the last subperiod, we omit the year 2020 from the observations due to the exceptional situation of the pandemic, which was accompanied by an unprecedented application of the temporary unemployment system.
Table 1 shows the estimated elasticities (employment intensity) for the four periods considered, as well as the corresponding t-values (significance) for the β-coefficients. The coefficients are significantly different from zero in the regression concerning Belgium as a whole as well as those concerning Flanders and Wallonia (for Wallonia this is not the case for the coefficient for the first period). For Brussels, on the other hand, only the coefficient for the last period is clearly significant. This is possibly due to the relatively strong government employment in the Capital Region, which is less growth-related.
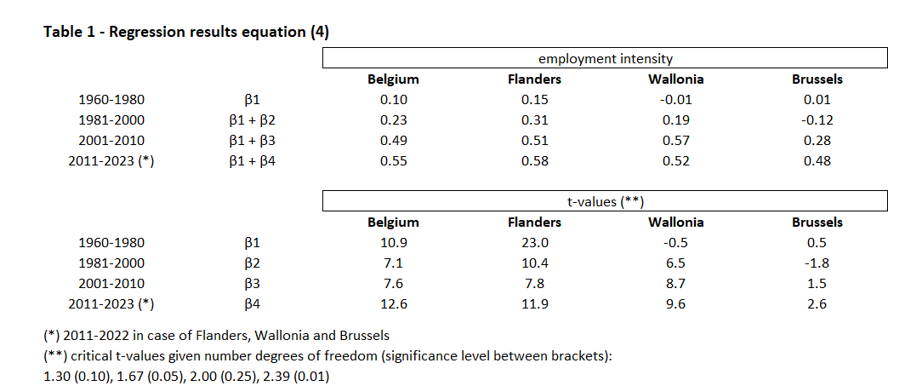
The regression concerning Belgium shows that the employment intensity of growth increased from 0.10 (first period 1960-1980) to 0.55 (last period 2011-2023) over the period considered. The results confirm the previous conclusion based on the classic approach in formula (1). Employment intensity also increased over the subperiods in each of the three regions. In Wallonia, however, it decreased slightly on average in the last subperiod compared to the previous one. In terms of level, the employment intensity of growth in 2011-2022 was highest in Flanders at 0.58. Economic growth in this region during the last subperiod was not only higher on average than in Wallonia and Brussels (see also KBC Economic Research Report "Regional Economic Growth in Belgium" of February 13, 2024), but was also proportionally accompanied by stronger employment creation per percentage point.
3. Explanations and reflections
Explaining factors
Defining employment intensity as the ratio of employment growth to economic activity growth, it is "in a sense" the inverse of productivity growth per worker. In a sense, because employment intensity and labour productivity growth are not exactly reciprocal. Labour productivity is the ratio of output (GDP) to the number of people employed. Employment intensity is the ratio of the change in employment to the change in output (GDP). Since the change of a ratio is not equal to the ratio of two changes, employment intensity of economic growth and labour productivity growth are not exactly each other's inverse.3 Nevertheless, labour productivity growth is a good mirror image of employment intensity.
The slowdown in productivity growth has received much attention in recent years, so it should come as no surprise that employment intensity has increased. The more recent trend follows from a multitude of factors. One prominent explanatory factor is the continued tertiarization of the economy, with jobs shifting from manufacturing to services, where employment intensity is higher and labour productivity is lower.4 Figure 2 shows that also in recent years job creation has mainly taken place in the service sectors.5 Another factor is the measures taken in the years before the pandemic to improve the competitiveness of Belgian companies, including an adjustment to the 1996 wage norm law, an index jump (i.e., the automatic indexation of wages was skipped one-time) and a reduction in social security contributions paid by employers. Wage cost control was accompanied by stricter activation policies and (albeit limited) labour market flexibility measures (including better night work arrangements). The jobs that have been created in the private sector in recent years have come about partly thanks to these interventions.
Another explanation for the increased employment intensity is the phenomenon of labour hoarding. In the current context of labour shortages and downward demographic pressure on potential labour supply, employers are less inclined to lay off employees when the economy is not doing well. Indeed, finding and rehiring suitable staff is a time-consuming activity that does not always yield (the desired) results. By hoarding labour, companies do not want to compromise future production potential. Often labour hoarding applies to higher-skilled and bottleneck occupations, especially when expertise and experience has been built up within the company itself. Prevailing societal challenges (e.g., ageing population) and the rapidly changing environment (e.g., digitalisation, greening) are also creating additional demand for specific labour (in care, construction, etc.), which has also helped fuel employment intensity.
Positive or not?
That economic growth becomes more labour-intensive, and thus leads to greater employment when growth is positive, can in itself be positive, especially if full employment does not yet prevail and to the extent that it does not weigh heavily on firms'profits. There is full employment only when all citizens who offer their labour actually find a job. Or, looked at more broadly, when the potential labour pool (the citizens of working age) is put to maximum use in the labour market. After all, in an inclusive society, this is socially desirable, given the many positive aspects associated with having a job. Overall, maximizing employment among the population reduces income inequality and increases social inclusion, and helps meet future social and economic challenges (including ageing costs). For an unemployed person, more specifically, there is not only the loss of income, but there are often psychological and other consequences associated with being unemployed (e.g., loss of self-confidence and skills).
In Belgium as a whole, it is not so much unemployment but rather broader inactivity that is still very high. Belgium's unemployment rate, while low today at 5.7% by the end of 2023 (according to the harmonised Eurostat definition), is higher than the bottom of 4.9% reached in April 2020 and well above the rate in neighbouring Netherlands (3.5%) and Germany (3.0%). The participation rate (those active in the labour market as a percentage of 20-64-year-olds) in Belgium in the third quarter of 2023 was the fourth lowest in the EU27 at only 76.1% (versus 86.1% in the Netherlands and 83.8% in Germany). In Wallonia and Brussels, it was even lower at only 71.5% and 75.4%, compared to 78.8% in Flanders. Viewed from the perspective of this low participation in the labour market, the higher employment intensity of growth during recent years was certainly not a bad thing.
However, high employment intensity is by no means a sign of a healthy economy when it takes place in an environment of low GDP growth and reflects low productivity growth. Despite high employment intensity, few new jobs are then created in absolute numbers, which also means that employment targets - in Belgium this is an 80% employment rate - will not be met. Moreover, given low productivity growth, those additional jobs create little added value. Within Belgium, Wallonia and especially Brussels are in this "wrong camp": although the employment intensity of growth there has not been that much lower than in Flanders in recent years (see Table 1), it has been accompanied by lower average GDP growth and productivity growth (the latter being absent even in Brussels recently) (see also KBC Economic Research Report "Regional Economic Growth in Belgium" of February 13, 2024). The still relatively high employment intensity in both regions compared to Flanders thus by no means reflects a healthy situation.
Strengthening growth more generally
It is first and foremost of importance - not only for Wallonia and Brussels, but also for Flanders - to boost economic growth itself in a more sustainable way. First, given the still high levels of inactivity and remaining unemployment, this growth must be as inclusive as possible and preferably translate into further employment growth in order to further increase the employment rate. This requires additional reform measures that reduce the remaining (functional and regional) mismatch in the labour market. There is also a need for a more flexible labour market so that companies can effectively seize the opportunities of a rapidly changing economy (think of digitalisation and greening). Furthermore, cost competitiveness must be safeguarded for companies to avoid that in certain (industrial) sectors the further growth of activity would be based on "perverse" (i.e., labour-saving) productivity gains.
In addition, of course, it also remains important that the further use of labour is "qualitative" and that economic growth is co-supported by innovation. After all, additional jobs that create more added value, together with innovations, ensure that “healthy” productivity growth is also boosted. Investing in good education, retraining and lifelong learning must ensure that the rapidly evolving demand for skilled labour is met. In many segments of the labour market - not just the high-skilled - there are serious shortages today, and companies are struggling to fill vacancies. An ageing population, which is also putting pressure on the working-age population, will further exacerbate this tightness.
This again emphasises the need to increase the participation rate in the population. However, while necessary, this will not completely solve the structural shortage problem. Therefore, for many sectors, more productivity-enhancing investments are needed, if they are to continue to grow. Further automation of production processes, but also new technologies (think of Artificial Intelligence) can take over labour where necessary. The higher economic growth that must be sought will therefore, in addition to making the best possible use of the potential labour reserve, also have to be accompanied by stronger productivity growth. On balance, economic growth is then likely to become less employment-intensive in the coming period, reversing the past trend.
1 See e.g. Kapsos, S. (2005), “The employment intensity of growth: Trends and macroeconomic determinants”, ILO Employment Strategy Paper no. 12, en Seyfried, W. (2008), “A cross-country analysis of the employment intensity of economic growth”, Southwest Business and Economics Journal, p. 51-61.
2 Moreover, this is a simple regression equation that does not include possible other determinants of employment growth that are independent of economic growth (e.g., increased public employment).
3 More precisely, the mathematical relationship between the two is as follows:

4 In 2022, labour productivity (value added per worker) in manufacturing (including construction) was 38% higher than in service sectors (private and public).
5 Looking a little further back in time, tertiarisation was also fuelled by targeted measures including the introduction of service vouchers at the start of the 2000s.