
Regional economic growth in Belgium

- Introduction
- Regional growth before 2023
- Regional business cycle in 2023
- Estimate of regional growth in 2023
Read the publication or click here to open the PDF.
Abstract
Belgium's regional growth differentials narrowed between 2000 and 2008, but the post-war systematic growth lead of Flanders versus Wallonia and Brussels re-emerged after 2008. Between 2008 and 2022, the period from the financial crisis to post pandemic, real gross regional product grew at an average annual rate of 1.7% in Flanders, compared to 1.2% and 0.6% per year in Wallonia and Brussels, respectively. Even in 2022, which is the latest year with available figures published by the National Accounts Institute (NAI), Brussels grew significantly slower (at 1.5%) than Flanders (3.4%) and Wallonia (3.3%). For 2023, we still lack hard figures on the extent to which growth (which was at 1.5% for Belgium as a whole) differed between the three regions. In this research report, we try to shed some light on this, after first briefly explaining the relative regional growth trends in the years before 2023. To estimate the regions' relative growth in 2023 (both qualitatively and quantitatively through an econometric exercise), we rely on regional business cycle and labour market indicators, which are available for 2023. Although the conclusion is very tentative, the analysis suggests to us that economic growth in 2023 was again higher in Flanders than in Wallonia and Brussels. On the other hand, it seems that Brussels’ growth (unlike in 2022) held up relatively better in 2023. For final results, we will have to wait until early 2025, when the NAI will publish 2023 regional growth figures.
At the end of January, the National Accounts Institute (NAI) published new figures on the Regional Accounts in Belgium. These give a picture of how the three Belgian regions - Flanders, Wallonia and Brussels - performed in recent years in terms of economic growth, or the growth of their 'real gross regional product'.1These regional growth figures are only available on an annual basis (so no quarterly figures) and lag far behind the publication of the national GDP figures. For Belgium as a whole, we now know that - at least if the preliminary flash estimate for fourth-quarter growth is confirmed - real GDP grew by 1.5% in 2023. For the three regions, the historical figures (including the update just published) extend only to 2022 and, for the time being, it is not clear to what extent regional economic activity diverged in 2023.
Based on the already known national growth rate and regionally available business and labour market indicators for 2023, we can try to make an estimate of regional growth last year. In section 2 of this report, we first highlight the historical relative growth trajectory of Flanders, Wallonia and Brussels in the years prior to 2023 in order to put our estimated regional performance in 2023 in a somewhat broader perspective. The NAI makes available regional growth rates for the period 2003-2022 according to the ESA 2010 standard (European System of Accounts). As has been the case with previous publications of the data, the latest publication by the NAI also saw the historical growth rates partially revised, this time more specifically for the years 2019-2021. The older growth rates before 2003, which we will show in the figures in section 2 and which are based on previous accounts systems, come from KBC Economics' database. In section 3 of the report, we discuss the evolution of available regional business and labour market indicators in 2023. That analysis allows us in section 4 to make a first rough (qualitative and quantitative) estimate of how strong growth has been in the three regions in 2023.
2. Regional growth before 2023
Flanders retains growth lead...
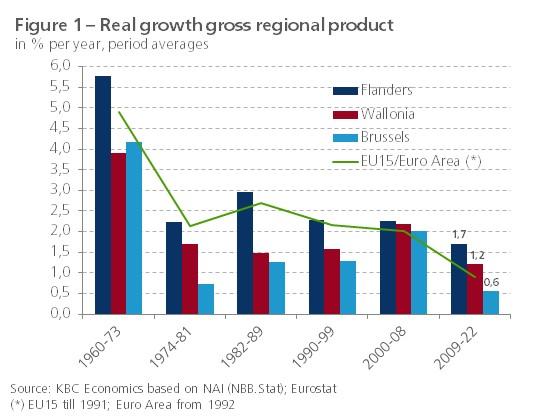
In the period between the financial crisis and the post-pandemic recovery (2009-2022), gross regional product in Flanders, Wallonia and Brussels grew in real terms at an average annual rate of 1.7%, 1.2% and 0.6%, respectively (figure 1). After Belgium's regional growth differentials had become rather small in 2000-2008, the systematic growth lead that Flanders recorded before 2000 compared to the other two regions reappeared. That the regional growth differences deepened again over the last decade is also illustrated in a slightly different way in figure 2, which shows the annual growth differences of Wallonia and Brussels respectively with Flanders, calculated as the 10-year moving average to remove the volatility in the data series. Especially striking is the increasing growth differential between Brussels and Flanders in the more recent period.

Much of the average growth difference between Flanders and Wallonia in 2009-2022 can be explained by different dynamics of economic activity during the European sovereign debt crisis in 2012-2013. Flanders then continued to grow (to a limited extent) while the Walloon economy virtually stagnated (Figure 3). The Brussels economy also continued to traipse on the spot during the European debt crisis and, moreover, had less firmly climbed out of the trough of the Great Recession in 2009. Most striking regarding Brussels, however, is its much lower average growth than Flanders and Wallonia during the period of economic recovery between 2014 and 2019. Part of the explanation lies in the terrorist attacks of 22 March 2016 at Zaventem airport and in the Brussels metro. These hit the hospitality, retail and leisure sectors hard at the time, resulting in negative growth in the Brussels economy that year.

More recently, the pandemic caused economic activity in Flanders (-4.5%) to contract less in 2020 than in Wallonia and Brussels (-5.5% and -5.1%, respectively). The recovery in 2021 was also much stronger in Flanders (7.9%) than in Wallonia and Brussels (4.4% and 4.3%, respectively). Consequently, in 2021, activity in Flanders had already recovered well above its pre-pandemic level, while it was still lower in the two other regions that year. Even in 2022 (the latest regional growth rate available), Brussels in particular (at 1.5%) continued to grow more slowly than Flanders (3.4%). Walloon growth (3.3%) was only slightly below Flemish growth. Viewed over the entire period 2009-2022, however, not only Flanders but also Wallonia performed significantly better than the euro area. The cumulative growth in economic activity over those years was 26.0% in Flanders and 18.0% in Wallonia, compared to 12.7% in the euro zone and only 7.8% in Brussels.
...through higher employment and productivity growth
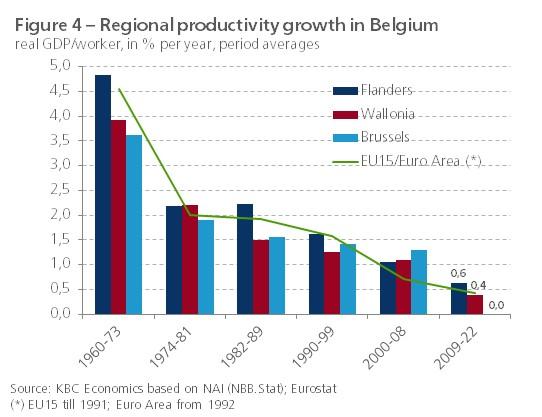
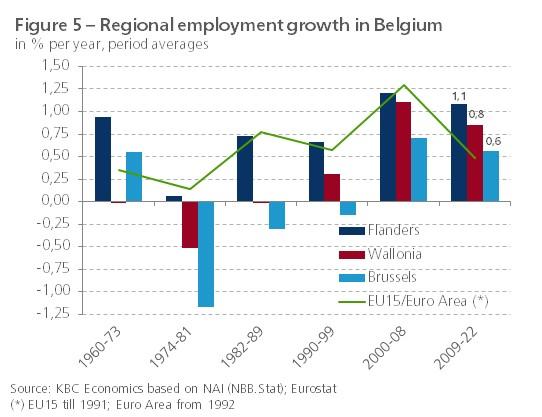
Simply put, economic growth is the sum of employment growth and labour productivity growth. The fact that Brussels grew significantly less than Flanders and Wallonia after 2008 is primarily due to the stagnation of productivity growth in the capital region (0.0% per year on average). In Flanders and Wallonia, it also fell sharply compared to the years 2000-2008, but at 0.6% and 0.4% per year on average in 2009-2022, it remained higher than and equal to that in the euro area (0.4%) (figure 4). Not only productivity growth but also employment growth lagged behind in Brussels over the period 2009-2022 (0.6% per year on average). Once again, Flanders (1.1% per year) also scored better than Wallonia (0.8% per year) in this respect (figure 5). The fact that all Belgian regions, including Brussels, scored better than the euro area (0.5%) in terms of employment growth illustrates that economic growth has been quite labour-intensive throughout Belgium over the past decade.
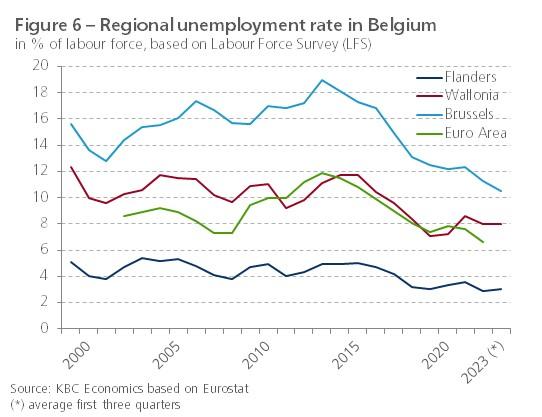
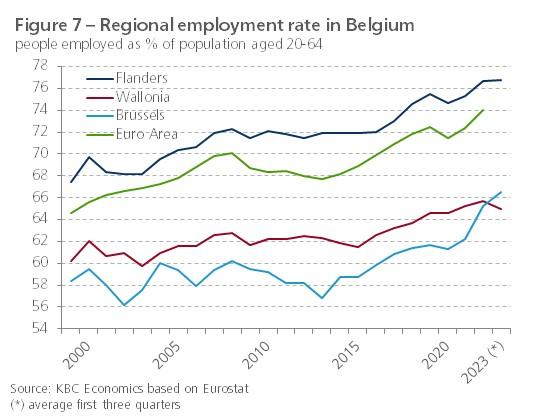
The lower average employment growth in Brussels in 2009-2022 compared to the other two regions also translated into relatively worse dynamics of the unemployment rate (the share of unemployed within the labour force) and employment rate (the share of employed within the working-age population) in that region until 2013 (figures 6 and 7). During the 2008-2013 financial crisis, both rates deteriorated more there. Remarkably, the labour market situation in Brussels did improve significantly since then, allowing the gap with Flanders and Wallonia to narrow. In terms of the employment rate, Brussels even beat Wallonia in 2023. Against the background of the continuing relatively weak economic growth, more specifically also employment growth, in Brussels, this indicates that recently more and more Brussels residents have found a job outside their own regional border. Figure 8 shows that an increasing proportion of Brussels residents commute to Flanders. It is also noticeable that, conversely, commuting from Flanders and Wallonia to Brussels has reversed its declining trend since 2000.

3. Regional business cycle in 2023
The Belgian economy as a whole showed considerable resilience in 2023, having absorbed the energy crisis a year earlier quite well. Quarterly growth rebounded at the start of the year and remained relatively strong throughout the year, especially when compared to the euro zone. On balance, decent annual growth of 1.5% was recorded in 2023.2 This was due to both private consumption, supported by automatic wage indexation and a robust labour market, and business investment, while net exports weighed on growth. Business confidence did fall over the course of the year due to weakening international trade, high financing costs and high uncertainty, but rebounded somewhat toward the year end. Industry in particular struggled with an increasing demand deficit in 2023, and more specifically weak export orders. In construction, companies faced a considerable cooling in the housing market. Higher interest rates inhibited household housing investment.
As regional growth figures for 2023 are not yet available, we do not yet have a clear view of how the three regions will have performed in relative terms in that year. In order to sketch out a picture of this, we make use of various economic and labour market indicators for which 2023 figures have already been published, even on a monthly or quarterly basis. We discuss the regional figures for consumer and producer sentiment, the labour market, and industrial and construction activity.
Regional confidence indicators
Consumer and producer confidence are classic business cycle indicators that are also available for Flanders, Wallonia and Brussels on a monthly basis. Because there are important, long-term level differences between the raw time series of the three regions, we rescaled both indicators for each region as standard deviations from the long-term average. Figure 9 shows that consumer confidence in Flanders not only climbed faster out of the pandemic trough in 2020-2021, but also continued to record higher levels than that in Wallonia and Brussels during the downturn in 2022 following Russia's invasion of Ukraine. More recently, moreover, the indicator has recovered faster and more sharply in Flanders than in the other two regions. As a result, in Flanders it climbed back above its long-term average as early as January 2023, and remained above it throughout 2023. In the other two regions, consumer confidence only reached its long-term average towards the end of 2023.

The relative evolution of producer confidence in recent years did not mirror that of consumers (figure 10). This time, Brussels businesses' confidence in particular lagged during the recovery from the pandemic trough. From autumn 2021 and into 2022, producer confidence in Brussels was relatively volatile. The confidence of Flemish and Walloon companies climbed out of the pandemic trough fairly evenly, but from mid-2021, producer confidence in Wallonia did remain above that in Flanders during the downturn. This was also the case more recently, after bottoming out at the end of 2022 and throughout 2023. In Wallonia, the indicator even temporarily rose above its long-term average in spring 2023, but fell back afterwards, as in Flanders. Only late in 2023 was some improvement visible again. In Brussels, producer confidence remained very volatile in 2023. The fact that the confidence of Flemish companies was affected more than that of Walloon companies by the Ukraine and energy crisis and continued to be affected by it for longer may have to do with the fact that Flanders has a more open and energy-intensive economy than Wallonia.
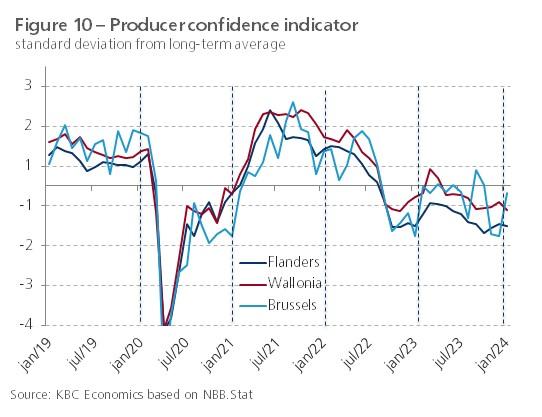
In summary, the confidence indicators suggest, on the one hand, that consumption demand in Flanders has held up relatively better in 2023 than in Wallonia and Brussels. This may indicate that consumption-driven GDP growth in Belgium in 2023 was mainly driven by Flemish consumers. On the other hand, along the business side, Wallonia and Brussels appear to have performed relatively better in 2023. Flemish companies were possibly more affected by weak exports. In turn, these were related to the generally weak growth dynamics in Europe, and neighbouring countries in particular, as well as to the deterioration in competitiveness due to the rapid wage growth that took shape via automatic indexation.
Regional labour markets
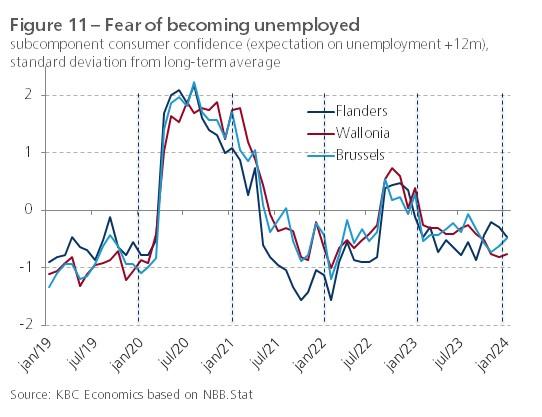
More specifically, the relatively better consumer confidence in Flanders is also reflected in the subcomponent that gauges consumers' expectations of unemployment over the next 12 months (figure 11). That component indicates for all three regions a sharply reduced fear of citizens becoming unemployed since the end of 2020. But it worsened again after Russia's invasion of Ukraine in February 2022, before ebbing somewhat in 2023. In Flanders, with the exception of the temporary jump, the indicator was below that in Wallonia and Brussels throughout almost that entire period. What is striking is that very recently, towards the end of 2023, the indicator in Flanders rebounded, while in the two other regions it dipped below that in Flanders. The indicator on fear of unemployment is an important element in estimating the propensity of households to save and therefore the evolution of private consumption. On average, this propensity to save has been relatively lower in Flanders in 2023.
We can check the evolution of effective unemployment in the three regions on the basis of the dynamics of the number of non-working job seekers registered with the regional employment agencies (VDAB, Forem and Actiris). Figure 12 shows the annual change of that group, so that seasonal effects are eliminated. During the pandemic, it peaked slightly higher in Flanders in the spring of 2020 than in Wallonia. In Brussels, that peak fell later and was also much more limited. During the economic recovery in 2021, the number of unemployed job seekers did fall much more sharply in Flanders than in Wallonia and Brussels. In early 2022, the dynamics in all three regions turned negative again in the wake of the Ukraine and energy crisis. In Flanders and Brussels, the year-on-year change in the number of job seekers only turned positive again later in 2022. In Wallonia, it was as early as May of that year. In 2023 in Flanders, there was a remarkably strong climb in the annual change dynamics.
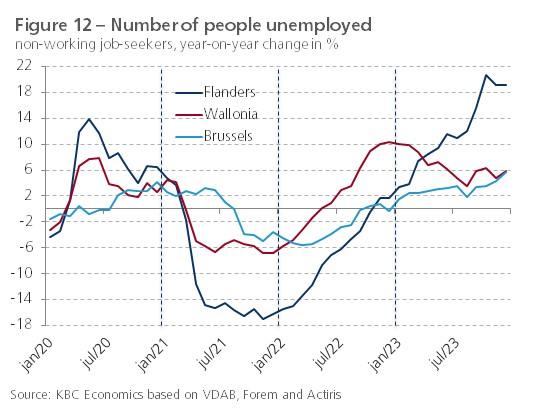
Apart from possibly different cyclical influences, regional differences in the dynamics of the number of unemployed job seekers have been influenced in recent years by changed regulations in registration in the regions. For example, more recently in Flanders, a number of measures were taken that have expanded the VDAB's scope of action, including the compulsory registration as a job-seeker of tenants of social housing (since January 2023). More generally, the recent sharp increase in the Flemish figures can be attributed to the registration as a job-seeker of more and more people who were not previously professionally active. These include people on a living wage (‘leefloon’) or sickness benefit, or those integrating. This distorts the figures so that great care must be taken when using them as a business cycle indicator.
Monthly figures on regional unemployment rates are also available, published by the regional employment agencies and also based on non-seasonally adjusted administrative data (figure 13). The figures for 2023 show that the unemployment rate in each region climbed higher starting in the summer. On average, the unemployment rate in Flanders, Wallonia and Brussels rose by 0.5, 0.9 and 0.4 percentage points to 6.3%, 13.7% and 14.7%, respectively, in 2023. Note again that the administrative figures are distorted by policy measures. Figure 6, which we discussed in the previous section of this report, shows the annual average unemployment rate according to the Labour Force Survey. Using this different definition, the unemployment rate in 2023 in Flanders and Wallonia remained (almost) stable compared to a year earlier (at 3.0% and 8.0% respectively), while in Brussels it recorded a decrease of 0.8 percentage points to 10.8%.

Regional activity in construction and industry
Apart from labour market figures, few hard regional business cycle indicators are available on a frequent basis. Moreover, a drawback is that some, such as regional figures on international trade, are available only in value rather than volume terms. In periods of rising inflation, such as in 2022, it is then difficult to draw conclusions from them regarding the development of real economic activity. Moreover, some hard indicators are distorted by the numerous policy measures taken during the recent crisis years. For example, the number of bankruptcies (which in 2023 increased by 12% and 21% respectively in Flanders and Wallonia and decreased by 5% in Brussels) has been driven in recent years not only by the introduction and withdrawal of "policy cushions" but also by specific measures such as the hunt for fraudulent companies.
GDP growth across Belgium in 2023 was held back by the cooling housing market. Specifically, higher interest rates sharply inhibited housing investment by Belgian households. It is estimated that in real terms, these were on average just under 5% lower in 2023 than in 2022, having already fallen by over 3% in that year as well. To get an idea of the extent to which this correction was different in the regions, we look at regional figures on the number of building permits granted (figure 14). We have to be careful here because usually it is only later after the permit is granted that house construction or renovation actually starts. Because the monthly figures are rather volatile, we also show the 6-month moving average in the figure. Through 2023, the dynamics of the number of permits was quite similar in Flanders and Wallonia. However, in Flanders (-14.4%) the decrease in the average number in 2023, compared to 2022, was greater than in Wallonia (-8.2%). In Brussels, there was a sharp decline during 2022, but permits recovered somewhat through 2023. However, the average number there in 2023 was also 10.8% lower than in 2022. All this suggests that the construction and renovation correction in 2023 was greatest in Flanders.

Figures on industrial production do exist for the regions in volume terms and seasonally adjusted. Figure 15 shows these dynamics for Flanders and Wallonia over the past three years. In Brussels, with its typical service economy, the share of manufacturing is only a good 2% (for Flanders and Wallonia it is about 20%), so the inclusion of that region in the analysis makes little sense. Compared to the service sectors, industry in Belgium rebounded quickly and strongly once the economy reopened after the pandemic. The resilience of industrial activity was mainly reflected in Flemish production figures. In Wallonia, figures remained rather flat after the initial climb out of the pandemic trough. The relatively strong rebound of Flemish industry was related to the recovery of international trade, from which Flanders was able to take full advantage. In Wallonia, the export recovery only took shape later. More specifically, the pharmaceutical industry recorded very good results in 2021. This industry benefited from the huge demand for vaccines, and its production was massively exported. This strong growth in the pharmaceutical industry originated mainly in Flanders at corona vaccine producer Pfizer.
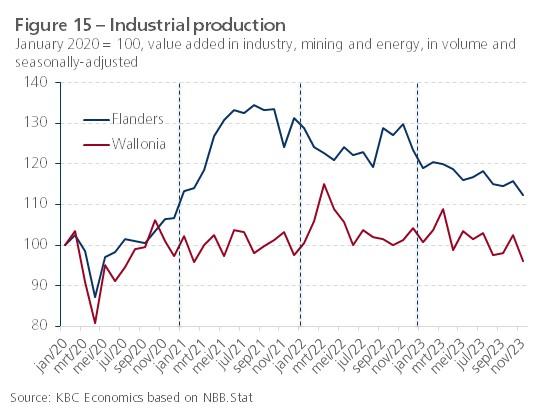
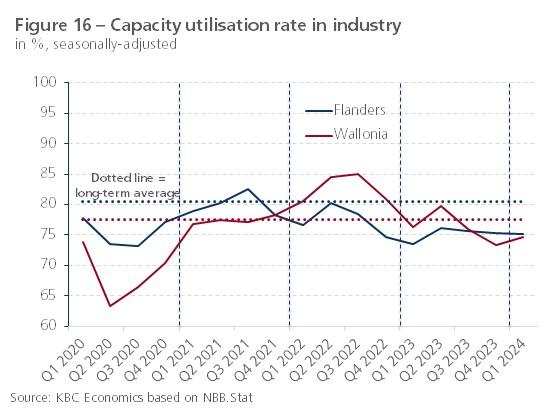
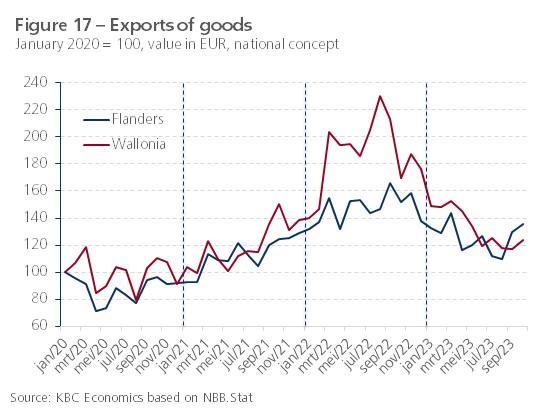
From the summer of 2021, industrial activity was increasingly hampered by bottlenecks in the supply of essential inputs and by personnel shortages. In addition, from the beginning of 2022, there was the Ukraine and energy crisis. Especially in Flanders, this caused a significant industrial downturn, with a temporary recovery towards the end of the year. In Wallonia, there was an exceptional peak in industrial activity in early 2022, attributable to the manufacture of computer and electronic products, followed by a normalisation. Throughout 2023, production gradually fell in both regions. For the full year 2023, it was on average 6.1% and 2.6% lower than in 2022 in Flanders and Wallonia, respectively. The capacity utilisation rate in industry in Wallonia remained above that in Flanders in the first half of the year but then dropped slightly below. Especially in Flanders, this rate remained well below its long-term average (figure 16). Export dynamics declined throughout 2023 in both Flanders and Wallonia, but on average, compared to 2022, the decline in 2023 was stronger in Wallonia (-29%) than in Flanders (-15%) (figure 17). Again, we stress that these are nominal export figures which, especially given the past large fluctuations in inflation, do not necessarily give a good picture of volume trends in international trade.
The somewhat mixed signals regarding year-on-year changes in industrial production and exports in the two regions (precisely: stronger decrease in industrial production in Flanders, on the one hand, and stronger decrease in exports in Wallonia, on the other) make it difficult to draw conclusions regarding the relative extent to which industrial activity has been affected by the deteriorating international environment. Moreover, the share of industry in total added value is about the same for the Flemish and Walloon economies (about 20%). Combined with the relatively less strong confidence of Flemish companies compared to Walloon ones (see figure 10), the industrial figures (which concern volume figures) seem rather to indicate that the Flemish economy has suffered via industry somewhat more than the Walloon one.
4. Estimate of regional growth in 2023
For Belgium as a whole, real GDP growth in 2023 was 1.5%. That this figure was still quite robust, in the wake of the Ukraine and energy crisis, is due to the fact that households maintained their consumption thanks to the support of automatic wage indexation and continued job creation. Also noteworthy was the robust growth in business investment despite waning producer confidence. Exports shrank more than imports, so that net exports weighed negatively on Belgian GDP growth. For the three regions, the historical growth figures only extend to 2022 and it is not clear for now to what extent, and for what reasons, regional economic growth deviated from national real GDP growth in 2023. The numerical information available to estimate regional growth in 2023 that was discussed in section 3 of this report is rather sparse, patchy and surrounded by a lot of technical limitations.
The rather qualitative conclusion from section 3 is, on the one hand, that the more favourable trend in consumer confidence in Flanders compared to Wallonia and Brussels suggests that the strong private consumption growth in 2023 that emerges in the Belgian GDP figure is mainly attributable to Flanders. On the other hand, the more negative producer confidence and somewhat poorer industrial dynamics in Flanders point to a relatively more unfavourable development on the business side in that region. Given these contrary findings, it remains difficult to estimate regional growth differentials for 2023. Moreover, contrary to what might be expected, the indicators considered in section 3 have by no means always shown a good correlation in the past with the ultimately effectively realised growth.
Econometric approach
An alternative, more quantitative approach is to examine econometrically the extent to which the regionally available indicators in the past have been able to properly explain annual growth in the three regions. If so, then we can plug the already available figures from those indicators for 2023 into the mathematical equation to quantify regional 2023 growth as an estimate. One problem with this is that the past regional growth figures are annual figures and thus for the considered indicators (mostly monthly figures) we have to calculate an annual average as well, which makes the number of data observations in the econometric exercise small.
We have the longest time series for regional and Belgian growth rates (1960-2022). A very simple regression consists of explaining for each region its own growth over that period only by Belgian growth. This produces an extremely significant coefficient each time. If we bring the already known 2023 growth for Belgium (1.5%) into the three mathematical equations, we obtain for Flanders, Wallonia and Brussels an economic growth of respectively 1.9%, 1.2% and 1.0% in 2023. These are figures consistent with the 1.5% growth rate for Belgium as a whole. In that exercise, past growth ratios (with Flanders showing a clear growth lead) are simply carried forward to 2023. Such an approach is short-sighted and does not take into account other available regional indicators for 2023.
Including additional regional business cycle indicators in the regression equation creates not only a problem of short(er) time series (fewer observations) but also a problem of multicollinearity. Since the (annualised) regional indicators are mostly (highly) correlated with the Belgian GDP growth series, including them together in the mathematical equation would make the regression results less accurate. If we do so anyway, the different regional indicators do not appear to provide a significant additional explanation (no significant t-value, also no significant increase in R²). When we omit Belgian GDP growth from the equation, the producer confidence indicator and export growth do offer a significant explanation for regional growth. For both of these, we still have a fairly long time series available (namely 1985-2022, but only for Flanders and Wallonia, not for Brussels; we capture the exceptional growth decline during the 2020 pandemic year by a dummy variable). However, if we bring the known values of both variables for 2023 into the equations, we obtain negative economic growth of -0.8% and -0.1% in 2023 for Flanders and Wallonia, respectively. The figures only reflect the weak industrial business environment and are inconsistent with the positive 1.5% growth rate for Belgium as a whole.
The quantitative exercise brings little comfort. Some indicators for which a decent time series is available (unemployment rate 1960-2022, building permits 1996-2022, capacity utilisation rate 1988-2022) do not appear to provide significant explanatory power for past regional growth. For other regional indicators (consumer confidence 2003-2022, Brussels producer confidence 2008-2022), the available time series is too short to include them meaningfully in an econometric regression. The main problem is that there are insufficient regional figures available that also capture consumption demand in an econometric model. As a result, the dynamic private consumption for Belgium as a whole in 2023 does not translate into the estimate of regional growth rates for that year.
Concluding considerations
For Belgium as a whole, real GDP growth in 2023 (+1.5%) was supported by activity in services (+2.6% in volume) and construction (+1.9%), but sharply slowed by industrial activity (-3.1%). Due to the low weight of industry in Brussels economic activity, the drop in added value in the sector undoubtedly had a much smaller impact on economic growth in Brussels than in Flanders and Wallonia. That construction still grew strongly in Belgium, despite the cooling housing market and declining household housing investment, surprised and was probably due to activity in the "civil engineering and road works" subsector. Especially in Flanders, there was a lot of work on and along the roads in 2023: in addition to large construction sites such as Oosterweel in Antwerp and the laying of fiber optic cables, it involved many smaller works that are traditionally carried out in the last year before municipal elections. It may well be, therefore, that despite the perhaps greater residential construction and renovation correction in Flanders, growth in total construction in that region was nonetheless firmer than in Wallonia and Brussels. The strong growth in services in 2023 partly reflects the sustained consumption dynamics evident in the growth figures for Belgium as a whole. Given the relatively favourable development of consumer confidence in Flanders, the growth of private consumption there was probably somewhat firmer than in Wallonia and Brussels.
Although an estimate remains difficult, it looks like economic growth in 2023 may again have been higher in Flanders than in Wallonia and Brussels. Also, unlike in 2022, Brussels growth appears to have held up better against the other two regions in 2023. This tentative, rough estimate is in line with the Regional Economic Outlook published by the Federal Planning Bureau in mid-July 2023. At that still early date, real GDP growth for Belgium as a whole in 2023 was already estimated quite correctly at 1.4% (1.5% realised). For Flanders, Wallonia and Brussels, the Planning Bureau then forecast growth for 2023 at 1.5%, 1.0% and 1.4%, respectively.3 For final results, we will have to wait until early 2025, when the National Accounts Institute (NAI) will publish 2023 figures on regional growth in Belgium.
1 Gross regional product is the gross domestic product (GDP) of a region within a country and corresponds to the total value added generated on the territory of that region.
2 The 2023 growth figure for Belgium is not yet final, as the recently released fourth-quarter GDP figure is still a flash estimate.
3 The Federal Planning Bureau makes an annual update of its regional growth projections. The estimate made in the summer of year t for regional growth in t-1 is largely based on regional data already available at that time regarding year t-1 from the National Social Security Office (NSSO). At the time of writing our research report, those figures for the year 2023 were not yet available. The growth for 2022 (not known at that time) was estimated quite correctly by the Planning Bureau in mid-2023 for Flanders (at 3.3% compared to 3.4% realised), but under- and overestimated for Wallonia (2.8% compared to 3.3% realised) and Brussels (3.6% compared to 1.5% realised), respectively.